International Journal of the Physical Sciences Vol. 6(6), pp. 1388-1394, 18 March, 2011 Available online at http://www.academicjournals.org/IJPS ISSN 1992 - 1950 ©2011 Academic Journals
Full Length Research Paper
Effect of temperature treatment on the optical characterization of ZnO-Bi2O3-TiO2 varistor ceramics M. G. M. Sabri1, B. Z. Azmi1,2*, Zahid Rizwan3, M. K. Halimah1, M. Hashim1 and M. H. M. Zaid1 1
Department of Physics, Faculty of Science, Universiti Putra Malaysia, 43400 UPM Serdang, Selangor, Malaysia. Advanced Materials and Nanotechnology Laboratory, Institute of Advanced Technology, Universiti Putra Malaysia, 43400 UPM Serdang, Selangor, Malaysia. 3 National Textile University, Sheikhupura Road, Faisalabad (37610), Pakistan.
2
Accepted 21 February, 2011
The optical band-gap energy (Eg) is an important feature of semiconductors which determines their applications in optoelectronics. So, it is necessary to investigate the electronic states of ceramic ZnO and effect of doped impurities at different processing conditions. Eg of the ceramic ZnO + xBi2O3 + xTiO2 where x = 0.5 mol%, was determined using UV-Vis spectrophotometer. The samples was prepared using solid-state route and sintered at the sintering temperatures from 1140 to 1260°C for 45 min in open air. Eg was decreased with increase of sintering temperature. XRD analysis indicates that there is hexagonal ZnO and few small peaks of inter granular layers of secondary phases, namely, Bi4Ti3O12 and Zn2Ti3O8. The relative density of the sintered ceramics decreased and the average grain size increased with the increase of sintering temperature. The variation of sintering temperatures and XRD findings are correlated with the UV-Vis spectrophotometer results of ZnO doped with 0.5 mol% of Bi2O3 and TiO2 due to the formation of interface states at all sintering temperatures. Key words: Optical band-gap, ZnO, Bi2O3, TiO2. INTRODUCTION Polycrystalline Zinc Oxide (ZnO) is used extensively in rubber, paint, cosmetics and textile industries as well as in electronic industry (Ammar and Farag, 2010; Clarke, 1999; Feng et al., 2010; Look, 2001). The ZnO based varistor is widely used as an electronic component in automobile electronics and also in sophisticated semiconductor electronic. ZnO based varistor is fabricated with different types of additives which play important roles in its non-linear characteristics. Its unique grain boundary feature is responsible for non-linear current-voltage (I-V)
*Corresponding author. E-mail:
[email protected]. (603)89466650. Fax: (603)89454454.
Tel:
Abbreviations: ZnO, Zinc oxide; XRD, X-ray diffraction; FWHM, Full width of half maximum ; VPSEM, Variable Pressure Scanning Electron Microscopy.
characteristics of the device (Clarke, 1999; Souza et al., 2003) and thus, is used to protect electrical equipment against unwanted electrical surges. Currently, ZnO based varistors are being used for low-voltage applications. ZnO based varistor is fabricated with different metal oxides of small amounts such as Bi2O3, CoO, MnO, Sb2O3, and TiO2 (Matsuoka, 1971; Snow et al., 1980; Eda, 1989; Bai et al., 1995; Toplan et al., 1997; Fah and wang, 2000). IV studies have been extensively investigated for the ZnO based varistor by previous researchers (Eda, 1989; Choon and Byoung, 2003) and it is necessary to investigate the electronic states of ceramic ZnO and the effect of doped impurities at different processing conditions. The measurement of the absorption spectrum in semiconductors leads to the determination of the optical bandgap energy (Ghoosh et al., 1995; Zelaya et al., 1994). In this study, the investigation regarding the optical properties and relationship with X-ray Diffraction (XRD) findings of ZnO doped with Bi2O3 and TiO2 at different
Sabri et al.
♦ ♥ ♣ •
ZnO B i4T i3O
12
Z n 2 T i3 O
8
T i60 11 o
1230 C Intensity (a.u.)
1389
♣ ♣
o
1200 C
♣
♥
♥♣
♥
♥
♣
o
1170 C ♥
o
1140 C
• ♦
ZnO 20
♦
♣
♣
♣
♥
♥
♥
♦
♦
30
40
♦
♦ 50
♦ ♦ ♦
60
70
♦
♦ 80
2θ
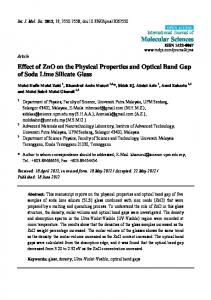
Figure 1. XRD patterns of ZnO based ceramic varistor at different sintering temperatures.
converted to absorption signal for further evaluation (Gonzalez et al., 2002). It was assumed that the fundamental absorption edge of the ceramics is due to the direct allowed transition. The optical band-gap energy is given by the expression (Smith, 1978):
sintering temperatures are discussed. EXPERIMENTAL PROCEDURE Oxide precursors of 99.9% purity (Alfa Aesar) were used. The composition consists of 99 mol% ZnO + 0.5 mol% Bi2O3 + 0.5 mol% TiO2 powder. The powder was ball milled for 24 h in deionised water. The slurry was dried at 70°C using hot plate and continuously magnetically stirred to avoid the sedimentation of the heavy particle and pre-sintered at 800°C for two hours in open air with heating and cooling rate of 6°C min-1. The pre-sintered mixture was pulverized using an agate mortar/pestle and after 1.75 wt.% Polyvinyl Alcohol binder addition, granulated by sieving 75 micron mesh screen. The mixture was then pressed into discs of 10 mm in diameter and 1 mm in thickness, each at a pressure of 2 ton/m2. Finally, the discs were sintered at 1140, 1170, 1200, 1230 and 1260°C in open air for 45 min sintering duration at heating and cooling rate of 2.66°C min-1. The disk from each sample was ground for optical and XRD characterizations. The crystalline phases were identified by an XRD (PANalytical X’Pert Pro PW3040/60, Philips) with CuK radiation and the data were analyzed, using X’Pert High Score software. The density was measured by the geometrical method taking the average of 10 disks (Wang et al., 2005). For the microstructure analysis, each of the disk samples was thermally etched at 150 °C in a tube furnace. The microstructure was examined by Variable Pressure Scanning Electron Microscopy (VPSEM, Leo 1455). The average grain size (d) was determined by lineal intercept method (Wurst and Nelson, 1972), given by: d = 1.56L/MN
(1)
where L is the random line length on the micrograph, M is the magnification of the micrograph and N is the number of the grain boundaries intercepted by lines. The UV-Vis spectrophotometer was used to measure the optical band-gap energy of the ceramics. The transmission signal was measured for the wavelength from 200 to 800 nm and then
(Ah )2 = C(h -Eg)
(2)
where A is the optical absorption coefficient, C is the constant independent of photon energy (h ), and Eg is the direct allowed optical band-gap energy. From the plot of (Ah )2 versus h , the value of Eg is obtained by using Origin Pro 8.0 software within the linear fitted regions at (Ah )2 0.
RESULTS AND DISCUSSION The XRD analysis (Figure 1), reveals diffraction peaks which belong to two phases, that is, ZnO (ICSD code: 067454) and inter granular layers in the varistor ceramics. The inter granular layers are composed of Ti6O11 (ref. code: 00-018-1401) and appeared as a very small peak in the XRD pattern for the sample sintered at 1140°C for 45 min sintering time only. Many secondary phases with small peaks were detected in the ceramics, namely, Bi4Ti3O12 (ICSD code: 024735) and Zn2Ti3O8 (ICSD code: 022381) at all sintering temperatures. Figure 2a shows the dependence of the full width of half maximum (FWHM) of the XRD peaks for the plane (100) of ZnO on the sintering temperature. The FWHM for ZnO at plane (100) slightly decreases with the increase of sintering temperature which indicates a structural ordering of ZnO inside the grain and grain boundaries. However, the FWHM of Bi4Ti3O12 (640 plane), (Figure 2b), increases with the increase of sintering temperature, which indicates a structural disordering of impurities at the grain boundaries in ZnO ceramic. The results agree
Int. J. Phys. Sci.
0.20
ZnO (100) 0.18
FWHM (deg.)
0.16
0.14
0.12
0.10
0.08 1140
1170
1200
1230 o
Sintering Temperature ( C)
0.13
1260
(a)
B i 4 T i 3 O 12 (640 )
0.12
FWHM (deg.)
1390
0.11
0.10
0.09
0.08 1140
1170
1200
1230 o
S in tering T e m pe ratu re ( C ) Sintering Temperature (°C)
1260
(b)
Figure 2. Dependence of the FWHM of XRD peaks at (a) (100 plane for ZnO) and (b) (640 plane for Bi4Ti3O12 ceramics).
94
40
93
38
92
36 34
91
32
90
30
89
28
88
1391
Average grain size (µm)
Relative density (%)
Sabri et al.
26
87
24 86 1140
1170
1200
1230
1260
o
SinteringTemperature( C) Figure 3. (a Relative density (%) and (b -
) average grain size of ZnO ceramics at different sintering temperatures.
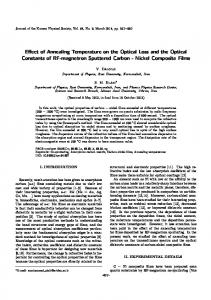
with Toyoda and Shimamoto, (1998) that dealt only with ZnO and Bi2O3. The relative density of sintered ceramics decreases with the increase of sintering temperature from 93.70 to 3 87.16% of theoretical density (5.67 g/cm ), (Figure 3a). The average grain size increased from 26.2 to 38.4 m with the increase of sintering temperature, (Figure 3b). This increase in average grain size is due to the TiO2 which is a strong grain enhancer. It was observed under VPSEM that a few abnormal grains of irregular shapes and size were distributed in the whole sample especially at high sintering temperature. The abnormal grain growth increases with increase of sintering temperature, (Figure 4). This indicates that the pores increase with the increase of sintering temperature. The pores are trapped between the large grains in the ceramics at high sintering temperature (Sabri et al., 2009).
2
Eg is estimated from the plot of (Ah ) against h , (Figure 5), and are 2.96 eV at the sintering temperature 1140°C, 2.99 eV at 1170°C, 2.97 eV at 1200°C, 2.92 eV at 1230°C and 2.94 eV at 1260°C, (Figure 6). Eg is decreased compared to the pure ZnO (3.2 eV). It is observed through linear fitting of the data that the trend in Eg is decreasing. The liquid phase of Bi2O3 generates the interface state which reduces the Eg of pure ZnO (Toyoda and Shimamoto, 1998). Doping TiO2 in ZnO-Bi2O3 system slightly reduces the Eg. Only 1140°C sintering tempera+4 ture shows that the limited substitution of Ti ions in the +4 ZnO lattice as the ionic radii of Ti (0.68 ) is smaller +2 than that of Zn (0.74 ) as evidence in XRD findings, Figure 1. The addition interface states are generated that reduces the Eg at other higher temperatures. This reduction of Eg correlates with the structural disordering increment of Bi4Ti3O12 in the grain boundaries with the
1392
Int. J. Phys. Sci.
Figure 4. SEM micrographs of ceramics after sintering at (a) 1170°C and (b) 1260°C.
Sabri et al.
25
1393
o
1140 C o 1170 C o 1200 C o 1230 C o 1260 C
20
(Ahυ)
2
15
10
5
0 1.5
2.0
2.5
3.0
3.5
4.0
4.5
Photon energy (eV)
Figure 5. Optical absorption spectra of ZnO ceramics at different sintering temperatures.
Eg (eV)
3 .0
2 .9 1140
1170
1200
1230
1260
o
S in te rin g T e m p e ra tu re ( C )
Figure 6. The variation of optical band-gap energy with sintering temperatures.
increase of sintering temperature.
structural disordering in the grain boundaries.
Conclusions
ACKNOWLEDGEMENTS
The ZnO ceramics Optical band gap energy decreases with the increase of sintering temperature. It shows the segregation Bi2O3 at grain boundaries and possibly substitution of Ti ion with Zn ion which creates interface states within the forbidden region. These results are correlated with the analysis obtained by XRD which shows a
The authors gratefully acknowledge the financial support for this work from Ministry of Higher Education of Malaysia under Research University Grant Scheme (RUGS) of Project No. 05-01-09-0754RU. One of the author’s is grateful to Department of Physical Sciences, Faculty of Science and Technology, Universiti Malaysia
1394
Int. J. Phys. Sci.
Terengganu and Ministry of Higher Education for supporting the studies. REFERENCES Ammar AH, Farag AAM (2010). Investigation of deep level transient spectroscopy (DLTS) of dopant ZnO-based varistors, Phys. B., 405:1518. Bai SN, Shieh JS, Tseng Ty (1995). Characteristic analysis of ZnO varistors made with spherical precipitation powders, Mater. Chem. Phys., 41:104-109. Choon WN, Byoung-Chil S (2003). Highly stable nonlinear properties of ZnO–Pr6O11–CoO–Cr2O3–Y2O3-based varistor ceramics. Mater. Lett., 57:1322-1326. Clarke DR (1999). Varistor ceramics. J. Am. Ceram. Soc., 82(3):485502. Eda K (1989). Zinc oxide varistor. IEEE Elect. Insul. Mag., 5: 28-41. Fah CP, Wang J (2000). Effect of high-energy mechanical activation on the microstructure and electrical properties of ZnO-based varistors. Solid State Ionics. 132:107-117. Feng H, Peng Z, Fu X, Fu Z, Wang C, Qi L, Miao H (2010). Effect of TiO2 doping on microstructural and electrical properties of ZnO– Pr6O11-based varistor ceramics, J. Alloy. Compd., 497: 304. Ghoosh AK, Som KK, Chatterjee S, Chaudhuri BK (1995). Photoacoustic spectroscopic study of energy gap, optical absorption, and thermal diffusivity of polycrystalline ZnSexTe1-x (0