Contrib Mineral Petrol (2017) 172:15 DOI 10.1007/s00410-017-1329-1
ORIGINAL PAPER
Effect of water on the fluorine and chlorine partitioning behavior between olivine and silicate melt Bastian Joachim1,2 · André Stechern3 · Thomas Ludwig4 · Jürgen Konzett1 · Alison Pawley5 · Lorraine Ruzié‑Hamilton5 · Patricia L. Clay5 · Ray Burgess5 · Christopher J. Ballentine2
Received: 14 September 2016 / Accepted: 16 January 2017 © The Author(s) 2017. This article is published with open access at Springerlink.com
Abstract Halogens show a range from moderate (F) to highly (Cl, Br, I) volatile and incompatible behavior, which makes them excellent tracers for volatile transport processes in the Earth’s mantle. Experimentally determined fluorine and chlorine partitioning data between mantle minerals and silicate melt enable us to estimate Mid Ocean Ridge Basalt (MORB) and Ocean Island Basalt (OIB) source region concentrations for these elements. This study investigates the effect of varying small amounts of water on the fluorine and chlorine partitioning behavior at 1280 °C and 0.3 GPa between olivine and silicate melt in the Fe-free CMAS+F–Cl–Br–I–H2O model system. Results show that, within the uncertainty of the analyses, water has no effect on the chlorine partitioning behavior for bulk water contents ranging from 0.03 (2) wt% H2O (DClol/melt = 1.6 ± 0.9 × 10⁻⁴) to 0.33 (6) wt% H2O (DClol/melt = 2.2 ± 1.1 × 10⁻⁴). Consequently, with the effect of pressure being negligible in the uppermost mantle (Joachim et al. Chem Geol 416:65–78, 2015), temperature is the only parameter that needs to be considered Communicated by Jochen Hoefs. * Bastian Joachim
[email protected] 1
Institute for Mineralogy and Petrography, University of Innsbruck, Innrain 52, 6020 Innsbruck, Austria
2
Department of Earth Sciences, University of Oxford, South Parks Road, Oxford OX1 3 AN, United Kingdom
3
Institute for Mineralogy, Leibniz University of Hannover, Callinstrasse 3, 30167 Hannover, Germany
4
Institute of Earth Sciences, Heidelberg University, In Neuenheimer Feld 234‑236, 69120 Heidelberg, Germany
5
School of Earth and Environmental Sciences, The University of Manchester, Manchester M13 9PL, United Kingdom
for the determination of chlorine partition coefficients between olivine and melt at least in the simplified iron-free CMAS+F–Cl–Br–I–H2O system. In contrast, the fluorine partition coefficient increases linearly in this range and may be described at 1280 °C and 0.3 GPa with (R2 = 0.99): Dol/melt = 3.6 ± 0.4 × 10⁻³ × XH2 O (wt%) + 6 ± 0.4 F −4 × 10 . The observed fluorine partitioning behavior supports the theory suggested by Crépisson et al. (Earth Planet Sci Lett 390:287–295, 2014) that fluorine and water are incorporated as clumped OH/F defects in the olivine structure. Results of this study further suggest that fluorine concentration estimates in OIB source regions are at least 10% lower than previously expected (Joachim et al. Chem Geol 416:65–78, 2015), implying that consideration of the effect of water on the fluorine partitioning behavior between Earth’s mantle minerals and silicate melt is vital for a correct estimation of fluorine abundances in OIB source regions. Estimates for MORB source fluorine concentrations as well as chlorine abundances in both mantle source regions are within uncertainty not affected by the presence of water. Keywords Fluorine · Chlorine · Halogen · Partitioning · Water · H2O · Earth’s mantle · Mid Ocean Ridge Basalt (MORB) · Ocean Island Basalt (OIB) · Olivine · Forsterite · SIMS
Introduction Owing to their incompatibility and volatility, the distribution of H2O and halogens in the Earth’s mantle is influenced by processes such as fluid mobility, oxygen fugacity, fractionation, degassing, and partial melting. With quantification of their distribution between different mantle phases,
13
Vol.:(0123456789)
15
Page 2 of 15
this makes halogens excellent tracers of volatile transport processes (e.g., Schilling et al. 1980; Ito et al. 1983; Jambon et al. 1995). The volatile budget of the mantle profoundly affects, for instance, its viscosity, and therefore, the mode of mantle convection (e.g., Steinbach and Yuen 1995) responsible for heat transport and planetary cooling, implying that knowledge of the Earth’s mantle volatile distribution will provide insight into the history and evolution of our planet. The determination of halogen abundances in Mid Ocean Ridge Basalt (MORB) and Ocean Island Basalt (OIB) source regions allows us to quantify volatile concentrations in their respective source regions (e.g., Beyer et al. 2012; Joachim et al. 2015). Comparing OIB source halogen concentrations with primitive mantle estimates enables us to better understand and quantify any volatile transport processes during recycling of oceanic crust. For a long time, the only available approach to estimate bulk halogen concentrations, such as fluorine and chlorine, in MORB and OIB mantle source region was based on the analysis of element ratios, such as F/P, F/Sr and F/ Nd, or Cl/K and Cl/Nb obtained from natural samples that were used as a proxy (Schilling et al. 1980; Ito et al. 1983; Michael and Schilling 1989; Déruelle 1992; Jambon et al. 1995; McDonough and Sun 1995; Newsom 1995; Wedepohl 1995; Saal et al. 2002; Salters and Stracke 2004; Le Roux et al. 2006; Workman et al. 2006; Shaw et al. 2008; Pyle and Mather 2009; Palme and O’Neill 2014). MORB and OIB source region estimates show, to date, a significant uncertainty. For example, fluorine OIB source region concentration estimates range from 8 ppm (Beyer et al. 2012) to 55 ppm (Kovalenko et al. 2006), which covers a range from depleted to enriched abundances relative to primitive mantle estimates. An independent approach is the experimental simulation of partial melting processes at the respective Earth’s mantle source region conditions. By combining experimentally determined partition coefficients with natural halogen concentrations in oceanic basalts, halogen source region concentrations can be estimated. Recent experimental studies determined fluorine and chlorine partitioning data at pressure and temperature (P–T) conditions relevant for MORB and OIB source mantle regions between olivine, pyroxene, and corresponding silicate melt (Hauri et al. 2006; O’Leary et al. 2010; Beyer et al. 2012, 2016; Dalou et al. 2012; Joachim et al. 2015; Rosenthal et al. 2015). Joachim et al. (2015) showed that fluorine partitioning into olivine increases at nominally dry conditions by about two orders of magnitude between 1350 and 1600 °C at pressures ranging from 1 to 2.3 GPa. The effect of pressure on fluorine partitioning between olivine and melt is negligible at least for pressures ranging between 1 bar-2.5 GPa (e.g., Beyer et al. 2012; Joachim et al. 2015). Fluorine partitioning data between olivine and silicate melt were determined by Hauri
13
Contrib Mineral Petrol (2017) 172:15
et al. (2006) and Dalou et al. (2014) with melt H 2O contents of 1.7–25 wt% and in the P–T range 1185–1245 °C and 1–4 GPa. Their data plot approximately 0.5–1 orders of magnitude above the trend shown in Joachim et al. (2015) and are roughly in agreement with partition coefficients determined at higher temperatures ranging from 1345 to1400 °C and pressures ranging from 1 bar to 2.5 GPa in nominally dry CMAS+F and NCMAS+F systems (Beyer et al. 2012). A potential explanation for the different fluorine partitioning behavior in hydrous and nominally anhydrous systems is the presence of water, which may lead to an increase of fluorine partitioning into olivine. Chlorine partitioning between olivine and silicate melt is hardly investigated experimentally. Joachim et al. (2015) showed that chlorine partition coefficients between olivine and silicate melt in a nominally dry CMAS+F-Cl-Br-Isystem increases by approximately 1.5 orders of magnitude between 1350 and 1600 °C at pressures ranging from 1.0 to 2.3 GPa. This increase is approximately comparable to the temperature effect on the fluorine partitioning behavior in the same temperature range. One data point provided by Dalou et al. (2014) from an experiment performed at 1240 °C and 1.2 GPa in the presence of a melt water content of 2.6 wt% plots about one order of magnitude above the trend shown in Joachim et al. (2015). This may indicate that the presence of water affects the chlorine partitioning behavior between olivine and melt. To the best of our knowledge, no study have been available so far investigating the effect of variable bulk water contents on the fluorine and chlorine partitioning behavior between olivine and melt at a constant temperature. Halogens may be incorporated into the olivine structure as point or planar defects. One type of planar defects known are humite-type lamellae (Kitamura et al. 1987; Drury et al. 1991; Risold et al. 2001; Stalder and Ulmer 2001; Wirth et al. 2001; Hermann et al. 2007). Transmission electron microscope (TEM) investigations give no indication for their presence at MORB or OIB source P–T conditions (Beyer et al. 2012; Joachim et al. 2015). This has led to the conjecture that fluorine and chlorine are incorporated as point defects in the olivine lattice at Earth’s mantle conditions. Potential mechanism may involve [MgO2]2− = [F2]2− as suggested by Bernini et al. (2013), or the replacement of a [SiO4]4− tetrahedron by a [F4]4− quadruplet (Crépisson et al. 2014) as proposed for fluorine incorporation in calcic and magnesian garnets (Valley et al. 1983; Smyth et al. 1990; Visser 1993). Recent halogen mantle source region estimates indicate that the MORB source region is degassed by 22–88% in fluorine and 22–99% in chlorine relative to the primitive mantle (Joachim et al. 2015). The OIB source region, on the other hand, has a chlorine content similar to that of the primitive mantle, but is enriched in fluorine by a factor
SiO2
45.94 (62) 45.80 (88) 45.03 (86)
43.12 (68) 42.84 (44) 42.20 (41)
43.67 (87) 43.58 (50)
52.09 (65)
Partitioning experiments Melt CMAS_dry
CMAS_05
CMAS_2
Olivine CMAS_dry
CMAS_05
CMAS_2
Anorthite CMAS_dry
CMAS_05
Clinopyroxene CMAS_dry
46.88 (51) 46.19 (57) 45.74 (57)
Starting materials Halogen-free CMAS_start_dry CMAS_start_05
Sample
SiO2
Sample 18.89 (33) 18.70 (44) 18.56 (47)
Al2O3
6.22 (27)
35.81 (30)
35.69 (19)
0.13 (10)
b.d
b.d
19.80 (50)
19.79 (33)
17.67 (22)
Al2O3
18.39 (26) 18.24 (19) 17.87 (33)
MgO
18.09 (117)
0.30 (5)
0.28 (17)
56.84 (85)
57.71 (71)
57.69 (108)
14.16 (24)
13.57 (38)
13.16 (30)
MgO
17.02 (31) 17.46 (30) 17.36 (23)
CaO
0.30 (4)
0.38 (6)
0.74 (4)
F
b.d 0.86 (2) 0.58 (2)
Cl
24.06 (53)
19.84 (53) 19.79 (44)
0.44 (8)
0.46 (3)
b.d
b.d
b.d
b.d
b.d
0.58 (14) b.d
21.84 (41) 19.37 (62) 18.75 (43)
CaO
b.d 0.23 (4) 0.27 (4)
F
b.d
b.d
b.d
b.d
b.d
b.d
0.39 (4)
0.76 (6)
2.24 (12)
Cl
100.46 (114)
99.84 (108) 99.48 (104)
101.39 (109) 101.01 (98) 99.61 (127)
101.56 (100) 99.67 (156) 98.43 (153)
Total
101.18 (95) 100.82 (118) 99.80 (145)
Total
0.04 (2)
0.34 (3) 0.06 (6)
0.12 (4) 0.15 (5) 0.21 (4)
Crystal/ melt
Table 1 EMP analyses of starting material glasses and experimental samples. The “halogen-free” glass was used as starting material for the synthesis of three “CMAS_start” glasses, which contain various amounts of H 2O (Table 2) and halogens. These were used as starting materials for the partitioning experiments. Values represent the average of ten single measurements in the starting materials and five single measurements in each phase of each partitioning experiment. Uncertainties are given as 2σ. (b.d. = below detection limit). Crystal/melt ratios were determined via image analyses of BSE images using the software “ImageJ”
Contrib Mineral Petrol (2017) 172:15 Page 3 of 15 15
13
15
Page 4 of 15
of 1.4–4.2 relative to the primitive mantle (Joachim et al. 2015). This implies that most of the subducted chlorine is transported back to the surface by arc volcanism, whereas significant amounts of fluorine reach deeper portions of the Earth’s mantle through subduction of oceanic lithosphere (Straub and Layne 2003; Joachim et al. 2015). However, to date, none of the available fluorine and chlorine source region estimates consider the potential effect of water on the halogen partitioning behavior between olivine and melt. Bulk water abundance estimates for source peridotite beneath normal ridges (N-MORB) range from 50 to 250 ppm H2O (Michael 1988, 1995; Danyushevsky et al. 2000; Dixon et al. 2002; Saal et al. 2002; Simons et al. 2002; Hirschmann 2006; Green et al. 2014) and from 200 to 1100 ppm for H 2O concentrations in OIB source regions (e.g., Dixon et al. 1997, 2002; Jamtveit et al. 2001; Hauri 2002; Hirschmann 2006; Green et al. 2014). Moreover, nominally dry high-pressure (Piston and Multianvil) experiments that simulate partial melting processes in mantle source regions to determine halogen partition coefficients are not perfectly dry (e.g., Kovács et al. 2012; Green et al. 2014). Minor amounts of volatiles might be introduced to the capsule as surface water adsorbed on to the grains of pre-dried powder. In addition, metal capsules are permeable to traces of water in high-pressure experimental assemblies at high P–T conditions (e.g., Patiño Douce and Beard 1994; Truckenbrodt and Johannes 1999; Kovács et al. 2012; Green et al. 2014), so that water stemming from the natural pressure medium (e.g., talc) may infiltrate the capsule during the experimental runs (Joachim et al. 2012). This implies that water may affect the halogen partitioning behavior between olivine and melt in MORB and OIB source regions as well as during “nominally dry” high-pressure experiments that simulate partial melting processes in these source regions. In this study, we investigate the effect of water on the fluorine and chlorine partitioning behavior between olivine and silicate melt at 0.3 GPa and 1280 °C. This allows us to evaluate the effect of water on fluorine and chlorine source region estimates and the potential consequences for our understanding of the Earth’s mantle halogen and volatile cycle.
Experimental methods Rationale Partitioning experiments were performed in the Fe-free CaO–MgO–Al2O3–SiO2 (CMAS)+F–Cl–Br–I–H2O system (Table 1). Knowledge about the effect of water on the halogen partitioning behavior between olivine and melt is a prerequisite for experimental setups that are able to control
13
Contrib Mineral Petrol (2017) 172:15
oxygen fugacities, e.g., using a double capsule technique (e.g., Boettcher et al. 1973; Matjuschkin et al. 2015). Thus, knowledge about the effect of water will enable us in a next step to introduce Fe at controlled oxygen fugacities to the system. Defined amounts of water and halogens were added as H2O, CaF2, CaCl2, CaBr2, and C aI2 (Tables 1, 2). Experiments were performed in a two-step approach using an Internally Heated Pressure Vessel (IHPV). First, hydrous, halogen bearing silicate glasses were synthesized at 1450 °C and 0.2 GPa to be used as starting materials. This method allows the exact determination of starting material compositions using the electron microprobe (EMP) for major element concentrations and infrared (IR) spectroscopy for bulk H2O abundances. All experiments were then performed in the same run, i.e., at identical P–T conditions (1280 °C, 0.3 GPa) and with almost identical major element starting material composition (Table 1) but varying bulk water content (Table 2). Large crystals were obtained using the temperature oscillation technique (Erdmann and Koepke 2016). Back-scattered electron (BSE) images and EMP analyses were acquired to examine the phase assemblage and distribution in each sample. The water content in melt pools after the run as well as fluorine and chlorine concentrations in olivines and melt pools were determined using secondary ion mass spectrometry (SIMS). Fluorine and chlorine melt-pool concentrations were confirmed by the EMP analysis. This experimental procedure allows the determination of fluorine and chlorine partition coefficients between olivine and melt (Table 3) at bulk water contents ranging from 0.03 to 0.33 wt% (Table 2), and enables us to assess the effect of water on the partitioning behavior. Bromine and iodine abundances in olivines were below the detection limit of the methods and will be part of a subsequent contribution using a new analytical technique that will be based on the determination of halogen abundances by the analysis of noble gases produced by neutron irradiation (Johnson et al. 2000; Ruzié-Hamilton et al. 2015). Starting materials Starting materials were prepared from pure, analytical grade oxides, carbonates, and halides. First, dried (105 °C, 30 min) CaCO3, MgO, Al2O3, and SiO2 powders were thoroughly mixed in an agate mortar and heated to 1600 °C for 3 h in a 1 atm chamber furnace using a platinum crucible. 105 °C is not sufficient to remove magnesium hydroxide resulting in a small weight-in uncertainty. After quenching, the glass was ground, remixed, and reheated to 1600 °C for 3 h. The “halogen-free” starting material (Table 1) was split into three equal parts. Defined amounts of halides were added as CaF2, CaCl2, CaBr2, and CaI2 (Table 1) to each part. Glasses were reground, mixed to homogenize
Contrib Mineral Petrol (2017) 172:15
Page 5 of 15 15
Table 2 Nominal water content of starting materials calculated from their initial weight; water content of glassy starting materials was determined using FTIR analysis (see text and Fig. 2 for details); water content of melt pools after partitioning experiments was determined using SIMS; bulk water contents after partitioning experiments were calculated assuming that the water content in crystalline Sample
H2O (nominal; starting material; wt%)
CMAS_dry CMAS_05 CMAS_2
0 0.05 0.2
phases is negligible compared to the water content of melt pools (see "Halogen incorporation mechanism in olivine" for details): H2Obulk − after experiment = H2OSIMS−melt pool × (1-(crystal/melt)total) with (crystal/melt)total being the bulk sample crystal/melt ratio derived from Table 1. Uncertainties are given as 2σ
H2O (FTIR; starting material; wt%)
b.d 0.23 (2) 0.30 (3)
H2O (SIMS; melt pool; H2O (bulk – after wt%) experiment; wt%) 0.06 (2) 0.33 (4) 0.42 (4)
Table 3 Fluorine and chlorine concentrations in olivine and melt were determined using SIMS. Fluorine and chlorine partition coefficients between olivine and silicate melt were calculated as Dol/melt
0.03 (2) 0.26 (7) 0.33 (6)
= Ccrystal/Cmelt. Determination of uncertainties is described in detail in "Addition of water to experimental charges during preparation of high P-T experiments"
Sample
Fol (SIMS; ppm)
Clol (SIMS; ppm)
Fmelt (SIMS; wt%)
Clmelt (SIMS; wt%)
DFol/melt (10−4)
DClol/melt (10−4)
CMAS_dry CMAS_05 CMAS_2
5.4 (14) 5.7 (26) 4.4 (23)
3.6 (17) 1.5 (10) 1.2 (6)
0.83 (9) 0.37 (1) 0.25 (1)
2.21 (14) 0.83 (1) 0.51 (1)
6.6 (29) 15.6 (73) 17.3 (76)
1.6 (9) 1.9 (13) 2.2 (11)
all components, dried at 105 °C for at least 30 min, and subsequently filled into annealed platinum capsules of 4.8 mm inner diameter, 5.2 mm outer diameter, and 4 cm length. Defined small amounts of water (0.05 wt; 0.2 wt%; Table 2) were added to two of the capsules using a micro syringe and the capsules were sealed shut immediately using a point welder. The third capsule was dried at 600 °C for 1 h without addition of H 2O before it was subsequently sealed shut to provide as dry conditions as possible. Synthesis of starting materials and partitioning experiments was performed in an IHPV at the Leibniz University of Hannover, Germany. A detailed description of this apparatus is given in Berndt et al. (2002). The capsule was placed close to the maximum temperature position in the sample holder between two furnace controlling thermocouples (S-Type). Temperature at the capsule position was controlled by a third thermocouple (S-Type). For synthesis of starting materials, capsules were heated to 1450 °C at a constant pressure of 0.2 GPa with argon gas used as pressure medium, and held for at least 14 h. To avoid the formation of quench crystals during cooling, capsules were quenched rapidly by melting a platinum wire that held the capsule in place, so that the capsule dropped to the cold zone of the sample holder (Berndt et al. 2002). Following quenching, small glass fragments were separated from both ends of the glass cylinder and double polished for EMP and FTIR analyses (see "Textural observations and major element compositions"). The remaining glasses were reground in an agate mortar, dried at 105 °C for at least 2 h, and used for subsequent partitioning experiments.
Partitioning experiments After a series of test experiments, 1280 °C and 0.3 GPa were chosen as ideal P–T condition for the execution of all partial melting experiments presented in this study. At this P–T condition, all samples reveal a mixture of large crystals embedded in silicate melt and a crystal/melt ratio of about 0.2–0.5 (Table 1). This enables us to analyze the fluorine and chlorine concentrations in olivine and melt and the water concentration in the melt of each sample (Tables 1, 2, 3). Dried starting materials (Table 1) were filled into annealed platinum capsules of 2.8 mm inner diameter and 3.2 mm outer diameter and 9 mm length, which were sealed shut immediately using a point welder. All experiments were performed in an IHPV located at the Leibniz University of Hannover. The three platinum capsules containing the three starting material compositions (Table 1) were placed in one sample holder, so that all three experiments with varying water contents were performed simultaneously in one run at identical pressure and temperature conditions. Pressure was kept constant at 300 ± 5 MPa throughout the run (pressure medium: dry argon gas). Experiments were first heated to the target temperature Ttarget = 1280 ± 2 °C at a rate of 50 °C/min and held for 1 h. Following this, the temperature was set to oscillate with a period of 1 h between T target +20 °C and T target -20 °C (Erdmann and Koepke 2016). After 48 temperature oscillation cycles (with a total duration of 48 h), the temperature was kept constant for another 48 h to ensure equilibrium
13
15
Page 6 of 15
Contrib Mineral Petrol (2017) 172:15
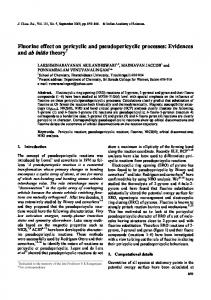
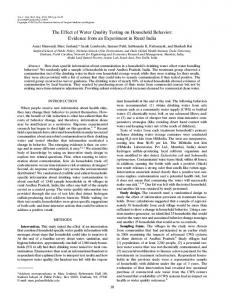
conditions. This method allows growth of large crystals (Fig. 1), which is a prerequisite for SIMS analysis. At the end of the runs, we applied the rapid quench technique to avoid nucleation of quench crystals (Berndt et al. 2002). Quenched samples were polished, cleaned with ethanol and water, and mounted in pure indium following Hauri et al. (2002). Analyses Electron microprobe Samples were analyzed using a Cameca SX 100 EMP located at the Leibniz University of Hannover, Germany. BSE images were used to determine grain sizes, textures, and crystal/melt ratios in each sample. Chemical compositions of crystals and melts were obtained by wavelength dispersive analysis. Operating conditions for all analyses of crystalline materials were 15 kV acceleration voltage, 15 nA beam current, 10 s counting time on the respective peak, and 10 s on background with focused beam. Glasses (starting materials and melt pools) were analyzed using a defocused beam (5 µm) and 4 nA beam current. Wellknown standards were used for EMPA calibration (Mg on MgO; Si on wollastonite; Al on Al2O3; Ca on wollastonite; Cl on NaCl; F on S rF2). Ten single spots in the glass of each starting material were analyzed. In the run products, five spots were taken in each phase of each sample with varying distance to the crystal–melt interfaces to determine the major element (CaO, MgO, Al2O3, SiO2), fluorine, and chlorine concentrations (Table 1). Fourier transformation infrared spectroscopy (FTIR) Bulk water contents of starting materials were determined by Fourier Transformation Infrared Spectroscopy (FTIR). IR absorption spectra of doubly polished glass wafers with a thickness of 260–310 µm were recorded using a “Bruker IRscopeII” microscope connected to a “Bruker IFS88” FTIR spectrometer located at the University of Hannover, Germany. A Globar light source (MIR), KBr beam splitter, and a DTGS detector were used for each measurement. The measurement range was 2000–6000 cm−1. 50 single scans were averaged per spectrum with a resolution of 2 cm−1. A slit aperture was used between the objective and the detector to limit the analyzed sample volume. The area selected by the slit was about 100 × 100 µm wide. For each starting material, five individual measurements were taken at different positions and averaged. Spectra were fitted using the “OPUS” software. Starting material bulk water contents were quantified from the peak height of the OH stretching vibration band at 3550 cm−1 (Fig. 2) after subtracting a linear base line following the method of Mercier et al. (2010)
13
Fig. 1 Back-scattered electron images of IHPV runs showing a silicate melt containing a clinopyroxene, plagioclase, and olivine (CMAS_dry), b plagioclase, olivine (CMAS_05), and c olivine (CMAS_2)
Contrib Mineral Petrol (2017) 172:15
Page 7 of 15 15
Absorbance (normalized to thickness)
60 CMAS_2 CMAS_05 CMAS_dry
50
40
30
20
10
0 4000
3600
3200
2800
2400
2000
Wavenumber (cm-1)
Fig. 2 FTIR spectra of glassy starting materials “CMAS_start_dry”, “CMAS_start_05”, and “CMAS_start_2” showing the wavenumber region of the OH stretching vibration band at 3550 cm−1
and using their FTIR absorptivity coefficient for basalt glass. Densities of basaltic glasses could not be determined directly due to the small sample volume but were estimated to 2.6 ± 0.2 g/cm3 (e.g., Mercier et al. 2010). The starting material bulk water contents presented in Table 2 represent the average of five single analyses taken at different positions of each starting material. Secondary ion mass spectrometry (SIMS) Fluorine and chlorine concentrations in olivine and melt Fluorine and chlorine concentrations of olivine crystals and glasses were determined in two separate sessions using a Cameca 1270 located at the University of Edinburgh, United Kingdom. First, samples were gold coated to provide electrical conductivity. Sample spots were pre-sputtered for 60 s at the beginning of each analysis to suppress surface contamination and amorphize the surface of crystalline materials. Pre-sputter and analytical conditions were identical. In total, in each sample, 10–30 single spots were analyzed in the olivines and 6–10 spots in the melt pools. Settings for all measurements are summarized as follows: A C s+ primary ion beam with a primary current of 1 nA was accelerated to 10 keV and focused to a spot diameter of ~5 µm. Negative secondary ions were accelerated to 10 keV and analyzed using an electron multiplier detector with an energy width of 40 eV. Peak counting times were 4 s each for 19F and 35Cl, and 2 s for 30Si. Vacuum was set to 1·10−7 mbar. Mass resolving power was adjusted to M/ΔM ≈ 3000, which is adequate to resolve 19F from the potential interferences of 18OH and 16OH3. The typical chal-
lenging interference for the analysis of Cl is the SH molecule, which is not relevant in this study, because the system is sulfur free. Detection limits were about one ppm for both, fluorine and chlorine. Fluorine and chlorine concentrations in minerals and melt pools were normalized to the 30Si count rate and determined using the fluorine (3000 ppm) and chlorine (7400 ppm) concentration of the “Halogen standard 3” reference material (Joachim et al. 2015). To verify the accuracy of this method, a BCR-2 g glass standard reference material (440 ppm fluorine; USGS certificate of analysis) and Lipari obsidian standard glass (0.36 wt% chlorine; Hunt and Hill 1993; Kuehn et al. 2009) were analyzed before the measurement of each sample. Melt-pool fluorine and chlorine concentrations were also determined using EMP analysis (Table 1). These provide a first-order independent method for the determination of F and Cl meltpool abundances. Both methods give within uncertainty identical fluorine and chlorine concentrations (Tables 1, 3), confirming that SIMS analyses are within uncertainty accurate (Table 3 and "Addition of water to experimental charges during preparation of high P-T experiments"). The amorphous structure and composition of basaltic glasses (melt pools) is directly comparable to the composition and structure of the basalt glass “Halogen standard 3” (Joachim et al. 2015), so that, for this phase, only the uncertainty of the analytical method (SIMS) and the reproducibility of the measurements were considered for the determination of total analytical uncertainties. The pre-sputter process amorphizes crystalline materials, so that relative sensitivity factors of glassy standard materials can likely be applied to crystalline and amorphous materials (e.g., Stephan and Lyon 2013). A detailed study, which compares matrix effects of glass standards with defined halogen concentrations used for the analyses of crystalline samples, is, however, still missing. To make sure that the potential for a systematic error stemming from this matrix effect is adequately covered by the total uncertainty, we applied an additional conservative uncertainty of a factor of two for the determination of fluorine and chlorine abundances in olivines, following Joachim et al. (2015). H2O melt‑pool concentration Hydrogen concentrations in the melt pools were determined with a Cameca ims3f ion probe at Heidelberg University using a 16O− primary ion beam with a net energy of 14.5 keV, a beam current of 10 nA and a spot diameter of ~15 µm. Positive secondary ions were accelerated to 4.5 keV with an offset of 75 eV (energy filtering), an energy window width of 40 eV, and a mass resolving power of M/ΔM ≈ 400. To minimize in situ hydrogen contamination, the area analyzed was limited to ~6 µm (nominal imaged field 25 µm; field aperture 400 µm) and a liquid nitrogen cold trap in the sample chamber was
13
15
Page 8 of 15
used. Prior to 6 analysis cycles with an integration time of 3 s for H + and 30Si+ per cycle, the sample was pre-sputtered for 240 s to remove the initial water and hydrocarbon surface contamination. The H + background signal due to in situ contamination was equivalent to ≤50 µg/g H2O and at least a factor 10 below the lowest value analyzed (CMAS_dry: 0.06 wt%, Table 2). At a sensitivity of ~1 cps H + for 1 µg/g H2O, the detection limit of this analytical setup was dominated by the intensity of the background signal. Because of the high H 2O concentrations, it was not necessary to determine (and correct for) the rate of in situ contamination (see Ludwig and Stalder 2007 for a more detailed description of the setup). Quantification was done using relative ion yields (reference isotope 30Si) with a hydrated glass (5.9 wt% H2O, equivalent to glass ‘CG 1’ in Acosta-Vigil et al. 2006) as reference material.
Results Textural observations and major element compositions EMPA results show that all starting materials are homogeneous glasses and have within uncertainty identical major element concentrations (Table 1). FTIR results show that the bulk water content of the dry starting material is below the detection limit of the method (