J. Dairy Sci. 100:1–13 https://doi.org/10.3168/jds.2016-12346 © American Dairy Science Association®, 2017.
Effect of yeast supplementation on performance, rumination time, and rumen pH of dairy cows in commercial farm environments V. Ambriz-Vilchis,*†1 N. S. Jessop,‡ R. H. Fawcett,§ M. Webster,† D. J. Shaw,# N. Walker,‖ and A. I. Macrae* *Dairy Herd Health and Productivity Service, Royal (Dick) School of Veterinary Studies and the Roslin Institute, The University of Edinburgh, Easter Bush Veterinary Centre, Roslin, Midlothian, EH25 9RG, Scotland, UK †BioSimetrics Ltd., The Cottage Scotland’s Rural College Building, West Mains Road, Edinburgh, Lothian, EH9 3JG, Scotland, UK ‡20 Crofts Road, Lauder TD2 6QJ, Scotland, UK §School of GeoScience, The University of Edinburgh, EH9 3FE, Scotland, UK #Royal (Dick) School of Veterinary Studies and the Roslin Institute, The University of Edinburgh, Easter Bush Veterinary Centre, Roslin, Midlothian, EH25 9RG, Scotland, UK ‖AB Vista, Blenheim Road, Marlborough Business Park, Marlborough, Wiltshire, SN8 4AN, England, UK
ABSTRACT
Key words: yeast, rumen pH, rumination time, dairy cow, acidosis
The aims of the present study were to evaluate the effects of live yeast supplementation (Vistacell MUCL 39855, AB Vista, Marlborough, UK) on performance, rumination time, and rumen pH on dairy cows in commercial farm environments. Three trials were carried out, the trials lasted 12 (trial 1), 15 (trial 2), and 19 wk (trial 3). In each trial, 14 multiparous Holstein dairy cows were allocated to 2 groups that received (trial 1) a standard diet plus yeast, (trial 2) an acidogenic diet plus yeast, and (trial 3) grazing pasture plus yeast. Milk production, milk chemical characteristics, body weight and body condition score, rumination time, and rumen pH were monitored for each group throughout the 3 trials. No statistically significant differences were observed in any of the 3 trials for any of the recorded variables. In contrast, an effect of time (period or days in milk) on rumen pH was observed in all 3 of the trials, as time spent under the acidotic thresholds increased across the experimental periods; however the differences were not associated with live yeast supplementation. No effect of live yeast supplementation was observed in any of the 3 trials reported. Further research should include studies on animals at different stages of lactation (with emphasis on transition period and early lactation), consuming more challenging diets (higher level of inclusion of concentrates or starch), or under different environments such as grazing of succulent forages. Such studies might be required to elucidate any possible effect of live yeast supplementation of dairy cows when the rumen environment is under challenge.
INTRODUCTION
Modern dairy cow feeding strategies focus on meeting the energy requirements for high levels of milk production by encouraging maximum intakes of energy-dense, low-fiber diets with highly fermentable carbohydrates (Marden et al., 2008). Despite this management regimen having an immediate positive effect on milk yield, in the medium to long-term there are potentially many negative effects on dairy cow health, welfare, and performance (Zebeli et al., 2007). Ruminant nutrition has been continually searching for alternatives to enhance production, or to correct issues that potentially may reduce productivity or affect health. Direct-fed microbials (e.g., yeast) have been used as additives to improve rumen function and animal performance by increasing the capacity of fiber digestion (in vitro, in situ, and in vivo), aid in the prevention of low rumen pH, and reduce the incidence of SARA in vivo (Fonty and Chaucheyras-Durand, 2006; Bach et al., 2007). Saccharomyces cerevisiae is the most common yeast supplement given to dairy cows, and its use is common practice in the dairy industry. Different types of yeast products are commercially available, including live yeast products (for the purpose of this paper also referred as “yeast”) and yeast fermentation products. To be considered as live yeast, manufactured products must contain a certain level of live cells (>1.0 × 10¹⁰ cfu/g of DM; Fonty and Chaucheyras-Durand, 2006; Chaucheyras-Durand et al., 2008; AlZahal et al., 2014; Malekkhahi et al., 2016). It is thought that live yeast can modify the rumen environment by utilizing available oxygen and other components (Newbold et al., 1996). It also favors the number and activity of rumen cellulolytic bacteria that help reduce the level of
Received November 22, 2016. Accepted March 28, 2017. 1 Corresponding author:
[email protected]
1
2
AMBRIZ-VILCHIS ET AL.
changes in rumen pH (Marden et al., 2008; Al Ibrahim et al., 2012) and will improve digestive function (Fonty and Chaucheyras-Durand, 2006; Chaucheyras-Durand et al., 2008, 2016; Al Ibrahim et al., 2010a). Several studies have looked at the effect of live yeast supplementation in dairy cows on the rumen environment (Bach et al., 2007; Guedes et al., 2008; Bayat et al., 2015; Malekkhahi et al., 2016), performance (Kalmus et al., 2009; Bitencourt et al., 2011; Tristant and Moran, 2015), animal behavior (Bach et al., 2007; DeVries and Chevaux, 2014), and health (Chung et al., 2011; AlZahal et al., 2014). The review by Chaucheyras-Durand et al. (2008) looked at yeast mode of action, effects on rumen environment, effects on digestive by-products [N (NH3 and N microbial metabolism) and CH4 mitigation], and effects of live yeast combined with other feed additives. Desnoyers et al. (2009) carried out a quantitative analysis of the literature by performing a meta-analysis of the effects of live yeast supplementation on performance in different ruminant species. After collating data from more than 150 experiments, those authors found that live yeast supplementation had a positive effect on rumen pH, DMI, and milk yield. Despite the quantity of research accumulated over several decades into the use of yeast as a feed additive, the results have been variable and the proposed benefits of live yeast supplementation have not always been demonstrated. For example, using 10 g/cow per day of yeast (Yea-Sacc 1026, Alltech Biotechnology Center, Nicholasville, KY), Kalmus et al. (2009) found no effect on milk yield when yeast was supplemented to early-lactation dairy cows. Chung et al. (2011) found no effect when using 2 different strains of active dried yeast on nonlactating dairy cows on BW and DMI (1 × 10¹⁰ cfu, Levucell and strain 2, Lallemand Animal Nutrition, Montreal, QC, Canada). Furthermore, those authors found contrasting results on the effect that live yeast had on rumen pH, as one of the strains reduced rumen pH compared with the control group, and the other strain was no different in the rumen pH level compared with the control group. It is thought that the variable response to live yeast supplementation is a result of external factors such as diet or physiological stage. More often than not, studies have focused on the effect of live yeast supplementation under experimental conditions, such as the induction of SARA (AlZahal et al., 2014; Malekkhahi et al., 2016), or adverse environments, such as environmental stress (high temperatures; Salvati et al., 2015), changes in diet (from indoor feeding to out grazing; Al Ibrahim et al., 2012), or physiological challenges transition period or early lactation (Kung et al., 1997; Cakiroglu et al., 2010; Al Ibrahim et al., 2013). Furthermore, it is very Journal of Dairy Science Vol. 100 No. 7, 2017
seldom that studies have looked at the effect of live yeast supplementation using noncannulated animals, or under standard commercial farm conditions. This is often because obtaining reliable data on performance and physiological parameters can only be obtained from experimental facilities at higher education institutions or research environments. With the advent of new technologies and automated systems, the recording of parameters such as rumination time and rumen pH under commercial farm environments (Rutten et al., 2013) without altering the experimental animals is possible; hence, the evaluation of the effect of live yeast supplementation in vivo can be carried out. Therefore, the aims of the present study were to evaluate the effects that live yeast supplementation might have on performance, rumination time, and rumen pH on dairy cows under commercial farm environments, specifically a standard commercial diet, an acidotic challenge, and outside grazing grass. MATERIALS AND METHODS Animals, Feeding and Treatments
Three trials were conducted at the University of Edinburgh at Langhill Farm, Roslin, Midlothian, Scotland, United Kingdom, during 2012 and 2013. The farm has a 240-cow Holstein milking herd. All procedures related to animals were approved by the Veterinary Ethical Review Committee of the Royal (Dick) School of Veterinary Studies of the University of Edinburgh (References: Trial 1 VERC 2011–88, Trial 2 VERC 30/12, and Trial 3 VERC 11/13). Individual Holstein cows were unique to each trial, and cows were divided into 2 groups to facilitate management routines (e.g., milking and feeding) and to ensure similar parities and DIM between groups of cows in all 3 trials. Each group of animals was housed in contiguous pens that shared identical characteristics, such as area of feed and water troughs and cubicle or stalls with rubber mattress top-dressed with sawdust 3 times a week. Water was supplied ad libitum. Cows were milked in a 14/14 herringbone milking parlor (DeLaval, Tumba, Sweden) approximately at 0500 and 1500 h. During milking, cows received a minimum of 0.8 kg and a maximum of 6 kg of concentrate/d per cow, split into 2 equal feeds given at each milking. All of the individual cows were clearly identified with a unique number or letter by color spray (Arco Limited, Hull, UK) on both sides of the thorax or neck so they were easily viewed and recognized, and the identification was randomly allocated to each animal. Cows were given a minimum of 2 wk to adapt to the diet, facili-
3
M G + PMR G + PMR + Y 4.0 M
M PMR + AcCh PMR + AcCh
NA NA PMR PMR
W2
Trial 1 Trial 2 Trial 3
Control Treatment Group 1 Group 2 Group 1 Group 2
PMR PMR
M PMR + AcCh PMR + AcCh M PMR PMR M
NA PMR PMR + Y 0.8 NA M PMR + AcCh + Y4.0 PMR + AcCh M G + PMR G + PMR M
NA PMR PMR + Y 4.0 NA M PMR + AcCh PMR + AcCh + Y 4.0 M G + PMR + Y 4.0 G + PMR M
W1 W4 W3 W2 W1 W4 W3 W2 W1 W3 W2 W1 Group Trial
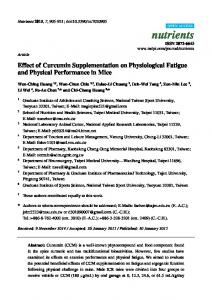
P = period; W = week; PMR = partial mixed ration; Y = yeast; NA = not applicable; M = measurements. Trial 1: Y 0.8 = 0.8 g of yeast/cow per day (10 billion cfu/cow per day), Y 4.0 = 4.0 g of yeast/cow per day (60 billion cfu/cow per day). Trial 2: AcCh = acidogenic challenge = 1.5 kg of wheat/cow per day. Trial 3: G = grazing.
M G + PMR G + PMR
NA NA
NA NA
W3 W3
W4
W1
W2
P5 P4 P3 P2 P1
Table 1. Timeline and experimental design used in trials 1, 2 and 31
1
W4
YEAST AND RUMEN pH, RUMINATION TIME, AND PERFORMANCE
ties, and the rumination collars. All measurements were taken in the third or fourth week after any change in diet (Table 1). After fresh partial mixed ration (PMR) was delivered (once a day at approximately 0700 h), the corresponding live yeast treatment dose was administered daily to each cow in the corresponding group by topdressing and manually mixing the yeast into the upper part of the PMR. Cows were locked in the feed trough for 15 min using the self-locking neck yoke mechanism to ensure the cows ate all of the yeast supplemented. Trial 1. Fourteen multiparous milking cows were selected and balanced for DIM (104 ± 12 d; mean ± SEM) and parity (median lactation number = 4). The cows were then randomly allocated to 2 different groups, control (Cx; DIM = 103 ± 5.0, median lactation number = 5) and treatment (Tx; DIM = 105 ± 4.6, median lactation number = 4), with 7 cows in each group. At the end of the trial all of the cows were pregnant. Cows were offered a PMR (Table 2) with additional concentrate (concentrate composition = wheat 10%, barley 20%, distillers grains wheat 23%, US corn distillers grain 5%, maize 5%, Soya Hipro 3% (KW Scotland, Ayr, Scotland, UK), palm kernel 15%, cereal mix 3%, molasses 7%, limestone 1%, calcined magnesite 1%, and ruminant premix 7%) fed to yield in the milking parlor. Table 2. Ingredient and chemical composition of the experimental partial mixed rations Diet Composition Ingredient (% of DM) Grass silage, 1st cut Grass silage, 2nd cut Whole-crop wheat silage Dairy meal1 Water Maize crimped Molasses Wheat (ground) Calcined magnesite Grazing Chemical composition DM (%) CP (% DM) NDF (% DM) uNDF forage [% DM (kg total)] uNDF total [% DM (kg total)] Oil (% DM) Sugar (% DM) Starch (% DM) Quick carbohydrates (% DM) Slow carbohydrates (% DM)
Trial 1
Trial 2
Trial 3
47.06 0 18.82 14.12 9.41 7.06 3.53 0 0 0 56.0 16.7 35.0 6.9 11.3 3.9 9.6 14.3 19.9 38.3
43.60 15.17 17.06 18.01 0 0 3.32 2.84 0 0 40.6 16.7 35 6.5 10.3 3.1 7.1 19.8 15.6 42.2
30.07 0 7.80 10.58 0 0 1.39 0 0.06 50.11 31.1 15.8 41 12.7 14.8 3.4 5.6 10.2 17.1 41.5
1
Dairy meal = wheat 12.55%, US corn distillers grain 15.02%, rapeseed extract 15.01%, soya hulls 15.00%, Soya Hipro (KW Scotland, Ayr, Scotland, UK) = 30%, beet pulp 8.00%, Megalac (Volac International Limited, Royston, England, UK) 2.00%, mineral premix 0.20%, vitamin E 0.13%, limestone 2.00% and calcined magnesite 0.08%. Journal of Dairy Science Vol. 100 No. 7, 2017
4
AMBRIZ-VILCHIS ET AL.
The trial ran from January until May 2012 and consisted of 4 periods (P1, P2, P3, and P4). Baseline measurements were taken in P1, P2, and P3 (treatment) and washout measurements were taken in P4 (Table 1). Each period lasted for 3 wk. For each period, cows had 2 wk to adapt to the diet and facilities, and all measurements were taken in the third week. The Cx group received no yeast supplementation throughout the trial. The Tx group received yeast supplementation at 2 levels. In P2, the Tx group received yeast supplementation at 0.8 g/cow per day (1 × 10¹⁰ cfu/cow per day) of yeast (Vistacell, AB Vista, Marlborough, UK) and 4.0 g/cow per day (6 × 10¹⁰ cfu/cow per day) of yeast were added in P3. The manufacturer’s specification for storage, handling, and supplementation of the yeast was adhered to, and no laboratory verification was performed to assess the viability of live yeast in the product. No yeast was added during P1 and P4 (Table 1). Trial 2. Fourteen multiparous milking cows were selected and balanced for DIM (97 ± 4.3 d) and parity (median lactation number = 3). The cows were then randomly allocated to 2 different groups, group 1 (G1; DIM 96 ± 2.7 and median lactation number = 3) and group 2 (G2; DIM 99 ± 9.2 and median lactation number = 4), with 7 cows in each group. At the end of the trial all of the cows were pregnant. Cows were offered a PMR (Table 2), with additional concentrate fed to yield in the milking parlor. In addition, the cows were supplemented with 1.5 kg of ground wheat per cow per day. After fresh PMR was delivered, the wheat was added to it and mixed until homogeneity was obtained, the cows were then locked in the feed trough for at least 15 min using the self-locking neck yoke mechanism to ensure the cows ate the supplemented wheat. The trial was conducted from January to May 2013 and was split into 4 periods (P1, P2, P3, and P4). Baseline measurements were recorded in P1, P2 and P3 (treatment) and washout measurements were taken in P4 (Table 1). In P1, the cows had 2 wk to adapt to the facilities and diets, and all measurements were taken in wk 3. For each of the remaining periods (P2, P3, and P4) cows had 3 wk to adapt to the diet and facilities, and all measurements were taken in the fourth week. In P2 and P3, yeast supplementation at 4.0 g/cow per day (6 × 10¹⁰ cfu/cow per day) followed a crossover experimental design. The manufacturer’s specification for storage, handling, and supplementation of the yeast was adhered to, and no laboratory verification was performed to assess the viability of the live yeast product. Trial 3. Fourteen multiparous milking cows were selected and balanced for DIM (139 ± 4.5 d) and parity (median lactation number = 4). The cows were then Journal of Dairy Science Vol. 100 No. 7, 2017
randomly allocated to 2 different groups, group 1 (G1; DIM 140 ± 6.3, median lactation number = 4)) and group 2 (G2; DIM 137 ± 6.8, median lactation number = 4), with 7 cows in each group. At the end of the trial all of the cows were pregnant. Cows were grazing a ryegrass (Lolium perenne) sward during the day and night. In addition, when the cows came in for milking in the afternoon, they were offered a buffer PMR ration (Table 2). Additional concentrate was fed to yield in the milking parlor. The trial ran from May until September 2013 and was split into 5 periods (P1, P2, P3, P4, and P5). Baseline measurements were taken in P1 (inside), P2 (grazing), and P3 and P4 (treatment), and washout measurements were recorded in P5 (Table 1). Period 1 and P2 lasted 3 wk, cows were given 2 wk to adapt to the facilities and diets, and measurements were recorded on the third week. Periods 3 to 5 lasted 4 wk, with 3 wk of adaptation and 1 wk of measurements. In P3 and P4, yeast supplementation at 4.0 g/cow per day (6 × 10¹⁰ cfu/cow per day) was carried out following a crossover design. The manufacturer’s specification for storage, handling, and supplementation of the yeast was adhered to, and no laboratory verification was performed to assess the viability of the live yeast product. Data Collection
Milk Production and Composition. Milk yield was recorded daily throughout the entire duration of the trials, and downloaded once a week directly from the milking parlor using the automatic milk recording feature in the Alpro 5 computer program (DeLaval). During the measurement week of each period (on Monday, Wednesday, and Friday), composite milk samples (from consecutive morning and afternoon milking) were collected and analyzed for chemical characteristics (protein, butterfat and lactose) by the Cattle Information Service (Telford, UK). BW and BCS. Once during the measurement week of each period, cow BW and BCS were recorded. Body weight was recorded using an electronic weigh scale. Body condition score was measured on a standard 1 to 5 scale (Lowman et al., 1976) by a single trained operator. Feed Sampling and Analysis. Forage samples were taken every week and were analyzed at Bioparametrics Ltd. (Edinburgh, Scotland, UK) laboratory. Basic components of the feedstuffs, DM, ash, oil, sugar, starch, NDF, and protein, were obtained by methods of AOAC International (2012). Further analyses, which are unique to Bioparametrics Ltd. feedstuff analyses, included degradation parameters of the carbohydrates and protein performed by in vitro gas production tech-
YEAST AND RUMEN pH, RUMINATION TIME, AND PERFORMANCE
nique (Menke and Steingass H., 1988), with modification for protein and carbohydrates (Jessop and Herrero, 1996; Palmer, 2006). The results of these analyses provide information on the degradation parameters of the carbohydrates, sugar, quickly and slowly degradable starch, fermentable NDF, and protein fractions of the feedstuffs. Rumination Time. In all trials, a rumination collar (RC; Qwes-HR Lely Ltd., St Neots, UK) was fitted to each cow to record rumination. A tag reader was located at the exit of the milking parlor so data from the RC was downloaded and stored at least twice a day, after each milking. The output presents rumination in minutes per day. The RC has been described elsewhere (Bar and Solomon, 2010) and has been validated for use in loose-housed dairy cows in commercial environments with acceptable results (Ambriz-Vilchis et al., 2015). However, due to the poor results obtained in grazing animals (Ambriz-Vilchis et al., 2015), the data obtained from the RC in trial 3 was discarded. Rumen pH. To record rumen pH, cows were orally administered a commercially available rumen pH bolus [eCow Ltd., Devon, England, UK (trial 1), or WellCow Ltd., Roslin, Scotland, UK (trials 2 and 3)]. In all trials a bolus was administered to each cow using a bolus gun before the start of the first measurement week on P1. Prior to deployment the boluses were calibrated against known standard pH solutions (pH 4 and 7; trial 1: Osmotics, Aylsham, England, UK, and trials 2 and 3: buffer solutions were provided by WellCow Ltd.). The boluses were set to record rumen pH at 15-min intervals for the entire lifespan of the bolus’s battery (up to 4 mo). The recorded data were downloaded to a personal computer for storage, collation, and further analyses. Calculations and Statistical Analysis
Milk Production and Composition. Data on milk yield and characteristics was collated and summarized for the measurement week resulting in a data set for analyses of 7 measurements for milk yield (one per day), and 3 measurements for milk characteristics (Monday, Wednesday, and Friday). BW and BCS. Data on BW and BCS was collated and summarized for the measurement week in each period, resulting in 1 measurement. Data on BCS was analyzed using Kruskal-Wallis one way ANOVA. Rumination Time. Data obtained with the RC was collated to present rumination time in minutes per day, resulting in a data set for analyses of 7 measurements for rumination time (1 per day) during the measurement week in each period.
5
Rumen pH. The rumen boluses were set to record pH every 15 min, which resulted in 96 time points per day. Daily pH records were examined on an individual cow basis, and only days that had 96 time points were used to construct the pH database. From this data set, rumen pH was analyzed as mean rumen pH. To try to account for the dynamics of rumen pH, the time (min/d) rumen pH was below 6.2 or 5.8 pH thresholds were obtained. These rumen pH cutoff points were selected as indicators of SARA and were considered due to research evidence showing their detrimental effects on cellulolytic bacteria and fiber digestibility (pH