'Dr. John D. Brunzell served as Guest Editor for this paper. *To whom ..... for excellent technical assistance, and Dr. Jim Stray-Gundersen for his support of this ...
Genetic analysis of a polymorphism in the human apolipoprotein A4 gene promoter: effect on plasma HDL-cholesterol levels’ D. Edward Barre,* Rudy Guerra,t Richard Verstraete,** Zifen Wang,* Scott M. Grundy,* and Jonathan C. Cohen2,*,** Center for Human Nutrition,’ UT Southwestern Medical Center, 5323 Harry Hines Boulevard, Dallas, TX 75235-9052; Department of Statistical Science,t Southern Methodist University, Dallas, TX 75275-0332; and Baylor/UT Southwestern Sports Science Research Center,’* 411 N. Washington, Suite 3000, Dallas, TX 75246
-
Supplementary key words high density lipoproteins apolipoprotein A-I gene DNA polymorphism polymerase chain reaction
Familial aggregation of plasma high density lipoprotein cholesterol levels (HDL-C) has been reported in several studies (see ref. 1 for review). A component of the familial resemblance in HDL-C levels can be attributed to shared environment, but the major fraction appears to be geneti-
1292
Journal of Lipid Research Volume 35, 1994
cally determined (2). Heritability estimates derived from twin and family data have indicated that genetic factors probably account for 40-60% of the inter-individual variation in plasma levels of HDL-C (3), but the specific genes involved have not been identified. Candidate genes that potentially contribute to interindividual variation in plasma HDL-C levels have been examined by comparing the HDL-C levels of unrelated individuals with different alleles of the gene under consideration (4). In most cases, alleles have been defined by restriction fragment length polymorphisms. Since most of these polymorphisms are in non-coding regions, an association between a candidate locus and plasma HDL-C levels is usually assumed to indicate linkage disequilibrium between the marker locus and another, unidentified, polymorphic sequence that actually confers phenotypic variation. Perhaps the most consistent association identified by these methods is that between apolipoprotein A-I (apoA-I) alleles bearing an adenine (A) at position -76, and high plasma levels of HDL-C. Five studies (5-9) have reported that individuals with the A allele, which occurs at a frequency of about .18 in Caucasian populations, have higher levels of HDL-C or apoA-I than do individuals homozygous for alleles bearing guanine (G) at - 76, the common allele in these populations. The magnitude and the gender distribution of the increase in plasma HDL-C levels associated with the A allele has differed among these studies. Jeenah et al. (5) reported that, in a sample of healthy English men, plasma apoA-I and HDL and HDL2 cholesterol levels were
Abbreviations: HDL-C, high density lipoprotein cholesterol; PCR, polymerase chain reaction. ‘Dr. John D. Brunzell served as Guest Editor for this paper. *To whom correspondence should be addressed.
Downloaded from www.jlr.org by guest, on June 1, 2013
Abstract Previous studies have indicated that a G to A substitution at position - 76 in the gene encoding apolipoprotein A-I (apoA-I) confers increased plasma high density lipoprotein cholesterol (HDL-C). Increased HDL-C may be a direct consequence of the A allele, or may reflect the action of a locus in linkage disequilibrium with the A allele. To elucidate this question, we examined the effect of this polymorphism in a large sample (n = 409) of unrelated Caucasians and their nuclear families (n = 22). To eliminate the confounding effects of hypertriglyceridemia, individuals with triglyceride levels greater than 150 mg/dl were excluded from the study. ApoA-I genotype was determined by polymerase chain reaction (PCR) amplification of genomic DNA and restriction digestion with Msp I. Individuals were grouped by genotype (GG, GA or AA) and mean adjusted H D L levels of the three groups were compared by oneway analysis of variance. Our analysis indicates that HDL-C levels do not vary by genotype, and no gene dosage effect is apparent in men or in women. Analysis of 22 informative Caucasian nuclear families showed no significant difference between individuals with the A allele and their G G siblings. These data suggest that polymorphism at - 76 in the apoA-I gene does not directly affect H D L levels. Therefore, the increased HDL-C levels reported in other populations must reflect linkage disequilibrium between the A allele and a putative HDL-raising allele. As we find no evidence for association between the A allele and high H D L levels, this putative allele must occur at a low frequency in the population sampled in this study -Barre, D. E., R. Guerra, R. Verstraete, Z . Wang, S. M. Grundy, and J. C. Cohen. Genetic analysis of a polymorphism in the human apolipoprotein A-I gene promoter: effect on plasma HDLcholesterol levels. J. Lipid Res. 1994. 35: 1292-1296.
those of their siblings who were homozygous for the G allele.
METHODS Subjects
Blood samples were obtained from fasting, nonHispanic whites living within 50 miles of the Dallas metropolitan area. Where possible, the nuclear families of these subjects were also ascertained. Blood lipid analysis was performed, and individuals with triglyceride levels greater than 150 mg/dl were excluded from the analysis. Laboratory procedures
Plasma triglyceride, cholesterol, and HDL-C levels were determined enzymatically, as described previously (13). Genomic DNA was isolated using the procedure described by Lahieri and Nurnberger (14). The region of the apoA-I gene containing the G/A polymorphism was amplified by PCR. Each PCR reaction contained 15 pmol of each primer, 100 p~ dNTP, 3.3 pmol 32FdCTP (3000 mCi/ mmol), 100 ng genomic DNA, and 0.25 U Taq polymerase in the buffer provided by the manufacturer. Amplifications were performed in 10 pl volumes. The PCR mixtures were overlaid with mineral oil and subjected to 30 cycles of denaturing at 94OC for 30 sec and annealing and extension at 68OC for 2 min in a thermocycler. The sample volume was then increased to 40 p1 by addition of a restriction enzyme, Msp I, in the buffer recommended by the manufacturer, incubated twice for 2 h at 37OC, and subjected to electrophoresis on polyacrylamide gels. Statistical methods
The observed HDL-C values were adjusted for the effects of age and sex using a procedure similar to that described by Sokal and Rohlf (15). The adjusted value for an observation y is yadj = 7 + (y - p ) , where p is the expected value of an individual of the observation's age and sex, and 7 is the sample average of the y values. The expected values were obtained from sex and age specific HDL-C tables reported by Heiss et al. (16). Within each sex-age specific class, the mean and standard deviation of our sample was similar to that of Heiss et al. (16). For the sample of unrelated individuals, a one-way analysis of variance (17) was performed on the deviations y - p to test the null hypothesis that phenotypic variation is unaffected by the marker genotype polymorphism. Separate analyses for men and women were conducted. For the sample of nuclear families, a generalization of a comparison based on paired data was performed. Comparison of phenotypes within families accounts for genetic correlations and thereby removes biases that might otherwise be incurred. The adjusted HDL-C levels were ranked within families and the ranking scores were analyzed
Barre et al.
DNA polymorphism and HDL levels
1293
Downloaded from www.jlr.org by guest, on June 1, 2013
significantly higher in those individuals with the A allele than in those homozygous for the G allele. Pagani et al. (6) found that the A allele was over-represented in Italian women in the highest decile of HDL-C levels, but not in Italian men in the corresponding decile. These authors concluded that the A allele was associated with high HDL-C levels in women, but not in men. Paul-Hayase et al. (7) reported that plasma apoA-I levels were higher in Belgian men and boys (aged 7-23 years) with the A allele than in those homozygous for the G allele, although the magnitude of the difference reported by these authors (5 mg/dl) was much lower than that reported by Jeenah et al. (23 mg/dl). Siggurdsson et al. (8) reported that Icelandic male nonsmokers with the A allele had significantly higher HDL-C and apoA-I levels than did male nonsmokers homozygous for the G allele. In this study (8), the A allele had no effect on male smokers, or on women. Xu et al. (9) found no effect of the A allele on plasma HDL-C levels of Italian boys and girls aged between 8 and 11 years. ApoA-I levels were higher in boys, but not in girls with the A allele. The reasons for these discrepancies are not known. It is also not clear whether the putative effect of the polymorphism on H D L levels is due to the G to A substitution per se, or to linkage disequilibrium between the A locus and a distinct as yet unidentified effector locus. In vitro analysis of the effects of this polymorphism on transcription has yielded conflicting results. Smith, Brinton, and Breslow (10) reported that substitution of an A for G at position - 76 in the apoA-I promoter decreased in vitro transcription by about 30%. This finding was consistent with in vivo turnover studies that showed decreased apoA-I synthetic rates in individuals with the A allele, although plasma H D L levels did not differ between GG and GA individuals, Tuteja et al. (11) reported that substitution of A for G decreased transcription about 2-fold in a promoter construct spanning the region -330 to +1, but had no effect in a construct spanning the region -1469 to +397. Jeenah and Wells (12) reported that substitution of A for G increased transcription about 4-fold in a 350-bp fragment spanning the region from -256 to +loo. The present study was undertaken to elucidate the effects of the G to A substitution. We reasoned that if the A substitution at position -76 confers higher HDL-C levels, then a gene dosage effect should be evident. Homozygotes for the A allele should, on average, have higher HDL-C levels than GA heterozygotes, who should in turn have higher HDL-C levels than GG homozygotes. As the A allele is relatively infrequent, we studied a large sample of normolipidemic individuals in order to include a representative number of AA homozygotes. To reduce the possible confounding effects of genetic heterogeneity at other loci that affect HDL-C levels, we also compared the HDL-C levels of individuals bearing the A allele with
across families. Due to the paucity of A homozygote individuals, the AA individuals were combined with the AG individuals to form one class, A + genotypes. We thus compared HDL-C levels from AA and AG genotypes within families. Let Si1 al
GG
.4A
P
45c
I3 n
0.84
0.7 14.02
-2 3 7.03
al
Journal of Lipid Research
Volume 3 5 , 1994
4035
0.77
“P-value associated with analysis of variance F-ratio. ’From sample of unrelated individuals. ‘Y - p denotes observed HDL value minus expected value conditional on age and sex.
1294
a a
2
8
43 8
50-
J
n
I
10
46.8
3
1 AA
AG Marker Genotype
GG
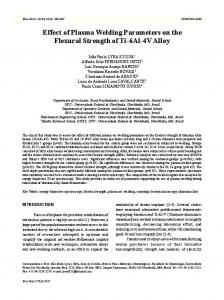
Fig. 2. Distributions of HDL-C levels for the marker genotypes AA ( n = 8), AG (n = 661, and GG (n = 130) in a sample of 204 unrelated Caucasian males. Median values are indicated by the white bars within the boxes; the upper and lower quartiles are indicated by the top and bottom of the boxes, respectively.
sibships included six children. The sample of informative nuclear families included few A homozygotes, therefore we combined the AA and AG individuals into one class, A + . T h e within-family comparisons rank G homozygotes with respect to the A+ genotypes. Comparing all sibs within families resulted in a P-value of 0.19 and thus we failed to reject the null hypothesis assuming equality of A+ and GG phenotypic means (CY = 0.05). T h e investigation comparing same sex sibs reduced the number of informative families to 12 and 10 for the female a n d male analyses, respectively. T h e sibships that did qualify for the analysis typically were of size 3. In neither case, male or female, did we reject (a = 0.05) the null hypothesis: male P-value = 0.39, female P-value = 0.15.
DISCUSSION
We thank Kathy Schutt, Kevin Robinzine, and Anika Hochstein for excellent technical assistance, and Dr. Jim Stray-Gundersen for his support of this work. This work was supported by NIH grants HL-29252 and Mol-RR-00633, the Southwestern Medical Foundation, The Moss Heart Foundation of Dallas TX, and an unrestricted grant from Bristol-Myers-Squibb. Manuscript received 13 December 1993 and in revisedfonn I1 February 1994.
REFERENCES 1. Breslow, J. L. 1989. Familial disorders of high density lipoproteins. In The Metabolic Basis of Inherited Disease. 6th ed. C. R. Scriver, A. L. Beaudet, W. S. Sly, and D. Valle, editors. McGraw-Hill Book Co., New York. 1251-1264. 2. Namboodiri, K. K., P. P. Green, E. B. Kaplan, H. A. Tyroler, J. A. Morrison, G. A. Chase, R. C. Elston, B. M. Rifkind, and C. J. Glueck. 1983. Family aggregation of high density lipoprotein cholesterol. Arteriosclerosis. 3: 616-626. 3. Heller, P. A,, U. De Faire, N. Pederson, G. Dahlen, and G. E. McClearn. 1993. Genetic and environmental influences on serum lipid levels in twins. N. Engl. J Med. 328: 1150-1156. 4. Humphries, S. E. 1988. DNA polymorphusms of the apolipoproteins - their use in the investigation of the genetic component of hyperlipidemia and atherosclerosis. Atherosclerosis. 72: 89-108. 5. Jeenah, M., A. Kessling, N. Miller, and S. Humphries. 1990. G to A substitution in the promoter region of the apolipoprotein A-I gene is associated with elevated serum apolipoprotein A-I and high density lipoprotein cholesterol concentrations. Mol. Biol. Med. 7 : 233-241. 6. Pagani, F., A. Sidoli, G. A. Giudici, L. Barenghi, C. Vergani, and E E. Baralle. 1990. Human apolipoprotein A-I gene promoter polymorphism: association with hyperalphalipoproteinemia. J . Lipid Res. 31: 1371-1377. 7 Paul-Hayase, E, M. Rossenneu, D. Robinson, J. Van Bervliet, J. P. Deslypere, and S. E. Humphries. 1992. Polymorphisms in the apolipoprotein (apo) A-I-C-111-A-IV gene cluster: detection of genetic variation determining plasma apoA-I, apoC-111 and apoA-IV concentrations. Hum. Genet. 88: 439-446. 8 Sigurdsson, G., V. Gudnason, G. Sigurdsson, and S. E. Humphries. 1992. Interaction between a polymorphism of the apoA-I promoter region and smoking determines plasma levels of HDL and apoA-I. Arterioscler. Thromb. 12: 1017-1022. 9 Xu, C-F., F. Angelico, M. Del Ben, and S. E. Humphries. 1993. Role of genetic variation at the apoA-I-C-111-A-IV gene cluster in determining plasma apoA-I levels in boys and girls. Genet. Epidermiol. 10: 113-122. 10. Smith, J. D., E. A. Brinton, and J. L. Breslow. 1992. Polymorphism in the human apolipoprotein A-I gene promoter region. Association of the minor allele with decreased production rate in vivo and promoter activity in vitro. J. Clin. Invest. 89: 1796-1800. 11. Tuteja, R.,N. Tuteja, C. Melo, G. Casari, and F. Baralle.
Burre et ul.
DNA polymorphism and HDL lwels
1295
Downloaded from www.jlr.org by guest, on June 1, 2013
I n this study we have examined the influence of a G to A substitution in the 5' flanking region of the apoA-I gene on plasma levels of HDL-C. Previous studies (5-9) have reported that the A allele is associated with higher HDL levels than the G allele, but the magnitude a n d gender specificity of the effects have not been consistent. O u r study design differed significantly from that used by previous investigators in that we exploited the effects of gene dosage a n d segregation. First, to maximize the possibility of detecting variation in HDL levels that may be associated with this polymorphism, we compared the HDL-C levels of individuals homozygous for the A allele with those of individuals homozygous for the G allele. O u r analysis indicated that HDL-C levels did not vary by genotype, and n o gene dosage effect was apparent in men or in women. Second, to evaluate the possibility that the slight difference in HDL-C levels between GA heterozygotes a n d GG homozygotes reflects a systematic effect of the A allele, a n d that this effect is obscured by random variation in HDL-C levels due to genetic polymorphism at other loci, we compared the HDL-C levels of GA heterozygotes with those of their siblings who were homozygous for the G allele. O n average, siblings share 50% of their genetic material identical by descent, therefore this comparison should significantly reduce variation due to polymorphism at other genetic loci. Analysis of 22 informative sibships revealed n o effect of the A allele on HDL-C levels, a result consistent with our finding in unrelated individuals. These findings indicate that the G to A substitution at - 76 in the apoA-I gene does not, per se, confer higher HDL-C levels. Accordingly, the association between the A allele and increased HDL levels observed in other populations (5-9) must reflect linkage disequilibrium between the A allele a n d a locus that raises HDL-C levels. Since we find n o evidence for association
between the A allele a n d high HDL-C levels, this putative HDL-raising locus must occur at a low frequency in the population sampled in this study. I
12. 13.
14. 15.
1992. Transcription efficiency of human apolipoprotein A-I promoter varies with naturally occurring A to G transition. FEBS Lett. 304: 98-101. Jeenah, M. S., and C. Wells. 1992. Functional significance of a point mutation in the apoA-I promoter. Circulation. (Supp1)86: 1-279 (abs). Cohen, J. C., and S. M. Grundy. 1992. Normal postprandial lipemia in men with low plasma HDL concentrations. Arterioscla Thromb. 12: 972-975. Lahiri, D. K., and J. I. Nurnberger. 1991. A rapid nonenzymatic method for the preparation of H M W DNA from blood for RFLP studies. Nucleic Acids Res. 19: 5444. Sokal, R. R., and F. J. Rohlf. 1969. Biometry. W. H.
Freeman and Company, San Francisco. 16. Heiss, G., N. J. Johnson, S. Reiland, C. E. Davis, and H. A. Tyroler. 1980. The epidemiology of plasma high density lipoprotein cholesterol levels. The Lipid Research Clinics Program Prevalence Study. Summary. Circulation. Suppl. 4: 116-136. 17. Scheffe, H. 1959. The Analysis of Variance. John Wiley & Sons, Inc., New York. 18. Lehmann, E. L. 1975. Nonparametrics: Statistical Methods Based on Ranks. Holden-Day, San Francisco. 19. StatXact. 1989. A Statistical Package for Exact Nonparametric Inference. Cytel Software Corporation, Cambridge, MA.
Downloaded from www.jlr.org by guest, on June 1, 2013
1296
Journal of Lipid Research
Volume 35, 1994