Effective and Scalable Authorship Attribution Using Function Words Ying Zhao
Justin Zobel
School of Computer Science and Information Technology, RMIT University GPO Box 2476V, Melbourne, Australia yizhao,
[email protected]
Abstract. Techniques for identifying the author of an unattributed document can be applied to problems in information analysis and in academic scholarship. A range of methods have been proposed in the research literature, using a variety of features and machine learning approaches, but the methods have been tested on very different data and the results cannot be compared. It is not even clear whether the differences in performance are due to feature selection or other variables. In this paper we examine the use of a large publicly available collection of newswire articles as a benchmark for comparing authorship attribution methods. To demonstrate the value of having a benchmark, we experimentally compare several recent feature-based techniques for authorship attribution, and test how well these methods perform as the volume of data is increased. We show that the benchmark is able to clearly distinguish between different approaches, and that the scalability of the best methods based on using function words features is acceptable, with only moderate decline as the difficulty of the problem is increased.
1
Introduction
Authorship attribution is the task of deciding who wrote a document. In a typical scenario, a set of documents with known authorship are used for training; the problem is then to identify which of these authors wrote unattributed documents. Such attribution can be used in a broad range of applications. In plagiarism detection, it can be used to establish whether claimed authorship is valid. Academics use attribution to analyse anonymous or disputed documents such as the plays of Shakespeare1 or the Federalist Papers [12, 20]. Authorship attribution can also be used for forensic investigations. For example, it could be applied to verify the authorship of e-mails and newsgroup messages, or to identify the source of a piece of intelligence. A variety of methods for attribution have been proposed. There are three main approaches: lexical methods [2, 10, 16, 18], syntactic or grammatic methods [3, 25, 26], and language-model methods [19, 22], including methods based on compression [5, 20]. These approaches vary in evidence or features extracted from documents, and in classification methods applied to the evidence. 1
See for example shakespeareauthorship.com.
However, use of different data sets and measures — and lack of comparison to common baselines — means that these results cannot be compared. In most of the papers cited above, the attribution methods appear to succeed on the terms set by the authors, but there is no way of identifying which is the most successful. Inconsistencies in the underlying choices also lead to confusion; for example, no two papers use the same sets of extracted features. Nor is there any indication of how well the methods scale. Most of the data sets used are small, and change in performance as documents are added is not examined. Our aim in this research is to investigate whether a standard benchmark can be used to evaluate the relative performance of different attribution methods. We develop a benchmark by using part of a newswire collection provided in the TREC data [14]. Many of the newswire articles have the author identified in their metadata; although the formatting of the authorship is inconsistent, it can readily be standardized [11]. Such data might be regarded as relatively challenging for the task of attribution, as articles with different authors may be edited towards a corporate standard and an author may use different styles for different kinds of article; for example, some authors write both features and reviews. However, our experiments show that all the methods we consider are at least moderately successful when applied to small volumes of data, and that the use of a benchmark allows differences in performance to be clearly identified. To establish which attribution method is in practice the most effective — and to further demonstrate the value of a benchmark — we examine how well each of the methods scales. Scaling has many aspects: increase in the volume of positive training data, in the number of authors, and in the volume of negative training data. This last two cases are of particular interest in a domain such as newswire, where the number of documents and authors is large. Many of the approaches to authorship attribution described in recent research literature are lexical, based on measures of distributions of word usage [2, 8, 10, 16, 18]. While other approaches are also of interest, the similarities in the principles of the lexical methods makes it interesting to discover which is most effective. We examine several attribution methods in our experiments, all based on standard approaches to text classification: na¨ıve Bayesian, Bayesian networks, nearest-neighbour, and decision trees. The two Bayesian approaches are based on probabilities. The nearest-neighbour methods use vector differences. Decision trees are based on classifying training data by their distinguishing features. All of these techniques have been successfully used for classification in areas such as speech recognition, content-based text categorization, and language processing. As features, we use occurrence counts of function words such as “the” and “once”. Using sets of documents with varying number of authors (from two to five) and varying quantities of positive and negative training data, we find clear differences between the methods. In most of the experiments, the Bayesian networks were clearly the most effective, while the nearest-neighbour methods were best when given limited positive examples and attempting to distinguish the work of an author from a heterogeneous collection of other articles. The best methods proved to be reasonably scalable as the number of documents was
increased, with for example an accuracy of around 50% when only 2% of the training documents were positive examples.
2
Background
The fundamental assumption of authorship attribution is that each author has habits in wording that make their writing unique. It is well known in the humanities, for example, that certain writers can be quickly identified by their writing style. The basis of a successful automatic attribution technique is, therefore, that it is possible to extract features from text that distinguish one author from another; and that some statistical or machine learning technique, given training data showing examples and counterexamples of an author’s work, should be able to use these features for reliable attribution. Authorship attribution problems can be divided into three categories: binary, multi-class, and one-class classification. Binary classification is when each of the documents being considered is known to have been written by one of two authors [7, 12, 16]. In multi-class classification, documents by more than two authors are provided. In one-class classification, some of the documents are by a particular author while the authorship of the other documents is unspecified, and the task is to determine whether given documents are by the single known author. In this paper, we study all three categories of classification. Choice of feature is a key issue. In a problem domain such as information retrieval, documents are identified by their content [4], and the features used are usually the words of the document. Likewise, authorship attribution is distinctly different to document classification [24], where the task is to group documents by content. In attribution, words can be misleading, as two authors writing on the same topic or about the same event may share many words and phrases. Although the principles are superficially similar — features are extracted and then used to assign documents to a class — style markers are much harder to define than are content markers. This difficulty is evident at the reader level: a human can easily identify the topic of a document, but identifying the author is much harder. There is no guarantee that a classification method that is successful on features that mark content will be successful on features that mark style. If words are to be used as features, it is therefore interesting to restrict attention to function words. These are words such as prepositions, conjunctions, or articles, or elements such as words describing quantities, that have little semantic content of their own and usually indicate a grammatical relationship or generic property. The appeal of function words is that they are a marker of writing style. Some less common function words — such as “whilst” or “notwithstanding” — are not widely used, and thus may be an indicator of authorship. Even common function words can be used to distinguish between authors. Table 1 gives an example of how usage of function words can vary. In this example from the AP data (discussed later), both authors use “and” and “of” with similar frequency, but Schweid’s usage of “that” is a third of Kendalls’s, and even the usage of “the” is very different.
Table 1. Usage statistics for common function words for two authors. Each number is, for that author, the percentage of function word occurrences that is the particular function word. Counts are averaged across a large set of documents by each author.
Barry Schweid Don Kendall
a and for in is of that the 6.28 9.22 4.94 6.50 1.62 14.66 1.89 29.13 9.75 7.08 2.36 7.98 3.05 13.16 5.73 41.29
The first research on attribution using function words was that of Burrows [8]. Function words are an appealing choice of feature because their incidence is often due to authorial style rather than the topic of a specific document. As presented by Baayen et al. [2], occurrence counts of 42 common function words and eight punctuation symbols were used to represent the authorial structures. Using principle component analysis and linear discriminant analysis, accuracy was 81.5%. The data was a collection of 72 student essays on three topics. On the same data, an accuracy of 87% is reported by Juola and Baayen [18]. They selected 164 function words of the highest frequencies and used cross-entropy. Holmes et al. [16] used 50 common function words to discriminate between two authors on disputed texts. These 17 texts were journal articles. They claim that the pattern of function word usage successfully discriminates between authors. Binongo [7] used the 50 most common function words to examine the authorship of the fifteenth book of Oz. Diederich et al. [10] obtained an accuracy of 60%–80% by employing all words and support vector machines, on German text by seven authors. The positive results imply that word usage can be used to address authorial issues, but the presence of content words means that these results are not reliable. However, these studies left many questions unresolved. First, the corpuses used are totally different from each other. They were in different languages, including Dutch [2, 18], English [7, 9, 16], and German [10]. (we use English texts only in our experiments.) Baayen et al. [2] use a proprietary data collection comprised of 72 articles by eight students, with nine articles from each student on three topics. Holmes et al. [16] chose seventeen journal articles for differentiating two authors on disputed texts. Diederich et al. [10] used the “Berliner Zeitung”, a daily Berlin newspaper; seven authors are considered and approximately 100 texts are examined for each author. In addition, none of this research is based on a large number of documents. The largest single-author collection is reported by Diederich [10], in which the number of documents per author is in the range 82–118. Nor are there any comparisons between methods. A wide range of other surface aspects of text could be used as features, such as word length or sentence length. Richer features are available through natural-language processing or more sophisticated statistical modelling. Some are based on natural language processing (NLP). Baayen et al. [3] argued that syntactic annotation is at least as effective as lexical-based measures. They used
two NLP tools to syntactically annotate a corpus. Then a set of rewrite rules are generated, which are considered as evidence for attribution. Using two novels each in ten segments they achieve perfect attribution Stamatatos et al. [25, 26] used an NLP tool to identify 22 style markers. On Greek news articles by 10 authors they achieve 81% accuracy, and improve to 87% by including 50 common words. These papers show that NLP is a plausible source of alternative features for attribution, to which a classification method must, as for other features, be applied. However, while these features are potentially more informative than the simple features we explore, they are also more error prone. Benedetto et al. [5] used a standard LZ77 compression program to measure the similarity among pieces of texts, reporting overall accuracy of 93%. In their approach, each unknown text is attached to every other known text and the compression program is applied to each composite file as well as to the original text. The author of the file with the least increase in size due to the unknown text is assumed to be the match. However, Goodman [13] failed to reproduce the accuracy of 93%, instead achieving only 53%. Moreover, the approach has other obvious flaws. Compression is based on modelling of character sequences, so there is a bias introduced by the subject of the text. Also, the method is not well designed. First, compression programs embody a range of ad hoc decisions and assumptions, and the simple bitcount due to additional text is likely to be much less informative than the models on which the program’s output is based. Second, the quadratic complexity of the approach means that it cannot be scaled to significant quantities of text. In this paper, we investigate the use of classification with function words as features, using consistent document collections and varying numbers of documents. We now review the classification methods we examine.
3
Classification
We use five classification techniques in our experiments, all of which have been reported as effective at attribution in recent literature. The first two are Bayesian classifiers, based on Bayes theorem [17, 21]. There are several variations of Bayesian classifiers. Among them, na¨ıve Bayesian and Bayesian network classifiers are reported as successful algorithms and have been successfully applied to document classification [24]. The next two, nearestneighbour and k-nearest-neighbour, are distance-based methods, which compute the distance from a new item to existing items that have been classified. The last technique is a decision tree. In detail, these classifiers are as follows. Na¨ıve Bayesian. This method is based on the assumption that the occurrences of the features are mutually independent. Under this assumption, given the set of features {a1 , . . . , an } extracted from a document and an author v, we wish to compute
P (v|a1 , . . . , an ) =
P (v) · P (a1 , . . . , an |v) P (a1 , . . . , an )
where P (a1 , . . . , an ) is assumed to be uniform and n is fixed. Thus we can attribute the document to be classified by computing P (a1 , . . . , an |v) = Πi P (ai |v) Using Bayes theorem, then, a na¨ıve Bayesian classifier can be written as: v = argmaxv∈V P (v) Πi P (ai |v) where P (v) can be estimated by measuring the frequency with which author v occurs in the training data. In our experiments, the frequencies of function words are used as the ai values, after normalizing by document length. However, it is difficult to estimate the probabilities P (ai |v) from a limited data collection, as many of the function words are rare and have insufficient occurrences in the training data. We used a common assumption to address this issue, that the value of attributes are Gaussian distributed. We calculate the mean µi and standard distribution σi of the ai values across the training data, giving the Gaussian estimate: P (ai |v) = g(ai , µi , σi ) where (a−µ)2 1 g(a, µ, σ) = √ e 2σ2 2πσ Note that the na¨ıve Bayesian approach assumes that the likelihood of a new document being by a given author is conditioned by the distribution of authorship of existing documents. It is not clear that this is an appropriate assumption. Bayesian networks. These are another method based on Bayes theorem. A Bayesian network structure [15] is an acyclic directed graph for estimating probabilistic relationships based on conditional probabilities. There is one node in the graph for each attribute and each node has a table of transition probabilities. There are two learning steps in Bayesian networks, learning of the network structure and learning the probability tables. The structure is determined by identifying which attributes have the strongest dependencies between them. The nodes, links, and probability distributions are the structure of the network, which describe the conditional dependencies. Every node ai has a posterior probability distribution derived from its parents. Attribution involves computation of the joint probability of attributes a1 , . . . , an taking dependencies into account: P (a1 , . . . , an ) = Πi P (ai |Parents (ai )) A Bayesian network is able to handle training data with missing attributes, for which a prediction value is given by the network structure and probabilities.
the
0.2 =0.1
a2
a2
a1
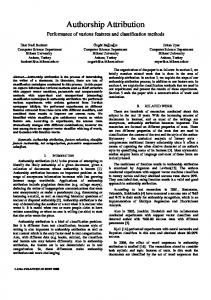
Fig. 1. A decision tree example showing classification using three function words.
Nearest-neighbour methods. These measure the distance between a new pattern and existing patterns. The class of the new pattern is determined by a majority vote of its metrically nearest neighbours. For example, if Jones is the author of 75% of the closest patterns then the new pattern is classified to be by Jones. The number of nearest neighbours is a parameter. The minimum, 1, gives a standard nearest-neighbour method, while use of k neighbours gives the knearest-neighbour method. In our experiments, we used k = 3. As discussed by Aha and Kibler [1], this kind of method makes no assumption about the probability distribution of the features, and so is suitable for data with complex boundaries between classes. In our experiments with attribution, the normalized occurrence rate of function words are used as features. The standard Euclidean distance is used as a measure distance, as derived from the p-norm distance: sX (|yi − xi |)p Dx,y = p i
Here xi and yi are the values of the ith attribute in documents x and y. The p-norm distance is appropriate due to its low computational cost and reported good effectiveness. Decision trees. These are a simple but successful inductive learning method. A binary tree is constructed to describe a set of attributes of a sample and return a “decision”, the authorial information in our case. A simple decision tree structure for a mark ranking system is shown in Figure 1. The leaf nodes are labelled as classes, while other nodes are specified by the attribute values. In the example, three attributes — “the”, “of”, and ”how”— and six conditions are provided in the tree. Given an unattributed document, with corresponding attribute values of 0.2, 0.25, and 0 respectively, by either a1 or a2 , we assign this document to author a2 by traversing the tree from root to leaf.
We selected the C4.5 decision tree algorithm [23] for our experiment. It is based on information theory. Following Shannon, the information content can be measured by: I (P (v1 ) · · · P (vn )) =
n X i=1
−P (vi ) log2 P (vi )
The information gain I measures the difference between the original information content and new information. Based on such a measurement, the feature with the largest information gain is selected as the root of the tree. The same process is applied recursively to generate the branches of the tree. When a new pattern is supplied, it is used to traverse the tree until a leaf is reached. The label of the leaf node is then the author of the given document [23]. As each attribute has only one node, paths are kept relatively short but only a limited subset of attributes is considered during attribution of a given document. Other methods. As discussed above, success has also been reported with support vector machines, principal component analysis, and linear discriminant analysis. We believe that these methods are indeed worth exploring. However, in this paper our primary focus is on finding ways to compare attribution methods; due to time constraints we chose to limit the number of methods we examine.
4
Experiments
We use experiments to examine which of the classification methods described above is the most effective in practice. As data, we use collections of data extracted from the TREC corpus [14]. The documents are newswire articles from the AP (Associated Press) subcollection. We believe that AP is a suitable benchmark data collection for attribution for several reasons. First, it is large, with many more documents and authors than the corpora in the literature noted above; it has over 200,000 documents by over 2380 distinct authors, as well as over 10 thousand anonymous documents. Second, the articles are on a wide range of topics, with some authors contributing diverse material while others are specialised. Third, the documents have been edited for publication, meaning that they are largely free of errors that might confound a categorizer. Fourth, many of the authors are regular contributors; seven authors contributed over 800 documents each. We used the documents by these seven authors in all the experiments described below, as well as, in our oneclass experiments, documents randomly selected from the remaining authors. In contrast, the largest number of documents by a particular author in collections used for attribution experiments in previous work is approximately 100 [10]. Thus the AP collection provides enough documents and enough authors for the investigation of the effects of scale. A drawback of the AP collection is that it is often the case that it contains multiple versions of the same document (because the same article may be published in slightly different forms in different places). Such repetition can distort
the statistics used to test for attribution, and can inflate the results; for example a nearest-neighbour approach will be all too successful if the test document is also present in the training data. However, detection of such near-duplicates is not straightforward. To remove these documents, we use the SPEX method of Bernstein and Zobel [6] to get rid of the near-duplicates. This process eliminated redundant 3179 documents. To prepare the data, we grouped the documents by author, after standardizing names (the original format is not consistent from document to document). The 10,918 anonymous documents are collected into one group that can be used for one-class classification. Except where indicated, 365 function words are used as features. The magnitude of each feature is calculated from the normalized frequency of the word in that document. Therefore, we in most experiments we use a vector with 365 dimensions to represent each document. We then use the classification methods in a variety of ways, to examine their robustness and their behaviour with scaling. Many previous papers use attribution methods for two-class classification, that is, to discriminate between two known authors. In this context, all the documents used for training and test are written by these two candidates. There is a natural generalization to nclass categorization for any n ≥ 2. One-class categorization is used to determine whether the given text was written by a particular author. In contrast to n-class problem, the negative examples do not have to be by particular authors; they are anonymous or by any other author. We can refer to these negative documents as noise. One-class classification is generally more challenging than two-class classification. Cross validation is used when the amount of data is limited. The main idea of cross validation, or hold-out, is to swap the roles of training data and testing data to observe the overall results of prediction. In our experiments using cross validation, the data is split into a fixed number of folds of similar size. Each fold in turn is classified while the remaining fold are used for training. We used ten folds in our experiments. Holding the number of folds to a fixed number means that results are obtained in a consistent way, but also means that results at different scales may not be comparable, as both the test and training data has changed. For this reason, in other experiments we reserved small sets of documents as test data, while varying the number of positive and negative documents used for training. Accuracy results are then directly comparable. In all of our experiments we have used the public domain Weka classifier available at www.cs.waikato.ac.nz/ml/weka [27].
5
Results
Two-class experiments In the first experiment, we compared the five classification methods using crossvalidation and two-class classification. We varied the size of the total document pool to see how the methods behaved at different scales. Results are shown in
Table 2. Effectiveness (percentage of test documents correctly attributed) of each method for attribution, using 10-fold cross-validation on two-class classification. Docs per author 20 50 100 200 400 600
Na¨ıve Bayes 80.24 85.14 85.91 85.83 85.57 85.53
Bayes net 80.00 85.99 89.67 89.29 90.11 90.46
NN 80.24 85.52 83.43 84.29 85.30 85.77
3-NN Decision tree 80.24 69.52 84.57 77.05 82.88 80.29 84.05 82.86 85.60 84.77 85.53 84.53
Table 3. Effectiveness (percentage of test documents correctly attributed) of each method for attribution, using the same 100 test queries per author on two-class classification. Results are averaged across eleven pairs of authors. Training docs per author 50 100 200 400 600 800
Na¨ıve Bayes 78.90 81.55 84.18 84.82 84.46 84.18
Bayes net 82.00 85.73 88.18 90.64 90.64 90.18
NN 75.70 76.27 80.00 80.00 80.73 83.36
3-NN Decision tree 77.91 73.55 78.27 79.00 81.46 82.55 80.91 86.18 81.46 86.73 83.64 86.73
Table 2, where outcomes are averaged across all 21 pairs of authors. Several trends can be observed. The first, and perhaps the most important, is that function words can indeed be reliably used for authorship attribution. All the methods become more effective as further documents are included, but only up to a point; only for the decision tree does effectiveness significantly improve for classes of more than 100 documents. For larger sets of documents, little separates four of the methods, but the fifth, Bayesian networks, is markedly superior. In our second experiment, we randomly chose eleven pairs of authors, ran the experiment on each pair; reported results are an average across these runs. These results are shown in Table 3. The methods are more clearly separated in these results than was the case above; the nearest-neighbour methods are poor, while Bayesian networks are effective at all scales, with slightly increasing accuracy as more training documents are included. We observed significant inconsistency from one pair of authors to another, throwing considerable doubt over the results reported in many of the previous papers on this topic, most of which used only two authors. In the next experiment, we increased the number of authors, examining the effectiveness as the number was increased from two to five. Results are averages across different sets of authors: we used 21 combinations of two and of five
Table 4. Effectiveness (percentage of test documents correctly attributed) of each method for attribution, using 10-fold cross-validation on two- to five-class classification. Number of Na¨ıve Bayes authors Bayes net 50 documents per author 2 85.91 89.67 3 77.50 79.49 4 69.90 75.83 5 66.44 71.72 300 documents per author 2 85.53 90.46 3 76.53 85.22 4 70.51 80.63 5 65.97 76.33
NN
3-NN Decision tree
83.43 75.96 71.57 69.51
82.88 74.57 70.62 66.21
80.29 70.48 63.10 58.90
85.77 78.71 73.66 70.54
85.53 78.98 74.03 69.98
84.53 74.96 67.22 62.15
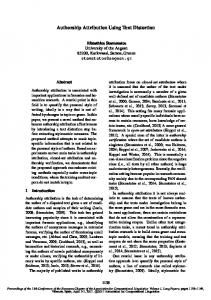
authors, and 35 combinations of three and of four authors. Results, shown in Table 4, are for cross-validation. The top half is with 50 documents per author, with 300 per author in the bottom half. (The use of different combinations of authors is why these results are not for two-class classification are not the same as in Table 2.) Again, Bayesian networks are consistently superior, while the decision tree has been the poorest method. These results are graphed in Figure 2, illustrating that the performance of the weaker methods declines sharply. We contend that these results demonstrate that multi-class classification is a much better test of effectiveness than is two-class classification: methods that are more or less indistinguishable for distinguishing between two authors are well separated for the task of identifying one author from amongst many. However, most prior work has focused on two-class classification. Note, however, that the worst case differs depending on the number of authors. For two-class classification, a random assignment gives 50% accuracy, while for five-class random assignment gives 20%. Thus, while effectiveness does degrade as the number of authors is increased, it is also the case that the problem is becoming innately more difficult. As an illustration of the limitations of some previous work on attribution, we ran experiments with the 65 Federalist papers of known authorship. This corpus has limitations, in addition to the small size; in particular that 50 of the papers are by one author and 15 by another, so that the worst case result — random assignment — is about 64%. However, this is the kind of corpus has been used in much of the previous work in the area. Using cross-fold validation, results ranged from 77% for nearest-neighbour to 95% for the decision tree. Whether the differences are statistically significant is unclear. When the problem was reduced to 15 by each author, all methods but nearest-neighbour (which was inferior) did excellently, with only one or two
NaiveBayes BayesNet NN 3NN C45
NaiveBayes BayesNet NN 3NN C45
0.8
accuracy
accuracy
0.9
0.7
0.8
0.7
0.6 2
3
4
5
2
3
4
authors
authors
Given 50 documents
Given 300 documents
(a)
5
(b)
Fig. 2. Scalability of N -class attribution in the number of authors, using 10-fold crossvalidation.
errors each. However, while this accuracy is at first sight a success, we believe that it is a consequence of the inadequacy of the test data. Slight differences in assignment lead to large numerical differences in accuracy that are probably not statistically significant; in contrast, we expect to observe statistical significance for even small numerical differences in the previous experiments, due to the large number of documents involved. Although similar sets of test data have been widely used in previous work, we believe the observed results cannot be reliable. One-class experiments We then examined the effectiveness of each method for one-class classification, using cross-fold validation. Results, shown in Table 5 and Figure 3, are averaged across all seven authors. In each block of the table we had a fixed number of documents per author and varied the number of noise documents. This problem is inherently harder than the problems considered above, as the noise documents are not by a limited set of authors, and thus do not share style. As the results show, accuracy declines significantly as the number of noise documents is increased. The best methods — nearest neighbour for a small set of positive examples and Bayesian networks and both nearest-neighbour methods for a larger set of positive examples — are markedly better than the alternatives. This experiment is in our view the most representative of attribution on a large collection, and has moreover shown the most power to distinguish between methods. We contend therefore that one-class classification is the best test of an attribution method. These experiments have also shown that attribution is indeed reasonably effective. In even the most difficult case, where where only around 1 in 50 documents is a positive example, accuracy of the best method is nearly 50%.
Table 5. Effectiveness (percentage of test documents correctly attributed) of each method for attribution, using cross-fold validation on one-class classification. Effectiveness is measured on only the positive examples. Number of Na¨ıve Bayes NN noise docs Bayes net Given 25 documents per author 25 93.71 86.86 96.57 50 83.43 80.00 94.86 100 64.00 73.14 72.00 200 47.43 65.71 63.43 400 36.00 50.86 58.29 600 31.43 46.29 52.57 800 29.14 44.57 49.29 1200 27.91 41.14 46.29 Given 300 documents per author 25 96.67 98.43 99.81 50 94.19 96.86 99.62 100 87.05 93.95 96.43 200 83.91 90.19 92.24 400 80.52 86.72 87.29 600 78.05 83.17 83.10 800 73.91 81.05 82.24 1000 73.38 80.24 81.24 1200 72.81 79.33 81.00 1600 72.76 78.91 78.52
3-NN Decision tree 97.71 95.43 64.00 54.29 44.00 38.86 37.14 36.00
78.86 72.57 65.14 53.71 47.43 34.29 30.29 29.71
100.00 100.00 98.81 94.72 87.62 83.14 82.62 80.86 79.33 76.91
97.05 94.05 90.43 84.43 78.76 74.72 70.62 67.67 65.67 61.33
As a final experiment, we timed each of the packages we used, to obtain an indication of the cost required for each classification method. These times are shown in Table 6, separated into training time and per-document attribution time. While they cannot be taken as conclusive, they do provide an indication of how well each approach scales. We can observe that the times do not strongly depend on whether the examples are positive or negative. Bayesian networks have by far the greatest training time, and the cost of training grows superlinearly. Training time for the other methods is small. However, the per-document classification times are less consistent. Bayesian networks and decision trees are fast, while for the larger collections the nearestneighbour methods are over a hundred times slower. Given the relatively poor effectiveness of the na¨ıve Bayesian classifier and the decision tree — the only methods that are fast for both training and classification — choice of method in practice will depend on the application.
6
Conclusions
We have undertaken the first comparison of authorship attribution methods proposed in previous literature. These experiments have shown that Bayesian
NaiveBayes BayesNet NN 3NN C45
correct documents
correct documents
NaiveBayes BayesNet NN 3NN C45
0.8 0.6 0.4 200
400
600
0.9 0.8 0.7
800 1000 1200
500
1000
noise
noise
One-Class (25 docs)
One-Class (300 docs)
(a)
1500
(b)
Fig. 3. Scalability of one-class classification, as the number of noise documents is increased. Table 6. Times (milliseconds) for each of the methods. Results in each column are total training time on the left and per-document classification time on the right, in a one-class experiment. Times are averaged over 70 runs. Examples Positive Negative 25 25 300 300
25 400 25 400
Na¨ıve Bayes 141/53 490/38 301/28 581/25
Bayes net 4513/12 16211/8 16657/7 76392/8
Classifier NN 20/86 60/764 40/442 60/930
3-NN 20/100 50/797 30/492 60/1033
Decision tree 310/2 1517/1 1060/1 3696/1
networks are the most effective of the methods we considered, while decision trees are particularly poor. We have also found that — given an appropriate classification method — function words are a sufficient style marker for distinguishing between authors, although it seems likely that further style markers could improve effectiveness. The best methods can scale to over a thousand documents, but effectiveness does decline significantly, particularly when the number of positive examples is limited. We have shown that use of a consistent test corpus can be used to distinguish between different approaches to attribution. However, it is also important to design experiments appropriately. Results need to be averaged across multiple experiments, as some authors are easier to attribute than others. We have also found that one-class attribution provides the greatest discrimination between methods. There are many alternative methods that have been proposed for authorship attribution, including other approaches to classification such as support vector
machines, and methods based on compression and natural language processing. The effectiveness of such techniques is currently unknown, as they have not been evaluated on consistent data. Evaluation approaches such as ours need to be used to measure these methods. Acknowledgements We thank Yaniv Bernstein. This work was supported by the Australian Research Council.
References 1. D. Aha and D. Kibler. Instance-based learning algorithms. Machine Learning, 6:37–66, 1991. 2. H. Baayen, H. V. Halteren, A. Neijt, and F. Tweedie. An experiment in authorship attribution. 6th JADT, 2002. 3. H. Baayen, H. V. Halteren, and F. Tweedie. Outside the cave of shadows: using syntactic annotation to enhance authorship attribution. Literary and Linguistic Computing, 11(3):121–132, 1996. 4. R. Baeza-Yates and B. Ribeiro-Neto. Modern Information Retrieval. AddisonWesley Longman, May 1999. 5. D. Benedetto, E. Caglioti, and V. Loreto. Language trees and zipping. The American Physical Society, 88(4), 2002. 6. Y. Bernstein and J. Zobel. A scalable system for identifying co-derivative documents. In A. Apostolico and M. Melucci, editors, Proceedings of the String Processing and Information Retrieval Symposium (SPIRE), pages 55–67, Padova, Italy, sep 2004. Springer. Published as LNCS 3246. 7. J. N. G. Binongo. Who wrote the 15th book of oz? an application of multivariate statistics to authorship attribution. Computational Linguistics, 16(2):9–17, 2003. 8. J. Burrows. Word patterns and story shapes: the statistical analysis of narrative style. Literary and linguistic Computing, 2:61–70, 1987. 9. J. Burrows. Delta: a measure of stylistic difference and a guide to likely authorship. Literary and Linguistic Computing, 17:267–287, 2002. 10. J. Diederich, J. Kindermann, E. Leopold, and G. Paass. Authorship attribution with support vector machines. Applied Intelligence, 19(1-2):109–123, 2003. 11. D. D’Souza, J. Thom, and J. Zobel. Collection selection for managed distributed document databases. Information Processing & Management, 40:527–546, 2004. 12. G. Fung. The disputed federalist papers: Svm feature selection via concave minimization. In Proceedings of the 2003 conference on Diversity in computing, pages 42–46. ACM Press, 2003. 13. J. Goodman. Extended comment on language trees and zipping. 14. D. Harman. Overview of the second text retrieval conference (TREC-2). Information Processing & Management, 31(3):271–289, 1995. 15. D. Heckerman, D. Geiger, and D. Chickering. Learning Bayesian networks: the combination of knowledge and statistical data. Machine Learning, 20:197–243, 1995. 16. D. I. Holmes, M. Robertson, and R. paez. Stephen crane and the new-york tribune: A case study in traditional and non-traditional authorship attribution. Computers and the Humanities, 35(3):315–331, 2001.
17. G. H. John and P. Langley. Estimating continuous distributions in Bayesian classifiers. In Eleventh Conference on Uncertainty in Artificial Intelligence, pages 338–345. Morgan Kaufmann Publisher, 1995. 18. P. Juola and H. Baayen. A controlled-corpus experiment in authorship identification by cross-entropy. Literary and Linguistic Computing, 2003. 19. V. Keselj, F. Peng, N. Cercone, and C. Thomas. N-gram-based author profiles for authorship attribution. In Pasific Association for Computational Linguistics, pages 256–264, 2003. 20. D. V. Khmelev and F. J. Tweedie. Using markov chains for identification of writers. Literary and Linguistic Computing, 16(4):229–307, 2002. 21. P. Langley and S. Sage. Tractable average-case analysis of naive Bayesian classifiers. In Eleventh Conference on Uncertainty in Artificial Intelligence, pages 220–228. Morgan Kaufmann Publisher, 1999. 22. F. Peng, D. Schuurmans, V. Keselj, and S. Wang. Language independent authorship attribution using character level language models. In 10th Conference of the European Chapter of the Association for Computational Linguistics, EACL, 2003. 23. R. Quinlan. C4.5: Programs for Machine Learning. San Mateo, CA: Morgan Kaufmann, 1993. 24. F. Sebastiani. Machine learning in automated text categorization. ACM Comput. Surv., 34(1):1–47, 2002. 25. E. Stamatatos, N. Fakotakis, and G. Kokkinakis. Automatic authorship attribution. In Proceedings of the 9th Conference of the European Chapter of the Association for Computational Linguistics, pages 158–164, 1999. 26. E. Stamatatos, N. Fakotakis, and G. Kokkinakis. Computer-based authorship attribution without lexical measures. Computers and the Humanities, 35(2):193– 214, 2001. 27. I. H. Witten and E. Frank. Data Mining: Practical machine learning tools with Java implementations. Morgan Kaufmann, San Francisco, 2000.