Effective Browsing of Web Image Search Results Hao Liu1, Xing Xie2, Xiaoou Tang1, Zhi-Wei Li2, Wei-Ying Ma2 Microsoft Research Asia2 5F, Sigma building, No. 49, Zhichun Road Beijing, 100080, P.R.China
Department of Information Engineering the Chinese University of Hong Kong1 Shatin, Hong Kong
{xingx, i-zli, wyma}@microsoft.com
[email protected],
[email protected]
ABSTRACT The rapid development of web image search engines has enabled users to search hundred million of images available on the Web. However, due to the unsatisfactory performance of current search technologies, people still need to spend much time in navigating through the large number of result pages to find images of their interest. In this paper, we analyze the user information needs for web image search results browsing and propose to employ a similarity-based organization to present the search results. A user study is carried out to compare our approach with a ranking-based list interface and a cluster-based interface. Experimental results show that similarity-based presentation can help users to explore image search results more naturally and efficiently.
Categories and Subject Descriptors I.4.9 [Image Processing and Computer Vision]: Applications
General Terms Algorithms, Human Factors
Keywords Web image retrieval, image browsing, user interface, attention model, multidimensional scaling
1. INTRODUCTION With the rapid improvements in both hardware and software technologies, large collections of images have been made available on the Web. To help users find images on the Web, the problem of web image retrieval has been intensively studied for years and a number of approaches have been proposed. Many commercial search engines have developed technologies that allow users to search hundred million of Web images based on keywords. Recently, several studies on web information retrieval have enabled people take into account more knowledge of user web search behaviors. Instead of employing the traditional notion of “information need” to describe the user’s motivation for web
search, Broder [1] came up with a trichotomy of web search types: navigational, informational, and transactional. Navigational searches are predicted on user’s intention to find specific web resources that the user has in mind; informational searches are used to describe the intention to find information about a topic; transactional searches are intended to “perform some web-mediated activity”. Rose & Levinson [2] also find the same differences in user’s information needs by examining the query logs from AltaVisa. Despite the slight differences of their results, both of them have repeatedly shown that the informational search acts dominate web search activities. Broder showed that web search with informational goals accounts for nearly 40%-50% of all search acts. In the study by Rose & Levinson, it was confirmed that informational search is the most frequent activity, comprising more than 60% of search acts. Compared with the research efforts, such as [3][4], been devoted in Web images indexing and ranking algorithms, the research on the presentation of search results has received less attention. A simple list-based interface is the dominant presentation method in commercial systems such as Google [5] and Altavista [6] image search. In navigational search activities, such ranking based-based list presentation interface works well since user will be satisfied after they get a couple of images of interest in first web page returned by search engine. However, in informational search activities, user usually wants to learn something about a topic or get an answer to an open-ended question. Due to the difficulties of the problem of web image retrieval, ranking algorithm is still far from to achieve satisfactory performance. The images presented in the first page are not necessary better than those in the following pages in terms of their relevance to the query. So the list presentation method will be inadequate under such circumstance, especially when user wants to do some comparison between different results. People have to scan image one after another sequentially and devote considerable efforts in page navigations to find the images of their interest. In this paper, we intend to study a variety of search results presentations for web image search engines. The novel contributions of our work include: •
We propose a similarity-based method for search results presentation. A one page overview is constructed and attention model is applied to display more information in each thumbnail. Users can interact with the overview by dragging a slider to adjust the global overlapping ratio, and interact with interested image item to generate a detail view.
•
A user study has been carried out to compare our approach with a list presentation and a cluster-based presentation method. Experimental results show that our proposed approach helps users search images more naturally and efficiently.
This work was conducted at Microsoft Research Asia. Permission to make digital or hard copies of all or part of this work for personal or classroom use is granted without fee provided that copies are not made or distributed for profit or commercial advantage and that copies bear this notice and the full citation on the first page. To copy otherwise, or republish, to post on servers or to redistribute to lists, requires prior specific permission and/or a fee. MIR’04, October 15–16, 2004, New York, New York, USA. Copyright 2004 ACM 1-58113-940-3/04/0010...$5.00.
The remainder of this paper is organized as follows. In Section 2, the related works and our method to present the image collection are introduced. We also points out the key techniques required to achieve better browsing experience. In Section 3, we introduce a task-driven attention model for browsing web image search results. A scheme for similarity-based search results presentation and its main features are presented in Section 4. A user study is carried out in Section 5. Finally, Section 6 concludes the paper.
2. IMAGE SERACH RESULES BROWSING Although the problem of browsing and navigation of large image collections has been studied under different contexts, such as personal albums or professional libraries, none of them has taken web images into consideration. The characteristics of underlying data sets can heavily affect the effectiveness of presentation approaches. For example, home photos would be best browsed in a chronicle order [7][8], by location [9], or by person [10]. As for professional photo libraries, they contain more annotations and usually have been classified into different categories. In [11], the experimental results indicate that a random presentation sometimes is better than a similarity-based presentation. This is mainly because that their images come from a professional database and are all relevant closely to the same topic. Therefore, interesting images usually have high contrast to their neighbors and appear to stand out in a random organization. For web images, time or location information would be either unavailable or inaccurate. To solve this problem, we get some insights from the theory of information scent [12], which can be regarded as local cues used to assess and navigate towards information resources. It provides an indication of the utility or relevance of a navigation path for information foraging. If we can employ some similarity measurement criteria to narrow down the spatial distribution of images which contain similarity attributes, so as to increase the information scent, it will enable users, while browsing the image collection at first sight, to locate some specific subsets more quickly and compare similar images of more efficiently. Although similarity-based visualization can help users find the right image quickly especially for web images search results, some hurdles still need to be crossed in order to make people really enjoy it. One problem of similarity-based visualization is to find an effective tool to measure the similarity between two images. Another problem is information loss caused by image down-sampling when we try to put more images on one screen. So a better thumbnail generation technology other than directly down-sampling is needed to use the space more efficiently. In the next Section, we propose a task driven attention model, which can be adopted to solve above problems.
3. TASK DRIVEN ATTENTION MODEL It has been systematically shown by using eye-movements (EMs) experiment that specific tasks can significantly alter the viewing strategy [13]. In most of the time, the user has a specific task when conducting web image search, therefore, the different image regions are of different importance to him. For example, while a user is trying to find “Porsche” on the Internet, suppose an image containing a Porsche running along a sea-side road is returned by search engine. Under such circumstance, the ocean
will be regarded as the background, and it will be less attractive for users than the Porsche itself. If the same image is returned while the user is trying to find “ocean”, the ocean will be more attractive than Porsche in this case. An extensible attention model for image adaptation and some its applications have been studied recently [14][15][16]. Instead of treating an image as a whole, it manipulates each region-ofinterest in the image separately, thus allows delivery of the most important region to the client with higher priority. Since general attention includes only limited types of attention objects such as saliency, face and text, we extend the existing model to accommodate use’s preference, that is, include those regions that are related to the user’s tasks. Because search engines typically only present thumbnail of images to users, the Minimal Perceptible Scale (MPS) attribute [14] is not considered in our design. Definition 1: The visual attention model for an image is defined as a set of attention objects:
{AOi } = {(ROI i , AVi )}, where AOi, ROIi, AVi, N,
1≤ i ≤ N
(1)
the ith attention object within the image Region-Of-Interest of AOi attention value of AOi total number of attention objects in the image
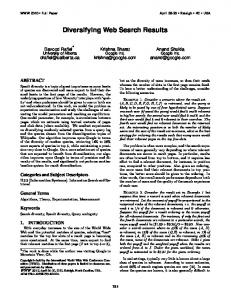
We assign two attributes to each attention object, which are Region-Of-Interest (ROI), attention value (AV). The notion of ‘Region-Of-Interest (ROI)’ is borrowed from JPEG 2000, which is referred as a spatial region within an image that corresponds to an attention object. Attention value (AV) is a quantified value indicates the weight of each attention object in contribution to the information contained in the original image. As shown in Figure 1, we use three steps to build the attention model of each returned image. Using similar approach in [16], we firstly try to map user’s task to a set of low-level features, and then extract the task related region objects of each image and add these regions to the attention model of the image. Finally, we detect generic attention objects such as saliency and face objects as described in [14][17]. Since some attention objects are extracted based on user’s query, we call such image model taskdriven attention model. Many time-consuming processes such as image segmentation, saliency and face object detection, can be executed offline, so time cost for building task-driven attention model is acceptable.
3.1 Attention-based Thumbnail Generation As discussed in Section 2, in order to avoid information loss caused by directly image down-sampling, we generate a thumbnail for each image based on task-driven attention model. Our approach, which is similar to the techniques employed in [14][18], automatically crops less informative regions and keep the most informative part of the image, which is called attention region. Cropping can increase the signal to noise ratio of the images presented to user, that is, the ratio of important regions containing target attributes to the unimportant regions containing distracter attributes. Thus, the spatial resources are used in a more efficient way.
Query Words (1)
(2)
Key Words Expansion
Segmentation
Query-Feature Mapping
Feature
Task based Attention Object Extraction
Given the image similarity matrix VM, we employ the Multidimensional Scaling (MDS) [19] to map each image items into two-dimensional layout space. MDS can achieve this objective by treating inter-object dissimilarities as distances in high dimensional space, and approximating them in a low dimensional output configuration. In this way, similar images are placed nearby and relations between image items are well preserved as shown in Figure 2(a).
Image (3)
A problem of similarity-based visualization is the overlapping layout design, which makes some part of images invisible to user. When two images reside nearby with each other in presentation panel, their relationship in Z-dimension (perpendicular to the panel) is determined by the ranking returned by search engine, that is, the image of higher ranking will take the advantage to appear in front of the one of lower ranking.
Generic Attention Object Detection
Task based Attention Objects
Face
Saliency
Figure 1. Task Driven Attention Model.
3.2 Attention-based Similarity Measurement For web image search results, image similarity can be generated based on many properties of the image, such as web link, surrounding text or semantic features. We adopt two sources of information to evaluate the image similarity information: one is the content feature of the whole image and the other comes from attention region of the image, so as to incorporate the semantic concept of image into the similarity measurement. The similarity of image item and attention region can be measured as Euclidean distance:
IM i j =|| FVi − FV j ||;
(2)
RM i j =|| FV ARi − FV AR j ||;
(3)
where IM is the image similarity matrix, which is referred as the similarity between image Ii and Ij; RM is the region similarity matrix, which is referred as the similarity between the attention region of image Ii and Ij. The final similarity measurement between two images is the combination of above two similarity matrix:
VM i j = αRM i j + (1 − α ) IM i j
(4)
where α is the weight to achieve a balance between overall similarity, which represent the content of the entire image, and attention region similarity, which represents the attributes of the image preferred by users.
4. SIMILARITY BASED IMAGE SEARCH RESULTS PRESENTATION In this section, we will introduce the design of a novel web image search interface which is based on the discussion in Section 2. Each image item is presented in an attention-based thumbnail generated by the method described in Section 3.
4.1 Similarity-based Overview As discussed in Section 2, a similarity-based overview is helpful for browsing web image search results, particularly when the ranking performance is not good. In our approach, visual similarity described in Section 3.3 is used to generate the similarity-based overview of search results.
4.2 Fitting Images to a Grid View Although a small degree of overlapping will not affect the user understanding the content of an image [20], while aggressive overlapping will prevent users from finding certain images. In addition, overlapping design produce a very high visual density, Pirolli et al [12] concluded that strong information scent expands the spotlight of attention whereas crowding of targets in the compressed region narrows it. Therefore it is important to provide a control scheme to achieve the balance between information scent and density collection presentation. To solve these problems, we develop a two-dimension grid view to fit all the images into this grid while maximizing the original similarity relationship. An grid algorithm with space requirement of O(m2) and time requirement of O(m2)+O(n2) was presented in [11], where m is the grid length and n is the number of points in the configuration. Although, it can preserve distances between most closely related objects, the space/time requirement is relatively high. We observe that human vision system is not very sensitive to the absolute grid relationship between each image item and, at the same time, the space/time requirement of the algorithm is more important for search engine to render the grid view in real time. So we design a simple alternative grid algorithm to achieve the balance between the grid precision and space/time requirement. Suppose X and Y are the number of columns and rows of the image presentation panel. Let I ={Ii(xSim, ySim) | 1 ≤ i ≤ M} be the returned image dataset, where M is the number of images, (xSim ySim) is spatial position of Ii in two-dimensional visual space. Let J = {1, 2, …, M} be an index set. We order image set I1, I2, …, IM to a sequence Iφ(1), Iφ(2), …, Iφ(M) such that Iφ(i)(xSim) < Iφ(j) (xSim) for i < j, where φ is a permutation of the index set J. For each {s}={ s | s ∈ I, max(s+1)·Y < M}, denote Ks = { sY+1, sY+2, …, sY+Y} an index set, reorder image subset Is={Iφ(sY+1), Iφ(sY+2), …, Iφ(sY +Y)} to a sequence Iψ(φ(sY+1)), Iψ(φ(sY+2)), …, Iψ(φ(sY+Y)) such that Iψ(φ(sY+i))(ySim) < Iψ(φ(sY+j))(ySim), for i < j, where ψ is a permutation of the index set Ks.
I i ( xGrid ) = ψ (ϕ (i )) / Y
(5)
I i ( yGrid ) = ψ (ϕ (i )) mod Y
(6)
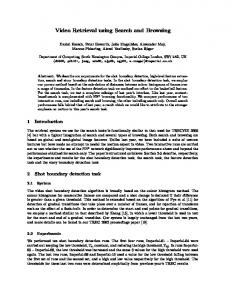
(a) Similarity-based overview γ=1.0
(b) Overlapping ratio γ=0.75
(c) Overlapping ratio γ=0.5
(d) Fitting to a Grid view γ=0
Figure 2. From Similarity-based overview to Grid View. Since xGrid and yGrid in Equation (5) (6) are integers, we normalize them to fit into the image panel. Noted that X and Y are interchangeable, it is a grid algorithm of optimization in one dimension and sub-optimization in another. By employing the quick sort method, the time and space requirement of the new algorithm is O(2n log(n)-n log(m)), where n is the number of image item and m is the number of columns or rows.
4.3 Dynamic Overlapping Adjustment In fact, the best overlapping ratio is hard to decide, since it depends on both the image collection and the user. Though different overlapping ratio can be generated automatically using similarity-based overview and Grid view, when both cannot satisfy the user’s requirement due to too much information loss caused by overlapping or relationship loss caused by grid algorithm, it is reasonable to allow users to adjust overlapping ratio themselves. Therefore, we introduce a new interactive feature in to our system, that is, to let users adjust the spatial position of images to modify the overlapping ratio of the presentation by a slider bar. In our system, the new point where image resides can be determined by the following equation: i i i = γPSim + (1 − γ ) PGrid Pnew
(7)
where γ is the overlapping ratio, PSim and PGrid is the spatial position where image resides in Similarity-based overview and
Grid view. The user can adjust the overlapping ratio r by a slider bar to achieve a suitable presentation. Figure 2(a)-(d) show the prototype of overlapping adjustment from γ=0 to γ=1 with a real browsing example.
4.4 Fisheye View Since users are usually interested in a small part instead of the whole image collection, users will feel more convenient if part of the image collection can be presented in a clearer way. In our approach, users can customize current view by interacting with the interested image item through mouse click, and a fisheye view is then generated to provide such detailed view function. Fisheye view, an analogue of fisheye lens, is a valuable tool to help users see both local detail and global context information simultaneously [21]. The fisheye view in our implementation, as shown in Figure 3, uses a distorted polar coordinate system, consequently distorting only the spatial relationship of images on the presentation panel. At the same time, the focus image will be substituted with the original (non-cropped) one and shown in detail. The position of the images that are further away from the focus image will appear slightly squashed, that is the further image items are positioned away from the focus, the closer they appear in the image panel. The distortion rate was set 0.5 in our system.
Figure 4. A ranking-based list interface. Figure 3. Fisheye view.
5. USER STUDY In order to compare different types of schemes for browsing web image search results, a controlled user study experiment has been carried out. Experimental results are presented and discussed in this section.
5.1 Participants There were ten participants, six male and four female. They were recruited from nearby universities. All of them were undergraduate students and majored in computer science or communication engineering, except one who majored in physics. The only criterion for selecting the subjects was that they should have frequently performed image search tasks on the web before the study. One subject was for our pilot study and his results were used to revise the interface design.
5.2 Data Sets The same data set was used in comparing different types of interfaces. Seventeen queries were selected and sent to a commercial image search engine. The first 200 results returned for each query were saved as our test data. Therefore, the data set contains 3400 images in total. The 17 queries we used are: Table 1. Query terms used in the experiment. Practicing
Testing
Query terms Summer Palace Christmas card dog fire fish flame tree Porsche Great Wall Harry Potter Chinese Hawaii Lord of Rings Forbidden City New Zealand ocean PDA sunrise
These queries are intended to represent the interests of a large variety of people. Among them, the first two were provided to allow subjects to practice and get familiar with the interfaces.
5.3 Three Types of Interfaces In the experiment, we compared our approach with a rankingbased list presentation and a cluster-based list presentation. As shown in Figure 4, we downloaded Google’s search results web pages for each query and used them as the ranking-based list presentation. It divides the results into a set of pages, each page contains 20 images and images in the same page are usually arranged in a grid. People can jump among different pages to explore more results by clicking the links at the end of each web page.
For the cluster-based list presentation, as shown in Figure 5, 200 results in each query are grouped into five clusters by k-means algorithm based on the same features used in our approach. For each cluster, four representation images are selected, and provided to users on the left column as the cluster preview. Users can browse the search results by looking at the preview of each cluster at first, and then move forward by clicking the link of interested cluster so as to explore the correspondent images on the right column. Users can switch among five clusters until they find target images in the cluster.
Figure 5. A cluster-based interface. All the three interfaces are implemented using ASP.NET and java script. Users can select a query and one of the three presentation schemes to view the search results. A 17 inch LCD monitor was provided to each subject and the resolution was set at1280x1024.
5.4 Tasks Our tasks were designed to evaluate efficiency of three types of Interfaces under informational browsing activities. That is, users are supposed to has a goal in his/her mind to obtaining information about a topic before starting each query. For each query, they tried to find a few images most relevant to the query terms. The number of relevant images is determined by users. They can stop browsing the result collection whenever they think they have already gotten enough information about the query topic. Each user was asked to complete all the fifteen testing queries in the same order. The interface presentation order was varied for each user: three users were given the list-based, then the clusterbased and finally our similarity-based approach; three saw the cluster-based first, our approach and the list-based last; and three saw our approach first, the list-based and the cluster-based last. Thus, each query was used with three users on each interface. This balanced ordering meant that all interfaces were used equally with all queries and any learning or query-interface biases were reduced. In order to reduce any performance influence due to familiarity and experience, the subjects were first asked to try all the three types of interfaces using the two sample queries for a sufficient amount of time. All the user interactions and corresponding timestamps were recorded for later analysis, including page navigation, dragging
of the slider and clicking of the fisheye view. A small questionnaire was given to the subjects after the searching task, in order to get their feedback on the interface design. The questions were: Table 2. The questions used in the experiment. ID 1 2 3 4
Question When do you think web image search will be useful? Give a few scenarios. Which of the three interfaces do you like the best? Give a score for the usefulness of the three features in similarity-based organization approach (thumbnail cropping, slider and fisheye view). Do you think there are any other potential improvements?
5.5 Experiments Results The subjects thought that web image search would be very useful while designing homepages, making greeting cards, or writing reports. Some of them also searched images just for fun, for example, searching for photos related to recent news or some famous people. But none of them thought it could be applied to serious scenarios, like authoring books or preparing slides for important talks.
Seven out of nine liked similarity-based approach while the other two preferred the cluster-based interface. None of the subjects preferred the list-based approach. People who liked similarity-based approach thought that it was more intuitive and interesting, also convenient for comparing similar images. They said that similarity-based organization was in good accord with characteristics of human perception, therefore, was helpful to narrow down the searching process. Whereas people who preferred to cluster-based view think that similarity-based approach required more downloading time. One subject suggested that it will be more convenient if three browsing interfaces are provided at the same time so as to let users to decide which one to be used for different requirements. Table 3. The average scores for the three features Function Score
Thumbnail cropping 3.8
Slider 4.3
Fisheye view 2.8
List
350
Cluster Similarity
300 250 Search time (seconds)
searching speeds, eight users spent more time on the list-based interface except one (user 7) who used nearly the same time for all three interfaces. So our approach performed significantly better than the list-based interface. Moreover, query terms did not have a significant impact on the search time (F(14,120)=0.65, p=0.81). This indicates that there were no significant learning effects.
200 150 100 50 0 1
2
3
4
5
6
7
8
9
Subjects
Figure 6. The average search time for each people/interface combination. The experimental results were analyzed by one way ANOVA with search time as the dependent variable. We applied a log transform to the time to make the distribution more normal. It is found that the type of interface significantly affected the search time (F(2,132)=9.56, p