Intelligence and Industrial Application ,volume 01 Pages: 37-43,2008. [14] Seppo Puuronen, Vagan Terziyan and Alexander Logvinovsky, “Mining several data ...
(IJCSIS) International Journal of Computer Science and Information Security, Vol. 9, No. 7, July 2011
Effective Classification Algorithms to Predict the Accuracy of Tuberculosis-A Machine Learning Approach Asha.T
S. Natarajan
K.N.B. Murthy
Dept. of Info.Science & Engg., Bangalore Institute of Technology Bangalore, INDIA
Dept. of Info. Science & Engg. P.E.S. Institute of Technology Bangalore,INDIA
Dept.of Info. Science & Engg. P.E.S.Institute of Technology Bangalore,INDIA
medical knowledge as has been proved in a number of medical data mining applications.
Abstract— Tuberculosis is a disease caused by mycobacterium which can affect virtually all organs, not sparing even the relatively inaccessible sites. India has the world’s highest burden of tuberculosis (TB) with million estimated incident cases per year. Studies suggest that active tuberculosis accelerates the progression of Human Immunodeficiency Virus (HIV) infection. Tuberculosis is much more likely to be a fatal disease among HIV-infected persons than persons without HIV infection. Diagnosis of pulmonary tuberculosis has always been a problem. Classification of medical data is an important task in the prediction of any disease. It even helps doctors in their diagnosis decisions. In this paper we propose a machine learning approach to compare the performance of both basic learning classifiers and ensemble of classifiers on Tuberculosis data. The classification models were trained using the real data collected from a city hospital. The trained models were then used for predicting the Tuberculosis as two categories Pulmonary Tuberculosis(PTB) and Retroviral PTB(RPTB) i.e. TB along with Acquired Immune Deficiency Syndrome(AIDS). The prediction accuracy of the classifiers was evaluated using 10-fold Cross Validation and the results have been compared to obtain the best prediction accuracy. The results indicate that Support Vector Machine (SVM) performs well among basic learning classifiers and Random forest from ensemble with the accuracy of 99.14% from both classifiers respectively. Various other measures like Specificity, Sensitivity, F-measure and ROC area have been used in comparison. Keywords-component; Machine Classification, PTB, Retroviral PTB
I.
learning;
Data classification process using knowledge obtained from known historical data has been one of the most intensively studied subjects in statistics, decision science and computer science. Data mining techniques have been applied to medical services in several areas, including prediction of effectiveness of surgical procedures, medical tests, medication, and the discovery of relationships among clinical and diagnosis data. In order to help the clinicians in diagnosing the type of disease computerized data mining and decision support tools are used which are able to help clinicians to process a huge amount of data available from solving previous cases and suggest the probable diagnosis based on the values of several important attributes. There have been numerous comparisons of the different classification and prediction methods, and the matter remains a research topic. No single method has been found to be superior over all others for all data sets. India has the world’s highest burden of tuberculosis (TB) with million estimated incident cases per year. It also ranks[20] among the world’s highest HIV burden with an estimated 2.3 million persons living with HIV/AIDS. Tuberculosis is much more likely to be a fatal disease among HIV-infected persons than persons without HIV infection. It is a disease caused by mycobacterium which can affect virtually all organs, not sparing even the relatively inaccessible sites. The microorganisms usually enter the body by inhalation through the lungs. They spread from the initial location in the lungs to other parts of the body via the blood stream. They present a diagnostic dilemma even for physicians with a great deal of experience in this disease.
Tuberculosis;
INTRODUCTION
There is an explosive growth of bio-medical data, ranging from those collected in pharmaceutical studies and cancer therapy investigations to those identified in genomics and proteomics research. The rapid progress in data mining research has led to the development of efficient and scalable methods to discover knowledge from these data. Medical data mining is an active research area under data mining since medical databases have accumulated large quantities of information about patients and their clinical conditions. Relationships and patterns hidden in this data can provide new
II.
RELATED WORK
Orhan Er. And Temuritus[1] present a study on tuberculosis diagnosis, carried out with the help of Multilayer Neural Networks (MLNNs). For this purpose, an MLNN with two hidden layers and a genetic algorithm for training algorithm has been used. Data mining approach was adopted to classify genotype of mycobacterium tuberculosis using c4.5 algorithm[2].Rethabile Khutlang et.al. present methods for the
89
http://sites.google.com/site/ijcsis/ ISSN 1947-5500
(IJCSIS) International Journal of Computer Science and Information Security, Vol. 9, No. 7, July 2011
automated identification of Mycobacterium tuberculosis in images of Ziehl–Neelsen (ZN) stained sputum smears obtained using a bright-field microscope.They segment candidate bacillus objects using a combination of two-class pixel classifiers[3].
III.
DATA SOURCE
The medical dataset we are classifying includes 700 real records of patients suffering from TB obtained from a city hospital. The entire dataset is put in one file having many records. Each record corresponds to most relevant information of one patient. Initial queries by doctor as symptoms and some required test details of patients have been considered as main attributes. Totally there are 11 attributes(symptoms) and one class attribute. The symptoms of each patient such as age, chroniccough(weeks), loss of weight, intermittent fever(days), night sweats, Sputum, Bloodcough, chestpain, HIV, radiographic findings, wheezing and class are considered as attributes.
Sejong Yoon, Saejoon Kim [4] proposes a mutual information-based Support Vector Machine Recursive Feature Elimination (SVM-RFE) as the classification method with feature selection in this paper.Diagnosis of breast cancer using different classification techniques was carried out[5,6,7,8]. A new constrained-syntax genetic programming algorithm[9] was developed to discover classification rules for diagnosing certain pathologies.Kwokleung Chan et.al. [10] used several machine learning and traditional calssifiers in the classification of glaucoma disease and compared the performance using ROC. Various classification algorithms based on statistical and neural network methods were presented and tested for quantitative tissue characterization of diffuse liver disease from ultrasound images[11] and comparison of classifiers in sleep apnea[18]. Ranjit Abraham et.al.[19] propose a new feature selection algorithm CHI-WSS to improve the classification accuracy of Naïve Bayes with respect to medical datasets.
Table I shows names of 12 attributes considered along with their Data Types (DT). Type N-indicates numerical and C is categorical. Table I. List of Attributes and their Datatypes
Minou Rabiei et.al.[12] use tree based ensemble classifiers for the diagnosis of excess water production. Their results demonstrate the applicability of this technique in successful diagnosis of water production problems. Hongqi Li, Haifeng Guo et.al. present[13] a comprehensive comparative study on petroleum exploration and production using five feature selection methods including expert judgment, CFS, LVF, Relief-F, and SVM-RFE, and fourteen algorithms from five distinct kinds of classification methods including decision tree, artificial neural network, support vector machines(SVM), Bayesian network and ensemble learning. Paper on “Mining Several Data Bases with an Ensemble of Classifiers”[14] analyze the two types of conflicts, one created by data inconsistency within the area of the intersection of the data bases and the second is created when the meta method selects different data mining methods with inconsistent competence maps for the objects of the intersected part and their combinations and suggest ways to handle them. Referenced paper[15] studies medical data classification methods, comparing decision tree and system reconstruction analysis as applied to heart disease medical data mining. Under most circumstances, single classifiers, such as neural networks, support vector machines and decision trees, exhibit worst performance. In order to further enhance performance combination of these methods in a multi-level combination scheme was proposed that improves efficiency[16]. paper[17] demonstrates the use of adductive network classifier committees trained on different features for improving classification accuracy in medical diagnosis.
No
Name
DT
1
Age
N
2
Chroniccough(weeks)
N
3
WeightLoss
C
4
Intermittentfever
N
5
Nightsweats
C
6
Bloodcough
C
7
Chestpain
C
8
HIV
C
9
Radiographicfindings
C
10
Sputum
C
11
Wheezing
C
12
Class
C
IV.
CLASSIFICATION ALGORITHMS
SVM (SMO) The original SVM algorithm was invented by Vladimir Vapnik. The standard SVM takes a set of input data, and predicts, for each given input, which of two possible classes the input is a member of, which makes the SVM a nonprobabilistic binary linear classifier. A support vector machine constructs a hyperplane or set of hyperplanes in a high or infinite dimensional space, which can be used for classification, regression or other tasks. Intuitively, a good separation is achieved by the hyperplane that has the largest distance to the nearest training data points of any class (so-called functional margin), since in general the larger the margin the lower the generalization error of the classifier. K-Nearest Neighbors(IBK) The k-nearest neighbors algorithm (k-NN) is a method for[22] classifying objects based on closest training examples in the
90
http://sites.google.com/site/ijcsis/ ISSN 1947-5500
(IJCSIS) International Journal of Computer Science and Information Security, Vol. 9, No. 7, July 2011
individual trees. It is a popular algorithm which builds a randomized decision tree in each iteration of the bagging algorithm and often produces excellent predictors.
feature space. k-NN is a type of instance-based learning., or lazy learning where the function is only approximated locally and all computation is deferred until classification. Here an object is classified by a majority vote of its neighbors, with the object being assigned to the class most common amongst its k nearest neighbors (k is a positive, typically small).
V.
EXPERIMENTAL SETUP
The open source tool Weka was used in different phases of the experiment. Weka is a collection of state-of-the-art machine learning algorithms[26] for a wide range of data mining tasks such as data preprocessing, attribute selection, clustering, and classification. Weka has been used in prior research both in the field of clinical data mining and in bioinformatics.
Naive Bayesian Classifier (Naive Bayes) It is Bayes classifier which is a simple probabilistic classifier based on applying Baye’s theorem(from Bayesian statistics) with strong (naive) independence[23] assumptions. In probability theory Bayes theorem shows how one conditional probability (such as the probability of a hypothesis given observed evidence) depends on its inverse (in this case, the probability of that evidence given the hypothesis). In more technical terms, the theorem expresses the posterior probability (i.e. after evidence E is observed) of a hypothesis H in terms of the prior probabilities of H and E, and the probability of E given H. It implies that evidence has a stronger confirming effect if it was more unlikely before being observed.
Weka has four main graphical user interfaces(GUI).The main graphical user interface are Explorer and Experimenter. Our Experiment has been tried under both Explorer and Experimenter GUI of weka. In the Explorer we can flip back and forth between the results we have obtained,evaluate the models that have been built on different datasets, and visualize graphically both the models and the datasets themselvesincluding any classification errors the models make. Experimenter on the other side allows us to automate the process by making it easy to run classifiers and filters with different parameter settings on a corpus of datasets, collect performance statistics, and perform significance tests. Advanced users can employ the Experimenter to distribute the computing load across multiple machines using java remote method invocation.
C4.5 Decision Tree(J48 in weka) Perhaps C4.5 algorithm which was developed by Quinlan is the most popular tree classifier[21]. It is a decision support tool that uses a tree-like graph or model of decisions and their possible consequences, including chance event outcomes, resource costs, and utility. Weka classifier package has its own version of C4.5 known as J48. J48 is an optimized implementation of C4.5 rev. 8.
A. Cross-Validation Cross validation with 10 folds has been used for evaluating the classifier models. Cross-Validation (CV) is the standard Data Mining method for evaluating performance of classification algorithms mainly, to evaluate the Error Rate of a learning technique. In CV a dataset is partitioned in n folds, where each is used for testing and the remainder used for training. The procedure of testing and training is repeated n times so that each partition or fold is used once for testing. The standard way of predicting the error rate of a learning technique given a single, fixed sample of data is to use a stratified 10-fold crossvalidation. Stratification implies making sure that when sampling is done each class is properly represented in both training and test datasets. This is achieved by randomly sampling the dataset when doing the n fold partitions. In a stratified 10-fold Cross-Validation the data is divided randomly into 10 parts in which the class is represented in approximately the same proportions as in the full dataset. Each part is held out in turn and the learning scheme trained on the remaining nine-tenths; then its error rate is calculated on the holdout set. The learning procedure is executed a total of 10 times on different training sets, and finally the 10 error rates are averaged to yield an overall error estimate. When seeking an accurate error estimate, it is standard procedure to repeat the CV process 10 times. This means invoking the learning algorithm 100 times. Given two models M1 and M2 with different accuracies tested on different instances of a data set,
Bagging(bagging) Bagging (Bootstrap aggregating) was proposed by Leo Breiman in 1994 to improve the classification by combining classifications of randomly generated training sets. The concept of bagging (voting for classification, averaging for regression-type problems with continuous dependent variables of interest) applies to the area of predictive data mining to combine the predicted classifications (prediction) from multiple models, or from the same type of model for different learning data. It is a technique generating multiple training sets by sampling with replacement from the available training data and assigns vote for each classification. Adaboost(Adaboost M1) AdaBoost is an algorithm for constructing a “strong” classifier as linear combination of “simple” “weak” classifier. Instead of resampling, Each training sample uses a weight to determine the probability of being selected for a training set. Final classification is based on weighted vote of weak classifiers. AdaBoost is sensitive to noisy data and outliers. However in some problems it can be less susceptible to the overfitting problem than most learning algorithms. Random forest (or random forests) The algorithm for inducing a random forest was developed by leo-braiman[25]. The term came from random decision forests that was first proposed by Tin Kam Ho of Bell Labs in 1995. It is an ensemble classifier that consists of many decision trees and outputs the class that is the mode of the class's output by
91
http://sites.google.com/site/ijcsis/ ISSN 1947-5500
(IJCSIS) International Journal of Computer Science and Information Security, Vol. 9, No. 7, July 2011
to say which model is best, we need to measure the confidence level of each and perform significance tests. VI.
PERFORMANCE MEASURES
Supervised Machine Learning (ML) has several ways of evaluating the performance of learning algorithms and the classifiers they produce. Measures of the quality of classification are built from a confusion matrix which records correctly and incorrectly recognized examples for each class. Table II presents a confusion matrix for binary classification, where TP are true positive, FP false positive, FN false negative, and TN true negative counts. Table II. Confusion matrix Predicted Label
Known Label
Positive
Negative
Positive
True Positive (TP)
False Negative (FN)
Negative
False Positive (FP)
True Negative (TN)
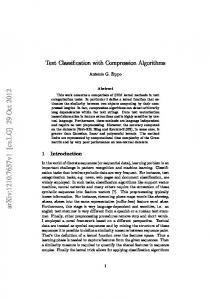
Figure.1 Comparison of average F-measure and ROC area
The different measures used with the confusion matrix are: True positive rate(TPR)/ Recall/ Sensitivity is the percentage of positive labeled instances that were predicted as positive given as TP / (TP + FN). False positive rate(FPR) is the percentage of negative labeled instances that were predicted as positive given as FP / (TN + FP).Precision is the percentage of positive predictions that are correct given as TP / (TP + FP).Specificity is the percentage of negative labeled instances that were predicted as negative given as TN / (TN + FP) .Accuracy is the percentage of predictions that are correct given as (TP + TN) / (TP + TN + FP + FN).F-measure is the Harmonic mean between precision and recall given as 2xRecallxPrecision/ Recall+Precision.
Figure.2 Comparing the prediction accuracy of all classifiers
Conclusions Tuberculosis is an important health concern as it is also associated with AIDS. Retrospective studies of tuberculosis suggest that active tuberculosis accelerates the progression of HIV infection. Recently, intelligent methods such as Artificial Neural Networks(ANN) have been intensively used for classification tasks. In this article we have proposed data mining approaches to classify tuberculosis using both basic and ensemble classifiers. Finally, two models for algorithm selection are proposed with great promise for performance improvement. Among the algorithms evaluated, SVM and Random Forest proved to be the best methods.
VII. RESULTS AND DISCUSSIONS Results show that certain algorithms demonstrate superior detection performance compared to others. Table III lists the evaluation measures used for various classification algorithms to predict the best accuracy. These measures will be the most important criteria for the classifier to consider as the best algorithm for the given category in bioinformatics. The prediction accuracy of SVM and C4.5 decision trees among single classifiers, Random Forest among ensemble are considered to be the best.
Acknowledgment Our thanks to KIMS Hospital, Bangalore for providing the valuable real Tuberculosis data and principal Dr. Sudharshan for giving permission to collect data from the Hospital.
Other measures such as F-measure and ROC area of above classifiers are graphically compared in figure 1. It displays the average F-measure and ROC area of both the classes. Prediction accuracy of these classifiers are shown in figure 2.
92
http://sites.google.com/site/ijcsis/ ISSN 1947-5500
(IJCSIS) International Journal of Computer Science and Information Security, Vol. 9, No. 7, July 2011
Table III. Performance comparison of various classifiers Classifier category
Classifier model
Various measures
Disease categories(class) PTB
RPTB
Basic Learning classifiers
SVM(SMO)
TPR/ Sensitivity
98.9%
99.6%
FPR
0.004
0.011
Specificity
99.6%
98.9%
Prediction Accuracy TPR/ Sensitivity
99.14% 99.1%
96.9%
FPR
0.03
0.008
Specificity
96.9%
99.1%
Prediction Accuracy TPR/ Sensitivity
98.4% 96.4%
96.5%
FPR
0.035
0.037
Specificity
96.5%
96.4%
Prediction Accuracy TPR/ Sensitivity
96.4% 98.5%
100%
FPR
0
0.015
Specificity
100%
98.5%
Prediction Accuracy TPR/ Sensitivity
99% 98.5%
99.6%
FPR
0.004
0.015
Specificity
99.6%
98.5%
Prediction Accuracy
98.85%
TPR/ Sensitivity
98.5%
100%
FPR
0
0.015
Specificity
100%
98.5%
Prediction Accuracy
99%
TPR/ Sensitivity
98.9%
99.6%
FPR
0.004
0.011
Specificity
99.6%
98.9%
Prediction Accuracy
99.14%
K-NN(IBK)
Naive Bayes
C4.5 Decision Trees(J48)
Ensemble classifiers
Bagging
Adaboost(AdaboostM1)
Random Forest
[3]
REFERENCES [1]
[2]
Orhan Er, Feyzullah Temurtas and A.C. Tantrikulu, “ Tuberculosis disease diagnosis using Artificial Neural Networks ”,Journal of Medical Systems, Springer, DOI 10.1007/s10916-008-9241-x online,2008. M. Sebban, I Mokrousov, N Rastogi and C Sola “ A data-mining approach to spacer oligo nucleotide typing of Mycobacterium tuberculosis” Bioinformatics, oxford university press, Vol 18, issue 2, pp 235-243. J. Clerk Maxwell, A Treatise on Electricity and Magnetism, 3rd ed., vol. 2. Oxford: Clarendon, 1892, pp.68–73,2002.
[4]
93
Rethabile Khutlang, Sriram Krishnan, Ronald Dendere, Andrew Whitelaw, Konstantinos Veropoulos, Genevieve Learmonth, and Tania S. Douglas, “Classification of Mycobacterium tuberculosis in Images of ZN-Stained Sputum Smears”, IEEE Transactions On Information Technology In Biomedicine, VOL. 14, NO. 4, JULY 2010. Sejong Yoon and Saejoon Kim, “ Mutual information-based SVM-RFE for diagnostic Classification of digitized mammograms”, Pattern Recognition Letters, Elsevier, volume 30, issue 16, pp 1489–1495, December 2009.
http://sites.google.com/site/ijcsis/ ISSN 1947-5500
(IJCSIS) International Journal of Computer Science and Information Security, Vol. 9, No. 7, July 2011 [5]
[6]
[7]
[8]
[9]
[10]
[11]
[12]
[13]
[14]
[15]
[16]
[17]
[18]
[19]
[20]
Nicandro Cruz-Ramırez , Hector-Gabriel Acosta-Mesa , Humberto Carrillo-Calvet and Rocıo-Erandi Barrientos-Martınez, “Discovering interobserver variability in the cytodiagnosis of breast cancer using decision trees and Bayesian networks” Applied Soft Computing, Elsevier, volume 9,issue 4,pp 1331–1342, September 2009. Liyang Wei, Yongyi Yanga and Robert M Nishikawa, “Microcalcification classification assisted by content-based image retrieval for breast cancer diagnosis” Pattern Recognition , Elsevier, volume 42,issue 6, pp 1126 – 1132, june 2009. Abdelghani Bellaachia and Erhan Guven, “ Predicting breast cancer survivability using Data Mining Techniques” Artificial Intelligence in Medicine, Elsevier, Volume 34, Issue 2, pp 113-127, june 2005. Maria-Luiza Antonie, Osmar R Zaıane and Alexandru Coman, “Application of data mining techniques for medical image classification” In Proceedings of Second International Workshop on Multimedia Data Mining (MDM/KDD’2001) in conjunction with Seventh ACM SIGKDD, pp 94-101,2000. Celia C Bojarczuk, Heitor S Lopes and Alex A Freitas, “ Data Mining with Constrained-Syntax Genetic Programming: Applications in Medical Data Set” Artificial Intelligence in Medicine, Elsevier, volume 30, issue 1, pp. 27-48,2004. Kwokleung Chan, Te-Won Lee, Associate Member, IEEE, Pamela A. Sample, Michael H. Goldbaum, Robert N. Weinreb, and Terrence J. Sejnowski, Fellow, IEEE ,“Comparison of Machine Learning and Traditional Classifiers in Glaucoma Diagnosis”, IEEE Transactions On Biomedical Engineering, volume 49, NO. 9, September 2002. Yasser M. Kadah, Aly A. Farag, Member, IEEE, Jacek M. Zurada, Fellow, IEEE,Ahmed M. Badawi, and Abou-Bakr M. Youssef, “Classification algorithms for Quantitative Tissue Characterization of diffuse liver disease from ultrasound images”, IEEE Transactions On Medical Imaging, volume 15, NO. 4, August 1996. Minou Rabiei and Ritu Gupta, “Excess Water Production Diagnosis in Oil Fields using Ensemble Classifiers”, in proc. of International Conference on Computational Intelligence and Software Engineering , IEEE,pages:1-4,2009. Hongqi Li, Haifeng Guo, Haimin Guo and Zhaoxu Meng, “ Data Mining Techniques for Complex Formation Evaluation in Petroleum Exploration and Production: A Comparison of Feature Selection and Classification Methods” in proc. 2008 IEEE Pacific-Asia Workshop on Computational Intelligence and Industrial Application ,volume 01 Pages: 37-43,2008. Seppo Puuronen, Vagan Terziyan and Alexander Logvinovsky, “Mining several data bases with an Ensemble of classifiers” in proc. 10th International Conference on Database and Expert Systems Applications, Vol.1677 , pp: 882 – 891, 1999. Tzung-I Tang,Gang Zheng ,Yalou Huang and Guangfu Shu, “A comparative study of medical data classification methods based on Decision Tree and System Reconstruction Analysis” IEMS ,Vol. 4, issue 1, pp. 102-108, June 2005. Tsirogiannis, G.L. Frossyniotis, D. Stoitsis, J. Golemati S. Stafylopatis and A. Nikita, K.S, “Classification of medical data with a robust multi-level combination scheme” in proc. 2004 IEEE International Joint Conference on Neural Networks, volume 3, pp 24832487, 25-29 July 2004. R.E. Abdel-Aal, “Improved classification of medical data using abductive network committees trained on different feature subsets” Computer Methods and Programs in Biomedicine, volume 80, Issue 2, pp. 141-153, 2005. Kemal polat,Sebnem Yosunkaya and Salih Guines, “Comparison of different classifier algorithms on the Automated Detection of Obstructive Sleep Apnea Syndrome”, Journal of Medical Systems,volume 32 ,Issue 3, pp. 9129-9, June 2008. Ranjit Abraham, Jay B.Simha and Iyengar S.S “Medical datamining with a new algorithm for Feature Selection and Naïve Bayesian classifier” proceedings of 10th International Conference on Information Technology, IEEE, pp.44-49,2007. HIV Sentinel Surveillance and HIV Estimation, 2006. New Delhi, India: National AIDS Control Organization, Ministry of Health and Family Welfare, Government of India.
[21] [22]
[23]
[24]
[25] [26] [27] [28]
http://www.nacoonline.org/Quick_Links/HIV_Data/ Accessed 06 February, 2008. J.R. Quinlan, “Induction of Decision Trees” Machine Learning 1, Kluwer Academic Publishers, Boston, pp 81-106, 1986. Thomas M. Cover and Peter E. Hart, "Nearest neighbor pattern classification," IEEE Transactions on Information Theory, volume. 13, issue 1, pp. 21-27,1967. Rish and Irina, “An empirical study of the naïve Bayes classifier”, IJCAI 2001, workshop on empirical methods in artificial intelligence, 2001(available online). R. J. Quinlan, "Bagging, boosting, and c4.5," in AAAI/IAAI: Proceedings of the 13th National Conference on Artificial Intelligence and 8th Innovative Applications of Artificial Intelligence Conference. Portland, Oregon, AAAI Press / The MIT Press, Vol. 1, pp.725-730,1996. Breiman, Leo, "Random Forests". Machine Learning 45 (1): 5– 32.,Doi:10.1023/A:1010933404324,2001. Weka – Data Mining Machine Learning Software, http://www.cs.waikato.ac.nz/ml/. J. Han and M. Kamber, Data mining: concepts and techniques: Morgan Kaufmann Publishers, 2006. I. H. Witten and E. Frank, Data Mining: Practical Machine Learning Tools and Techniques, Second Edition: Morgan Kaufmann Publishers, 2005.
AUTHORS PROFILE Mrs.Asha.T obtained her Bachelors and Masters in Engg., from Bangalore University, Karnataka, India. She is pursuing her research leading to Ph.D in Visveswaraya Technological University under the guidance of Dr. S. Natarajan and Dr. K.N.B. Murthy. She has over 16 years of teaching experience and currently working as Assistant professor in the Dept. of Information Science & Engg., B.I.T. Karnataka, India. Her Research interests are in Data Mining, Medical Applications, Pattern Recognition, and Artificial Intelligence. Dr S.Natarajan holds Ph. D (Remote Sensing) from JNTU Hyderabad India. His experience spans 33 years in R&D and 10 years in Teaching. He worked in Defence Research and Development Laboratory (DRDL), Hyderabad, India for Five years and later worked for Twenty Eight years in National Remote Sensing Agency, Hyderabad, India. He has over 50 publications in peer reviewed Conferences and Journals His areas of interest are Soft Computing, Data Mining and Geographical Information System. Dr. K. N. B. Murthy holds Bachelors in Engineering from University of Mysore, Masters from IISc, Bangalore and Ph.D. from IIT, Chennai India. He has over 30 years of experience in Teaching, Training, Industry, Administration, and Research. He has authored over 60 papers in national, international journals and conferences, peer reviewer to journal and conference papers of national & international repute and has authored book. He is the member of several academic committees Executive Council, Academic Senate, University Publication Committee, BOE & BOS, Local Inquiry Committee of VTU, Governing Body Member of BITES, Founding Member of Creativity and Innovation Platform of Karnataka. Currently he is the Principal & Director of P.E.S. Institute of Technology, Bangalore India. His research interest includes Parallel Computing, Computer Networks and Artificial Intelligence.
94
http://sites.google.com/site/ijcsis/ ISSN 1947-5500