identifiers (e.g., identifiers that include relevant domain knowledge) how should they go about it? For example, do the initials of a concept name provide enough ...
Effective Identifier Names for Comprehension and Memory Dawn Lawrie, Christopher Morrell, Henry Feild, David Binkley
Abstract Readers of programs have two main sources of domain information: identifier names and comments. When functions are uncommented, as many are, comprehension is almost exclusively dependent on the identifier names. Assuming that writers of programs want to create quality identifiers (e.g., identifiers that include relevant domain knowledge) how should they go about it? For example, do the initials of a concept name provide enough information to represent the concept? If not, and a longer identifier is needed, is an abbreviation satisfactory or does the concept need to be captured in an identifier that includes full words? What is the effect of longer identifiers on limited short term memory capacity? Results from a study designed to investigate these questions are reported. The study involved over 100 programmers who were asked to describe twelve different functions and then recall identifiers that appeared in each function. The functions used three different ‘levels’ of identifiers: single letters, abbreviations, and full words. Responses allow the extent of comprehension associated with the different levels to be studied along with their impact on memory. The functions used in the study include standard computer science text-book algorithms and functions extracted from production code. The results show that full-word identifiers lead to the best comprehension; however, in many cases, there is no statistical difference between using full words and abbreviations. When considered in the light of limited human short-term memory, well chosen abbreviations may be preferable in some situations since identifiers with fewer syllables are easier to remember. Keywords Program Comprehension, Software Quality, Quality Assessment D. Lawrie Computer Science Department, Loyola College, 4501 N. Charles St., Baltimore, MD 21210-2699, USA C. Morrell Loyola College H. Feild Loyola College D. Binkley Loyola College
1 Introduction Conventional wisdom says that choosing meaningful identifier names improves code quality and thus the ability of future engineers to manipulate the code [9]. Quality is important to all software engineering projects as it effects the bottom line: lower quality leads to higher costs [16]. Quality is particularly important in safety critical applications where the ‘cost’ of a failure is considerably higher. Software quality is impacted by program features such as code structure and identifier naming. Of particular interest herein is the key role that identifier naming plays in code quality. Further motivation for studying identifiers comes from a number of prior studies. For example, Rilling and Klemola observe “In computer programs, identifiers represent defined concepts”[15], while Caprile and Tonella point out that “Identifier names are one of the most important sources of information about program entities”[5]. Another motivation for studying identifiers comes from Deissenb¨ock and Pizka who note that “research on the cognitive processes of language and text understanding shows that it is the semantics inherent to words that determine the comprehension process”[7]. Finally, Takang et al. note “The quality of identifier names is an issue that merits closer consideration and exploration in its own right”[19]. As a relatively young field, computer science is still guided by a collection of commonly held, but often unsubstantiated, beliefs. Through empirical study one can ascertain the veracity of such beliefs. This paper reports on a study aimed at better understand the effect of identifier makeup on a programmer’s ability to manipulate code. For example, the ability to comprehend source code or the ability to recall particular identifiers. One hundred twenty-eight participants took part in the study. The number and variety of participants make this study unique. Furthermore, there is sufficient diversity in the subject population to allow the results to broadly explain the impact that identifier construction choices have. The study confirms the belief that identifiers made up of well formed abbreviations and full words lead to higher quality software; however, excessively long identifiers overload short term memory, negatively impacting program comprehension. Thus, a balance between information content and recall ability must be struck. This sug-
2
gests careful evaluation of identifier naming conventions. For example, identifier prefixes potentially improve comprehension by providing ancillary information about the identifier. However, they also make the identifier longer and thus have the disadvantage of contributing to the overcrowding of short-term memory. The paper makes three primary contributions. First, it presents data from a empirical study that involves a considerably larger and more diverse selection of programmers than similar past studies. Second, the paper interprets the results of statistical models describing the collected data using five hypotheses. The two most important of these relate to the impact of identifier quality on programmer comprehension and to programmer recall ability. Finally, combining the two results, the paper discusses their impact on variable naming in programming. For example, the results can be used to inform naming convention choices. The remainder of the paper first presents a description of the experimental setup in Section 2, followed by necessary background information in Section 3. This is followed by a discussion of the results and then related work in Sections 4 and 5. Finally, Section 6 summarizes the paper and suggests some places for future work.
2 Experimental Design This section presents the experimental design. It first provides an overview of the study’s five hypotheses and then describes the process used to select and prepare the source code for the study. Next, the experiential setup and potential threats to the validity of the experiment are considered. The final two subsections summarize subject demographics, and finally, the process of readying the data for analysis.
2.1 Overview Two primary hypotheses are studied: (1) Full natural-language identifiers and well-constructed abbreviations lead to better source code comprehension than less informative identifiers. (2) Full natural-language identifiers and well-constructed abbreviations lead to better programmer recall than less informative identifiers. Three additional hypotheses are also investigated: (3) Increased work experience and schooling lead to a better ability to comprehend source code. (4) In support of related studies [14], gender plays a role in confidence but not comprehension. (5) Shorter meaningful identifiers are easier to remember than longer meaningful identifiers. To investigate these hypotheses a two part study was conducted. The first part is aimed at ascertaining the effect
of identifier quality on comprehension. It investigates the impact of three levels of identifier quality: full words, abbreviations, and single letters. The second part of the study considers the ability of an engineer to recall identifiers and thus investigates the impact of memory and recall on program comprehension [8].
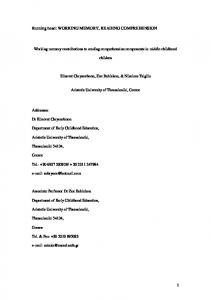
2.2 Source Code Preparation The first step in constructing the study was to select and then prepare twelve functions. Two kinds of functions were determined to be of interest: algorithms and snippets. Algorithms, taken from text books and course lecture notes, include functions such as binary search and quicksort. Snippets, taken from production code available from the world wide web, include functions for finding the best move in the game go and summing all the debits in an account. The initial search revealed about fifty candidate functions. From these, six algorithms and six snippets where chosen for inclusion in the study. The selection was based on features of the code. For example, the selected functions ranged in size from eight to thirty-six lines of code. Since the focus of the study is on identifiers, comments were omitted from the code the subjects viewed. All information about the purpose of the code came from its structure and its identifiers. The next task was to create the three variants of each function: full-word, single-letter, and abbreviation. The variants differed only in the quality of the identifiers used. First, the full (English) word variant of each function was constructed. The identifier names came from the original programmers if the code had been written with full-word identifiers or were chosen by the authors to be particularly meaningful. Then, the single-letter variants were created by selecting the first letter of each word in each full-word identifier. Finally, the abbreviation variants were created based on the full-word variants. Most of the identifiers had common abbreviations (e.g., count → cnt, length → len). Ten of the 63 identifiers (e.g., current board, target, and credit) had no conventional abbreviation (as known to the authors). In these cases a professional programmer unrelated to the experiment was asked to abbreviate the ten identifiers. Five of the ten were the same abbreviations as the authors proposed, three contained less information (e.g., most frequent letter was abbreviated mfl rather than mfreqlet), and two had minor differences (scores was abbreviated as scrs rather than scs and credit was abbreviated cdt rather than cred. To avoid experimenter bias, the professional programmer’s abbreviation were used in cases of disagreement. To illustrate the difference in the variants, Figure 1 shows the three variants of the algorithm Sieve of Eratosthenes. The top function is the single-letter variant. It is expected that comprehension using this variant will
3 Single Letter Variant void fXX(bool pn[ ], int l) { int i, f, p; pn[0] = false; pn[1] = false; for (i = 2; i < l; i++) pn[i] = true;
}
for (p = 2; p < l; p++) if (pn[p]) for (f = p; f * p < l; f++) pn[f * p] = false; Abbreviated Variant
void fXX(bool isPriNum[ ], int len) { int idx, fac, pri; isPriNum[0] = false; isPriNum[1] = false; for (idx = 2; idx < len; idx++) isPriNum[idx] = true;
}
for (pri = 2; pri < len; pri++) if (isPriNum[pri]) for (fac = pri; fac * pri < len; fac++) isPriNum[fac * pri] = false; Full Word Variant
void fXX(bool isPrimeNumber[ ], int length) { int index, factor, prime; isPrimeNumber[0] = false; isPrimeNumber[1] = false; for (index = 2; index < length; index++) isPrimeNumber[index] = true; for (prime = 2; prime < length; prime++) if (isPrimeNumber[prime]) for (factor = prime; factor * prime < length; factor++) isPrimeNumber[factor * prime] = false;
}
Fig. 1. The three variants of the algorithm Sieve of Eratosthenes, which finds prime numbers.
be worse than the other variants. The middle function includes abbreviated identifiers (e.g., isPriNum). Finally, the bottom function uses full-word identifiers (e.g., isPrimeNumber).
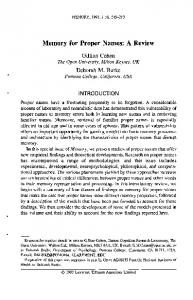
2.3 Experimental Setup This section describes the user interface used to conduct the study. There are three main phases in the interface: first, the collection of demographic information; second, the presentation of and questions concerning the twelve functions; and third, a solicitation of comments from participants. The implementation of the GUI and the different phases are discussed in detail below. The experiment was setup to be conducted over the web and thus allow a geographically diverse group of subjects to take part. A Java applet was used as the user interface to control the viewing of the source code (e.g., to prevent subjects from making use of their browser’s ‘back’ button to view the code multiple times). In addition, an applet simplifies the collection of timing data. Subjects began with the demographics page, which collected their years of computer science schooling, years of computer science related work experience, the title of the last computer science position held, age, and gender. In addition, because the study involved reading code written in the programming languages C, C++, and Java, each subject was asked to provide their comfort level with each language on a scale of 1 to 5. The middle part of the experiment involved showing the twelve functions. Three screens were used for each function. Based on previous memory-based experiments, the order of these screens is important [8]: the first shows the subject the treatment, which is followed by a “memory clearing” activity, and then finally the recall activity. In this experiment, the first screen displayed one of the three variants of the source code. Participants were asked to spend one to two minutes reading the code and not to write anything down regarding the code. The second screen, shown on the left of Figure 2, had two purposes. First, it served as the memory clearing activity. Second, it provided two pieces of information used in the comprehension part of the study. It asked subjects to provide a free-form written description of the purpose of the function and to rate their confidence in their description. (In a few cases the confidence rating was misinterpreted. Participants wrote “I don’t know” as the description but gave a confidence of 5, indicating they were very sure they did not know what the code did; however, most treated confidence as intended.) The description provides a qualitative measure of comprehension without leading the subject toward potential answers, while the confidence rating provides a quantitative measure of the subject’s understanding. Motivation for including both is found in the following observation of Takang et al.: “the subjective nature of ‘quality’ suggests that the quantitative studies, which characterize this area, are less appropriate than studies focusing on qualitative measures”[19]. Finally, the third screen, shown on the right of Figure 2, presented the recall activity. It listed six possible identifiers. Subjects were asked to select those identifiers that
4
they recalled appearing on the first screen. The actual number of identifiers from the source varied from one to four, but was held constant for a given function no matter which variant the subject saw. Thus, the list of identifiers was dependent on both the function and the variant viewed by the subject. For each list, there was at least one wrong answer of the correct variant. Other wrong answers included variables used in other variants and names associated with the domain of the function. To ensure that each participant saw an even distribution of the three different variants in a balanced fashion and to ensure that, for each question, each variant was seen by a similar number of participants, the sequence of variants shown was randomly taken from three possible sequences created using Latin Squares. From the data collected, the actual number of responses for each variant was 357, 364, and 366, which indicates that good balance was achieved. The final screen, seen only by subjects who completed all twelve questions, provides space for free-form comments. Participants volunteered such information as their opinion of particular questions, their frustration with the choice of identifier names, and the amount of time that has passed since they last had to read code. One subject remarked, “Nice survey. Programs are indeed inherently unintelligible especially for the unexperienced eye.” Another subject wrote, “It made a difference if I studied the variables in addition to the code fragment. Most times I only studied the code – a few I reviewed the variables and that increased my confidence in naming the ones present.”
2.4 Threats to Validity In any empirical study, it is important to consider threats to validity (i.e., the degree to which the experiment measures what it claims to measure). There are four types of validity relevant to this research: external validity, internal validity, construct validity, and statistical conclusion validity. External validity, sometimes referred to as selection validity, is the degree to which the findings can be generalized to other organizations or settings. In this experiment, selection bias is possible as the selected functions and participants may not be representative of those in general; thus, results from the experiment may not apply in the general case. Careful selection of the functions mitigates the impact of this bias in terms of the functions used in the study. Given the demographic data, the subjects seem fairly representative of the computer science community at large. Second, three threats to internal validity, the degree to which conclusions can be drawn about the causal effect of the explanatory variable on the response variable, are considered. First, statistical associations do not imply causation; though, given the experimental setup, one should be able to infer that differences between the question variants are due to the different types of identifiers. Second,
attrition effects occur with the loss of participants during the treatment. There are several reasons an individual may have discontinued participation in the study; however, no evidence that the loss is systematically associated with experiential conditions was suggested. Third, learning effects occur where exposure to early questions have an effect on responses to later questions. No evidence of this was found in the participants responses. Finally, other potential threats to internal validity, for example, history effects and subject maturation [2] are non-issues given the short duration of the experiment. Construct validity assesses the degree to which the variables used in the study accurately measure the concepts they purport to measure. As human assessment of quality is rather subjective, it is possible that some other aspect of the code affected participants’ responses. The parallels between the models for the description rating and confidence suggest that this is not a serious concern. Finally, a threat to statistical conclusion validity arises when inappropriate statistical tests are used or when violations of statistical assumptions occur. The models applied are appropriate for analyzing unbalanced, repeatedmeasures data, so that the conclusions drawn from the statistics should be valid.
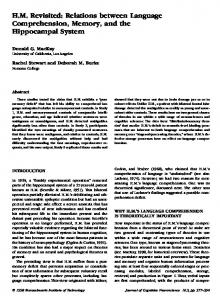
2.5 Subject Demographics This section summarizes demographic data on the study’s subjects. These include current students and alumni of several colleges and those reached via email sent to various professional groups. In all, 192 people started the survey. Of these 64 filled in only the demographic information. Thus, 128 participants answered at least one question. Eighty of these completed all twelve questions. Participants ranged from students (about 25 percent) to professionals with over forty years of experience. The average age of the participants was 30 years with a standard deviation of 11. The average number of years worked was 7.5 with a standard deviation of 8.8. Ten percent of the participants were female. Finally, the average comfort subjects reported for C, C++, and Java on a scale of 1 to 5, were 3.3, 3.4, and 3.6, respectively. All studies concerning human subjects must consider drop-outs – subjects who do not complete the study. The drop-out rate for this study, depicted in Figure 3, reports the number of participants that stopped after each question. Eighty of the 128 participants or 62.5%, answered all twelve questions. As seen in the figure, all but one drop out occurred during the first half of the study. It is likely that fatigue played a part in dropping out. One subject commented on fatigue multiple times when describing the purpose of the functions. Other factors that may have lead to dropping out include the unexpected difficulty and the amount of time required to complete the study.
5
Fig. 2. Screen shots from the data collection applet. The left image shows the second screen where subjects entered a free-form description and rated their confidence in their understanding. The right image shows the third screen where subjects selected the identifiers they thought appeared in the code.
Fig. 3. The drop-out rate – the number of participants that left the study after completing a particular question.
2.6 Data Preparation The data preparation involved three primary steps. First, two non-numeric values from the demographic information were replaced by approximate numeric values. These two were the age ‘40+’, which was replaced by 45 and the age ‘old’ which was replaced by 60. Both replacements were based on the profession and the number of years of work experience. Second, the data associated with times that seemed unusually short or long were examined. Most of the extremely short times (less than 10 milli-seconds) came from problems in the interface. In these cases, which numbered 5, the entire question was discarded for that particular subject. Considering short times also uncovered two subjects who quit the study and then re-started it at a later time. Since they closed their browser, they began with the first question again and thus could answer some questions without first analyzing the code. In these cases, the second re-
sponses to the questions were discarded and the remaining responses were merged into a single record. Long times were observed on all screens and appeared to indicate some kind of distraction occurring (e.g., one subject reported that a phone call had been taken). Since these times would adversely effect the statistics, such outliers were treated as missing data, which is common in similar studies. The statistical analysis can readily handle this missing data. In addition to cleaning the data, the free-form descriptions were evaluated. Two of the authors independently evaluated the correctness of each response on a 0 to 5 scale with the following interpretations for each number: 5 4 3 2 1 0
correct mostly correct half right mostly incorrect incorrect omitted an answer or reported a problem with viewing the code
For some functions, further directions were agreed on such as for the binary search algorithm a description was given a 4 if the word “binary” was omitted from a description that was otherwise correct. In total, 1087 responses were evaluated in random order to avoid any bias by variant. There was direct agreement between the raters on 78% of the responses. In the remaining cases, the average rating was used. To obtain a statistical measure of overall agreement between the two raters, a κ-statistic was computed. The result of 0.71 indicates substantial agreement [10]. Finally, the responses to the third screen were analyzed. The value extracted for use in the subsequent analysis was the percent of correct answers for identifiers that appeared in the code (hereafter referred to as percent correct in
6
source, PCIS). Using a proportion rather than the actual count facilitates comparing questions as the number of correct answers varies by question. It also better supports the evaluation of subject recall ability. Analysis of wrong answers is also interesting as it supports the understanding of the conditions that lead to mistakes. Such an analysis is also conducted.
3 Background This section provides some background related to the memory aspects of the study and describes the statistical tests used to analyze the data collected.
3.1 Memory The memory portion of the study was inspired by the work of Jones who investigated the consequences of limited capacity short-term memory on subjects performance in tasks related to the comprehension of short sequences of code [8]. The study presented herein includes a similar focus on the recall of identifiers; however, there are two significant differences between the experimental setup of the two studies. First, “real world” code was used in this study rather than a sequence of assignment statements. Second, the identifiers in this study were inspired by the task, whereas the identifiers in the Jones study, which were comprised of an arbitrary grouping of words, were focused on investigating memory needs. For example, in this study, participants saw the identifiers moves, currentBoard, result, bestScore, and currentScore. In the Jones study, groupings were chosen based on syllable count (a proxy for their memory demand). As an example, participants saw the three syllable identifiers prevented, liberation, and conception. From a memory perspective, the key difference between the two is that task-inspired identifiers allow for possible ties to long-term memory. Thus, in this study participants could rely on their understanding and recall of the code’s purpose in addition to their ability to recall the actual identifiers. In contrast, the Jones study participants had no additional information apart from their memory. Although this makes the results of the Jones study easier to interpret, they are also more distant from the program comprehension process. Together these two studies compliment each other and provide a better picture of the influence that identifier construction and memory requirements have on comprehension.
3.2 Statistics As the data includes repeated-measures and missing values (e.g., due to participant drop out) linear mixed-effects regression models were used to analyze the data [20]. Such models easily accommodate unbalanced
data, and, consequently, are ideal for this analysis. These statistical models allow the identification and examination of important explanatory variables associated with a given response variable. The construction of a linear mixed-effects regression model starts with a collection of explanatory variables and a number of interaction terms. The interaction terms allow the effects of one explanatory variable to differ depending upon the value of another explanatory variable. For example, if confidence interacts with gender in a model where rating is the response variable, then the effect of confidence on rating depends on gender (i.e., is different for men and women). Backward elimination of statistically non-significant terms (p > 0.05) yields the final model. Note that some non-significant variables and interactions are retained to preserve a hierarchically well-formulated model [13]. Therefore, individual p-values for terms participating in an interaction are not reported. When interpreting the mixed-effects models described in the next section, graphs are often used to illustrate significant effects in the model. However, when the models have more than two explanatory variables (which most do) it is not pragmatic to graph all the variables. Thus, when plots are constructed, variables not being discussed are set to their variant-specific means or, in the case of categorical variables, a representative value. In addition to linear mixed-effects regression, when a basic comparison of distributions without considering explanatory variables is needed, Friedman’s test is used. This test is often used as an alternative to the parametric repeated measures ANOVA where the assumption of normality is not acceptable. The test is used to detect differences in treatments across multiple test attempts. The procedure involves ranking each block together, then considering the values of ranks by columns. The study requires many instances of multiple comparisons. For instance, when comparing three variants and twelve questions, thirty-six comparisons are made. Computing a standard t-value for each comparison and then using the standard critical value increases the overall probability of a type I error. Thus, Bonferroni’s correction is made to the p-values to correct for multiple testing. In essence each p-value is multiplied by the number of comparisons and the adjusted p-value is compared to the standard significance level (0.05) to determine significance.
4 Experimental Results This section first formalizes the studies five hypotheses. Statistical analysis of the data collected is then used to build mixed effects regression models for description ratings, confidence, and percent correct in source (PCIS). An analysis of wrong answers recalled is presented in Section 4.5. Finally, in Section 4.6, results from the analysis
7
of these models is used to accept or reject each of the five hypotheses. The five hypotheses consider comprehension, memory, experience and education, gender, and identifier length, and are formalized as follows. Comprehension Hypothesis H0 : There is no difference in comprehension among different identifier variants. Ha : Full word identifiers and abbreviations lead to better source code comprehension. Memory Hypothesis H0 : The ability to recall an identifier is the same for all variants. Ha : It is easier to recall abbreviations and full words than identifiers of the single-letter variant. Experience and Education Hypothesis H0 : Work experience and schooling have no impact on comprehension. Ha : Increased work experience and schooling lead to a better ability to comprehend source code. Gender Hypotheses H01 : Gender plays no role in confidence. Ha1 : Gender plays a role in confidence. H02 : Gender plays no role in ability to describe code. Ha2 : Gender plays a role in ability to describe code. Identifier Length Hypothesis H0 : The length of meaningful identifiers has no impact on memory. Ha : Longer meaningful identifiers are harder to remember than shorter ones.
4.1 Initial Comparison The statistical analysis begins with an initial simple comparison of means for each variant for each of the three response variables: description ratings, confidence, and PCIS. Subsequently, mixed effects regression models are considered. The averages for each variant are shown in Table 1. The analysis was conducted in two (equivalent) ways. First, a mixed-effects model was fit with only variant as a factor. Least squares means are used to perform pairwise comparisons of the three variants with a Bonferroni correction. Second, a two way randomized block design was used with subject as a random factor. This is the simplest repeated measures analysis. Bonferroni multiple comparisons of the three means were conducted.
Description Rating Confidence PCIS
single letter 3.10 3.07 0.72
Variant abbreviation 3.72 3.55 0.81
full word 3.91 3.68 0.81
pvalue