Effective Information for Managers: Using Multi-Dimensional Data Structures to support Research Management Helen Hasan Department of Business Systems The University of Wollongong Wollongong, Australia
[email protected] Abstract If an organisation is to achieve its goals in the current “Information Age”, the work of managers must be supported by high quality information. Systems that process organisational performance data into managerial information commonly have either dimensional or relational data structures. This paper reports the findings of a study of information support for university research managers and describes the informational view afforded by the dimensional structure of data in contrast to the more common relational one. Subsequent discussion raises broader issues concerned with the effectiveness of multidimensional forms of information in supporting managerial work and the specific difficulties of applying these to the problem of research management. Keywords Multi-dimensional database, relational database, research management, information support.
INTRODUCTION The design of computer-based systems, to support decision making, has relied on the notion that information of good quality, both in content and presentation, is essential for good decisions (McCosh & Scott-Morton 1978, Newell & Simon 1972). Our research into the work of senior managers (Hasan & Gould 1994, 1995, 1996, Hasan 1999), has confirmed the generally held view that their decision making processes are messy (Wagner 1995) and unstructured (Mintzberg 1989), and unsuited to support by conventional information systems. There is therefore a need to separate the day-to-day activities of production applications, using on-line transaction processing (OLTP), from processes of reporting and analysis required by managers, known as on-line analytic processing (OLAP). It has become evident that the process of management decision making is better supported by information arranged by subject rather than by operational applications (Baum 1996). While the suitability of relational data structures for operational OLTP systems has been widely researched, it is less clear what are the most appropriate data structures for subject-oriented OLAP systems. A critical appraisal of their effectiveness is more difficult as these types of systems usually support the messy and unstructured work of senior managers. The increasing demand by managers for business performance information, and organisational knowledge, is of continued concern to IS professionals. Over the past three decades, attempts have been made to satisfy this demand with management information systems (MIS), decision support systems (DSS), executive information systems (EIS) and data warehouses (DW). The core of most MIS and DSS are relational databases, tied to operational applications, whereas EIS and DW are often based on multidimensional data, concerned with subjects of interest to managers. The emphasis of most EIS research has been on the functionality and data-handling capability of such systems, not necessarily on their
Proc. 10th Australasian Conference on Information Systems, 1999
364
effectiveness in supporting the decision-making work of managers. This paper focuses on the latter and explores the effectiveness of dimensional data structures in providing information support for management decision making, with particular reference to a study of research performance information in universities. This study highlights the importance not only of making the right technical decisions in the design of EIS, but also of clarifying policy issues concerning their information content, particularly in regard to performance indicators.
DATA STRUCTURES The relational data model uses a two dimensional structure of rows and columns to store data in tables of records corresponding to real world entities. A relational database consists of a set of related tables, which are linked together by common key values. The relational model was first proposed by E. F. Codd (of IBM) in 1970 and its conceptual simplicity, set the stage for a genuine database revolution. At the time Codd’s work was considered ingenious but impractical as the model’s conceptual simplicity was bought at the expense of computer overheads. In the 1980s the power of computers had grown to the point where these overheads were no longer a problem and today relational database management systems (DBMS) are available on the desktop, as well as large organisational machines and have become popular with both IS practitioners and end-users. Relational data modeling represented a major break through for both designers and users, as its human-oriented tabular form was considered to be much more attuned to the way people view data. The techniques of entity-relationship (ER) modeling and the structuring of data in normalised tables have become the standard for trained database professionals who routinely use relational DBMS to store large volumes of organisational transaction data. However it is questionable whether the use of tables to provide organisational information is indeed peoplefriendly and an ideal approach for managerial end-users. For anything but relatively simple queries, accessing information from relational databases requires complex joins of many tables and is distinctly non-trivial for end users, who must call on IS professional to frame queries in a particular syntax, such as SQL. In addition large relational databases, designed to support transaction-processing applications, are often difficult to browse by subjects that interest senior managers.
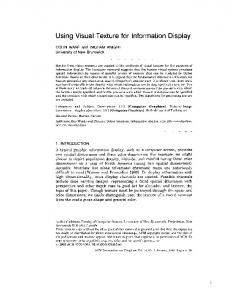
Figure 1 A typical 3D Cube
365
In multidimensional databases (MDDB), data is stored in such a way as to be represented to the user as a hypercube or multi-dimensional array, where each core data value or fact occupies a cell indexed by a unique set of dimension values. In its simplest form this is easily visualised using a fact, such as number of products sold, along the three most common dimensions (time, location, product type), as shown in Figure 1, but can be extended to include any number of facts and dimensions. The last decade has seen massive advances in technology such that it became feasible for organisations to built massive data-ware-houses, based on multidimentional data models. Powerful OLAP systems have been developed to enable end-user access to organisational performance information stored in MDDB with friendly graphical user interfaces (GUI). While the slice and dice, and drill down capability of these systems have enabled managers to view their data in a new light, most interest has been on the issues involved in developing the technology, on its performance in handing gigabytes of data and its ability to integrate with client-server arrangements. Most of the literature on MDDB is in the form of white papers from OLAP vendors (for example Creeth & Pendse1995, Gentia 1997). Very little literature directly addresses the concept of dimensional data modeling in the same way that relational data modeling has been treated in the literature and in textbooks. From the literature it appears that there are two common approaches to the development of MDDB, one top-down and the other bottom up. A top-down approach focuses on the business problem, and is based on the EIS literature including the work of Rockart and De Long (1988), Burkan (1991), Volonino and Watson(1992) and Barrow (1992). They describe EIS development as starting with the identification of an executive champion or sponsor and then determining the Critical Success Factors and Key Performance Indicators, either of individuals or of the corporation, to establish the initial requirements of the EIS. A multi-disciplinary EIS team is set up and an evolutionary prototyping method is used to continue the development process. A bottom up approach to MDDB development begins with an analysis of data in the existing organisational database to identify facts and dimensions that relate to a subject of interest (Kimball 1997, Pokorny 1998). When, as is usually the case, the underlying databases are relational, this approach involves the identification of two kinds of tables: the Fact Table which consists of the numerical measurements that exist within the database and Dimension Tables which are more descriptive data items that map to the natural dimensions within the business. The Fact Table is made up of multi-part keys that link back to the Dimension Tables giving a layout referred to as a star or snowflake schema (Weldon 1995). To successfully translate data from a relational database into a meaningful MDDB it is necessary to identify the star schema within the relational model related to subjects of interest to the business analysts. The translation process is essentially one of de-normalisation, and hence simplification. Once the Fact and Dimension tables are identified the translation of data should in principle be capable of automation. However the integration of a MDDB datawarehouse or EIS with underlying operational databases is rarely easy, mainly due to data complexities, anomalies and errors. This is usually referred to as the “dirty data” problem. Database research has comprehensively covered the concepts of relational modeling on the one hand and the complexities of MDDB/OLAP engines and star schema on the other but has not told us much about the end-user effectiveness that either the relational or dimensional data structures have in informing managerial decision making. The following study addresses this issue by examining the supply of research output information to research managers in a university setting.
366
THE STUDY Research Aims and Methodology As stated in the Introduction, the objective of this work is to explore and contrast the effectiveness of the relational and dimensional data structures in providing information to support the decision-making work of managers. To this end a study was conducted of the provision of research performance information to managers in a university. The study was concerned with the use of IT in collecting, analysing and displaying research performance information and how this helped managers with their processes of quality assurance in research. The study used an action research approach where the existing form of information management using queries and reports from relational databases was augmented by a prototype multidimensional OLAP system containing three years of research output data. Some background research was undertaken to determine the requirements for the prototype. This covered the investigation made by several committees of the federal government on research performance indicators and measures. It also covered an investigation of issues concerned with research management, objectives and strategies. To this end interviews were conducted with the university’s research office and Centre for Research Policy to gain an understanding of the work of research managers. The result of this background research is summarised in the following sections of the paper and used to determine the measures and dimensions for the MDDB prototype. It should be noted that this is a relatively small data set when compared with most MDDB implementations. The prototype was then implemented in Gentia 1 as will be demonstrated later in the paper. A group of university research managers were given access to the multidimensional prototype in addition to the existing relational system and then interviewed on the effectiveness of both systems. The managers interviewed included representatives from the executive, from the faculty and research institute level and group level to determine their understanding of the informational structure, the usefulness of the system for research management (planning and evaluation) and to elicit other issues surrounding the provision of information support for managers. Within the qualitative research domain there are a number of approaches to the analysis of interview data. I will follow that of the interpretive, phenomenologists as defined by Miles and Huberman (1994 p8). In this interpretive approach, human activity is seen as text, ie “a collection of symbols with layers of meaning to be interpreted” and this “text” is collected as organisational documents, transcripts of interview and notes from observations. Phenomenologists work with text but are dubious about condensing it, not using any formal coding, but assume that continual reading reviewing of the source material one can “capture the essence of an account”. My interpretation of the textual data collected in this study is presented in the Results section of the paper. Background on Research Performance Indicators Research is a core business of universities and, as universities become more business-like in the current competitive environment, there is pressure to manage research activities more effectively. In Australia, the Federal government has called for improved efficiency and public accountability in higher education (HE) leading to an interest in Performance Indicators (PI) in the industry. A government commission was set up in the late 1980s to develop a “broad range of quantitative indicators suitable for evaluating relative performance 1
A Business Intelligence development product donated to our research group by Gentia Pty Ltd
367
in HE” and report on their “practicability, data requirements and appropriate conditions of use” (DEET 1991). The research PIs that they came up with fell into the categories of research grants, publications and other original works, paid consultancies and professional service activities. A performance evaluation group (PEG) was commissioned to carry out a study of 40 candidates for research assessment of 1990 data (NBEET 1993). The group’s aim was the identification of the definitions and representational scope of alternative, quantitative measures of research performance. From a list of 40 candidates, they chose the seven PIs shown in Figure 2. Number of published books per academic staff Number of published edited books per academic staff Number of refereed chapters in books per academic staff Number of refereed articles per academic staff Number of published conference papers per academic staff Number of unrefereed publications per academic staff Creative works and other significant output per academic staff
Figure 2. The seven research PIs chosen by the NBEET committee (1993) The declared motive of a subsequent report (NBEET 1994) was the concept that quality assurance in HE needed “more sophisticated quantitative measures in order to arrive at sensible decision about relative research performance”. The focus of the report was on “testing and refining the PIs identified in the 1991 report for reliability, verifiability and collectability”. It appears that this report was driven by the need for specifications for the new computer systems being developed by CASMAC, a joint consortium of universities. Consideration of the concrete implementation issues raised awareness of the inherent difficulties in attempting to objectively measure research performance. The problem was again addressed in a 1996 report (NBEET 1996) which described research income and expenditure as well as output across institutions and fields of study where there emerged great diversity in terms of research expenditure, income and publications patterns. This report looked at the policy implications of a proposed two-tiered research system both between and within universities where there would be a concentration of research resources within a limited number of universities. The report stressed the need to collect data to assess the implications this, and alternative, policies. The official government message to universities is that the “basic function of PIs is to assist in determining how well a particular institution or department has achieved its respective goals”. (DEET 1991) However universities are well aware firstly, that PIs are tied to government funding and secondly that, in the area of research, PIs will affect the university’s standing if the two-tiered research system is introduced. For these two reasons the collection of research performance data within universities has become an important activity over the past five years. Background on Research Management (Goals and Strategies) While the government committees concentrated on the question of what to measure as research PIs, the separate issue of whether this data could be processed into information that would support more effective research management, received must less attention. The general assumption seems to be that performance measures enable the evaluation of progress
368
towards long-term goals. The difficulty is that there is a huge gap between the lofty research objectives and strategies, set at the organisational level, and research output generated by individuals and small groups. University Mission “The University of Wollongong aims to explore, develop and apply human and technological capacity for the benefit of its region, the nation and the international community.” Objectives Ø To be a centre of excellence in scholarship, teaching and research. Ø To attract good students. Ø To develop a diverse, socially responsible culture receptive to new ideas and critical enquiry. Ø To foster co-operation, teamwork and collegial relationships with an international orientation. Ø To provide equity of access Ø To contribute to the social and economic development of its region Strategies Ø Promotion of the University’s aspirations, achievements, philosophies and social and environmental attributes. Ø Identification and commitment of resources to selected research areas. Ø Development of strategic alliances. Ø Development and evaluation of quality control. Ø Development and continuous improvement of management processes, which are open, responsive, accountable and committed to campus communication
.Figure 3. A summary of university’s research planning. Examples of research objectives and strategies, for the university used in the study, are shown in Figure 3. These were determined through a straightforward planning process, which began with a mission statement from which came the objectives and then the strategies to achieve them. The challenge is to ascertain how the PIs shown in Figure 2 relate to these objectives and strategies and therefore how this performance information can be best presented to managers to support the research management processes. The question might even be whether these PIs are a suitable means of evaluating the quality of research and if not, the problem would be to devise more appropriate and workable measures. It was anticipated that the results of the study might shed light on these issues, which are raised in the Discussion section of the paper. Implementing the MDDB Prototype The MDDB was designed using a top-down approach focussing on the business problem of research output. The measures or “facts” chosen were: •
Numbers of publications
•
Publication Index (Publications weighted on category)
•
Number of Staff
•
Publication Rate (Publication Index per staff member)
369
The dimensions were time, publication category and location within Faculties and Departments. The details of the data model can be seen in Figure 4 which contains the Gentia syntax for the MDDB design and should be relatively easily understood by an IS professional. This code determines the data structure of the Gentia MDDB (known as a GADB) and an empty database is created when the model code is compiled. The GADB was populated, using a small Gentia program, from a comma-delimited, text file of data exported from the original relational database. A GUI interface was developed using standard Gentia tools and is shown in Figure 5. This interface permits slice and dice, as well as drill down, of the MDDB table in the top left of the screen as well as the corresponding graph underneath. To the right of the screen is a textbox containing a list of the publication categories and their weightings. At the bottom of the screen was a graph of student loads and student-staff ratios, as this was also of interest to research managers in comparison with research performance.
FILE "uowres" DIMENSION Meter IS Staff DISPLAY AS "# of Staff", NoPubl DISPLAY AS "# of Publications", PublInd DISPLAY AS "Publication Index", PublRate DISPLAY AS "Publication Rate"; DIMENSION Time IS Y1995 DISPLAY AS "1995", Y1996 DISPLAY AS "1996" Y1997 DISPLAY AS "1997" DIMENSION PubCategory IS allcat DISPLAY AS "All Categories" FROM ( bk DISPLAY AS "Books" FROM (A1, A2, A3, A4 ), chap DISPLAY AS "Chapters" FROM ( B), jrn DISPLAY AS "Articles" FROM (C1, C2, C3, C4), revs DISPLAY AS "Reviews" FROM (D), conf DISPLAY AS "Conferences" FROM (E1, E2, E3, E4), G DISPLAY AS "Audio-Visual", H DISPLAY AS "Software", I DISPLAY AS "Patents", crea DISPLAY AS "Creative Works" FROM (J1, J2, J3, J4 ), Other FROM (K1, K2, K4, K5, K6));
DIMENSION Faculty IS allfac DISPLAY AS "All Faculties" FROM ( Arts FROM (CCS, HP, ML, Phil, Soc, STS, GradScJ, FacCrArts, FacArts), Comm DISPLAY AS "Commerce" FROM (Accy DISPLAY AS "Accountancy", Buss DISPLAY AS "Business Systems", Ecc DISPLAY AS " Ecconomics", Man DISPLAY AS "Management", FacComm), Edu DISPLAY AS "Education" FROM ( FacEdu), Eng DISPLAY AS "Engineering" FROM ( MechEng, MatEng, CME, FacEng), HBS DISPLAY AS "H & B Sciences" FROM ( Psyc, Nurs, BMS, PHN, FacHBS), Info DISPLAY AS "Informatics" FROM ( ITCS, MAP, ECTE, FacInfo), Law FROM ( FacLaw), Sci DISPLAY AS "Science" FROM ( Biol, Chem, Geo, Phys, FacSci) );
Figure 4 Gentia code for the dimensional data model
370
Figure 5 The Gentia GUI Interface to the MDDB Interpretive Analysis of the Interviews All managers, except for the senior executive who showed only a passing interest, were tremendously excited by the MDDB for the following reasons: •
They could manipulate the data themselves whereas previously most used intermediaries to query the relational system, a process that expended much time and effort.
•
They could easily identify gaps or errors in the underlying data, which could be investigated and corrected. Previously they suspected that the data was flawed but found it hard to identify where.
•
They all agreed that, once the underlying data was corrected, this view of data could be used effectively to allow more equitable distribution of resources, as all managers would see the same information. Previously different queries would produce different answers depending on how queries were phrased.
The main problems identified with the MDDB were: •
the fact that attributes of the location and category dimensions could change with the time dimension, and
•
the political implication of the information provided which, from the senior executives’ point of view, could intensify the competition between faculties for resources.
371
It was also realised that the MDDB was not suitable for certain functions such as enabling individual researchers to extract a list of all their own publications on record. The MDDB stores only numeric facts, such as the number of publications of a particular type per year by a particular department, and not records of individual publications. All those interviewed agreed that the project of creating the MDDB was itself useful in raising awareness of the suitability of assessing research performance with quantitative performance indices.
DISCUSSION The interpretation of the interviews revealed that there were definite advantages of the multidimensional form of information for managers. It presented the information in a form that was meaningful to them and was easy for them to interpret and manipulate. They could readily pick up anomalies, omission and errors in the underlying data and, if these were corrected, they would have confidence in the picture that they received on research performance. It is my interpretation that the following findings are generalisable to any type of performance measures, structured in multidimensional form. •
In MDDB managers have an advantages in being able to directly access and manipulation the data
•
The multidimensional form of information is suitable for managers as it is a simplification of what are usually complexity sets of data in transaction processing systems
•
Problems with dirty data can be identified when managers view the MDDB
•
Planning is easier when all participants have access to and have confidence in the same view of performance information
•
There are political implications of open information and senior managers have misgivings when performance information in hands of subordinates
•
Some relationally trained database developers can have difficulties understanding the multidimensional data model.
The study also raises the following specific issues concerned with the use of research performance indicators. First, there seem to be at least two different motives for measuring research performance in Australian universities and these are the allocation of funding and quality assurance. It is possible that these two motives are mutually self-defeating, as the knowledge that funding is dependent on research output encourages the “research game” where performance indicator scores becomes an end in itself and quality research is not longer the main objective. Second, even where the principle of performance indicators is accepted, there is little agreement on what is a suitable set of measures for research performance. The choice of what to include, what are the weightings and how to calculate the rating per staff member are contentious and must differ between institutions and disciplines, so that overall comparisons are rarely meaningful. This seems to defeat the purpose of have the indicators in the first place.
372
Third, there is the problem of collecting, analysing and presenting the information on research performance. There are questions on accuracy, relevance and whether the end result justifies the effort. Fourth, there is the question of how to interpret the quantitative measures and whether past performance in an indicator of future prospects. The PIs originated from a need to compare the performances between institution and within institution there is a need for some qualitative assessment to be used, in conjunction with the PIs, for future planning. Fifth, there needs to be more alignment of the goals, strategies and assessment of individuals with the goals and strategies of institutions. It often seems that the vision of the executive for the institution is not communicated effectively to units and individuals within the institution and that competition for resources with institutions is at odds with the effective management of the institution. These five issues were all raised by one or more of the interviewees in the study of research performance information. It would appear that information itself is a powerful tool for management in organisation but its effects are unpredictable and complex. Whereas is some ways the provision of information clarifies the position and makes management decisions easier, it can also bring to light issues and problems that were formerly unknown or ignored.
CONCLUSION This paper has described the effectiveness of dimensional data structures in providing information support for messy and unstructured management decision making. The usefulness of such information systems appears to depend not only on the right technical design but also on having in place good policies that determine their information content. The university research management study described in this paper reveals that the multidimensional form of performance information is welcomed as a great asset by managers but raises an awareness of the complexities of assessing quality of performance with quantitative data. Even with clear and unambiguous quantitative research output measures, managers in the study questioned the validity and meaningfulness of the information in guiding decisions made on future directions in research management. The message for IS professionals is that, to successfully develop systems to provide organisational performance information for managers, it is not sufficient to ensure a sound technical design of the system. They must consult widely to establish organisational policies on the information content. Multi-dimensional data structures do however appear to be useful in building prototype systems that will engage the attention of managers and assist in this task.
REFERENCES Barrow (1992) Implementing an Executive Information System in Watson, Rainer, Houdeshel (eds) Executive Information Systems, Wiley, Baum D. (1996) Data Warehouses, Building Blocks for the Next Millennium, Oracle Magazine, Mar/Apr, 34-43. Burkan (1991) Executive Information Systems: from Proposal Through Implementation Van Nostrand Reinhold. Codd E.F. (1970) A Relational Model of Data for Large Shared Databanks, Communications of the ACM, 13/6. Creeth R. and Pendse N. (1995) The OLAP Report, Business Intelligence
373
DEET (1991) Report on Performance Indicators in Higher Education Australian Government Publishing Service Canberra. Gentia (1997) OLAP for the Enterprise http://www.gentia.com/products/gs_eolap.htm Hasan H. (1999) The mediating role of technology in making sense of information in a knowledge intensive industry. Knowledge and Process Management 6, in press. Hasan H. and Gould E. (1994) EIS in the Australian Public Sector Journal of Decision Systems, 3/4, pp 301 - 319). Hasan H. and Gould E. (1995) The Evolution of an Information System for Managerial Use: A Longitudinal Study, Australian Journal of Information Systems 2/2, 88-93. Hasan H. and Gould E. (1996) A Framework For EIS Development in The Public Sector Proceedings of IRMA, Washington. Kimball R. (1997) A Dimensional Modelling Manifesto DBMS Online, www.dbmsmag.com/9708d15.html McCosh A. and Scott-Morton M. (1978) Management Decision Support Systems, Macmillan, UK. Miles M. B. and Huberman A. M. (1994) Qualitative Data Analysis, Sage, Thousand Oaks, California. Mintzberg H. (1989) Mintzberg on Management, Inside our strange world of organisations. Macmillan NBEET (1993) Research Performance Indicator Survey Report 21 - Australian Government Publishing Service Canberra. NBEET (1994) Quantitative Indicators of Australian Academic Research, Report 27 Australian Government Publishing Service Canberra. NBEET (1996) Patterns of Research Activity in Australian Universities Report 47 Australian Government Publishing Service Canberra. Newell A. and Simon H.A. (1972) Human Problem Solving, Prentice Hall Englewood Cliffs. Pokorny J. (1998) Conceptual Modelling in OLAP, Proceeding of ECIS’98, Aix-en-Provence, 273-288. Rockart J and De Long D (1998) Executive Support Systems, Dow Jones-Irwin. Volonino and Watson(1992) The Strategic Business Objectives Method for Guiding Executive Information Systems Development in Watson, Rainer, Houdeshel (eds) Executive Information Systems, Wiley. Wagner C. (1995) Decision support for “messy” problems, Information and Management 28, 393-403. Weldon (1995) Managing Multidimensional Data: Harnessing the Power, Database Programming and Design, August.
COPYRIGHT Helen Hasan 1999. The authors assign to ACIS and educational and non-profit institutions a non-exclusive licence to use this document for personal use and in courses of instruction provided that the article is used in full and this copyright statement is reproduced. The authors also grant a non-exclusive licence to ACIS to publish this document in full in the Conference Papers and Proceedings. Those documents may be published on the World Wide Web, CDROM, in printed form, and on mirror sites on the World Wide Web. Any other usage is prohibited without the express permission of the authors.
374