this paper, we show that in complex information systems such as digital .... We collected implicit ratings from 22 students at both the Ph.D. and Master's level in Computer Science at Virginia Tech; CITIDEL [14] contains documents in the ..... Interactive Data Mining, Managing Data Mining Technologies in Organizations:.
Effectiveness of Implicit Rating Data on Characterizing Users in Complex Information Systems Seonho Kim, Uma Murthy, Kapil Ahuja, Sandi Vasile, and Edward A. Fox Department of Computer Science Virginia Tech Blacksburg, Virginia 24061 USA {shk, umurthy, kahuja, sandi, fox}@vt.edu
Abstract. Most user focused data mining techniques involve purchase pattern analysis, targeted at strictly-formatted database-like transaction records. Most personalization systems employ explicitly provided user preferences rather than implicit rating data obtained automatically by collecting users’ interactions. In this paper, we show that in complex information systems such as digital libraries, implicit rating data can help to characterize users’ research and learning interests, and can be used to cluster users into meaningful groups. Thus, in our personalized recommender system based on collaborative filtering, we employ a user tracking system and a user modeling technique to capture and store users’ implicit ratings. Also, we describe the effects (on community finding) of using four different types of implicit rating data.
1 Introduction As two-way World Wide Web services such as blogs, wikis, online journals, online forums, etc. became popular, more people were able to express themselves and play more active roles in online societies [1, 2]. This trend changed WWW users from passive anonymous observers to visible individuals with personalities. Such users, in increasing numbers, are patrons of digital libraries (DLs), e.g., researchers and distance learners. Studying users of DLs is providing opportunities for research on collaborative filtering, personalization, user modeling, and recommender systems. Most such studies consider users’ ratings on the information they select, as well as users’ preferences – e.g., on research areas, majors, learning topics, or publications – which are entered explicitly [3, 4, 5]. However, obtaining explicit rating data is difficult. Further, terminology associated with the broad topical coverage of most DLs poses serious challenges regarding the identification of users’ research and learning interests. Even people with the same research interests express those interests with different terms, while the same terms sometimes represent different research fields. For these reasons, we need other evidence to help distinguish users’ research interests, without depending on their written comments. Thus, Nichols [6] and the GroupLens team [7] showed the great potential of implicit rating data when it is combined with existing systems to form a hybrid system. Further, we utilized users’ implicit rating data for collaborative filtering in DLs [8]. However, the effectiveness
of implicit rating methods still remains unproven. Consequently, we explore user tracking and implicit ratings in Section 2 and then propose hypotheses about the use of such data in Section 3. Section 4 describes our initial experiments and their results, while Section 5 concludes the discussion and outlines future work.
2 User Tracking and Implicit Ratings Gonçalves et al. proposed an XML based log standard for DLs [9] which helped pave the way for this study. However, originally it emphasized the interoperability and reusability of logging, based on a minimal DL metamodel. A more detailed characterization and analysis of user societies and scenarios is needed. Accordingly, we developed a user tracking system [8, 10] to collect histories of users’ interactions. The user tracking system, which collects and sends all phrases and sentences clicked and typed by a user to a server, is embedded in the interface, so that the user is not aware of its existence. Instead of using HTTP web logs like most DLs, we employed a user modeling technique to record interactions, in XML. Each user model also contains demographic information, personal interests, and similarities with research interest groups in DLs. The most distinctive feature of the model is that it contains a user’s implicit ratings along with explicit ratings and statistics, as needed for collaborative filtering and recommendation. This not only increases the completeness, interoperability, and reusability of user model data, but also decreases the complexity of the process. User interests are entered implicitly by using a document clustering algorithm, LINGO [11, 12], and a user tracking interface. Also, sending a query, selecting or skipping an anchor, and expanding a node – all are considered implicit ratings.
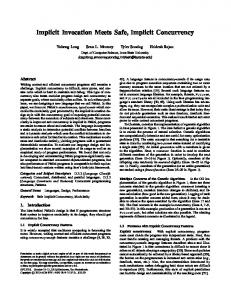
Figure 1: A DGG for "User Activity" attribute
An implicit rating is captured from a user activity. Figure 1 is our Domain Generalization Graph (DGG) for the user activity attribute in our model; DGGs are more commonly used in connection with data mining targeted on sales or transaction data [13] to represent the comprehensive relations between attributes. Each node in the graph represents a partition of the values that can be used to describe the attributes. The discrete attribute “frequency” is independent of other attributes of user activity. Edges between adjacent nodes describe the generalization relations between the nodes. Each user activity has a direction, where: • “rating” means the user gives some feedback to the system; • “perceiving” means the user doesn’t give feedback to the system; and • regarding intention, “implicit” means the user gives feedback implicitly while “explicit” means feedback is given explicitly. Thus, sending a query and reading a title are not “rating,” since we don’t give any feedback. However, expanding and skipping a cluster are “rating” – by which we indicate whether the cluster is interesting or not. For an example of intention, note that entering a query is “implicit,” because our purpose is not to characterize ourselves. However, entering user information or preferences is “explicit.”
3 Hypotheses To assess the effectiveness of implicit rating data for characterizing DL patrons according to their research interests, we developed a special interface for the CITIDEL system [14], part of the NSF-funded National Science Digital Library. Our interface was based on Carrot2 [11], coupled with our user tracking system, which together support and record selection of clusters (i.e., the output of the system) [8]. Hence, we test three hypotheses about proper human-computer interaction and document clustering. 1. 2. 3.
H1: For any serious user with their own research interests and topics, show repeated (consistent) output for the document collections referred to by the user. H2: For serious users who share common research interests and topics, show overlapped output for the document collections referred to by them. H3: For serious users who don’t share any research interests and topics, show different output for the document collections referred to by them.
4 Experiments and Data Analysis We collected implicit ratings from 22 students at both the Ph.D. and Master’s level in Computer Science at Virginia Tech; CITIDEL [14] contains documents in the “computing” field. 18 of the students successfully completed the experiment and so were selected to be analyzed for this study. Each subject was asked to perform searches with CITIDEL using 10 queries in his/her (hereafter, “her”) research field
and allowed to browse the search results to find interesting documents. All subjects were required to register into the system and so provided explicit preferences. By session end, each subject had an XML formatted user model in our system. The recommender, which is a software module in charge of collaborative filtering, manages and updates models whenever users log-out. Figure 2 is a simplified sample of a user model. The model consists of four highest level elements (in addition to a log of queries submitted): 1) “userInfo” and “userInterests” (not expanded) are for explicit answers to a questionnaire, 2) “community” is for the communities of the user found by the recommender, 3) “proposed” is for document topics which are shown to the user and skipped, and 4) “selected” is for document topics which are selected or expanded by the user. Therefore, (1) is explicit rating data, (2) reflects computer inference, and (3) and (4) are implicit rating data. Each entry has accompanying statistics (e.g., frequencies, probabilities). - seonho + + - sig001 sig004 sig003 - Educational Library User modeling Log System - Curriculum in Computer Distance learning Computer Communication Computer and Computer Education Computer Security Computer Integrated Manufacturing Computer and Public Computer Anxiety Data Parallel IEEE Computer Society - Curriculum in Computer Distance learning Computer and Computer Education Computer and Public IEEE Computer Society
(1) (2)
(3)
(4)
Figure 2: An example of user model generated by the recommender We employed hypothesis testing [15] as follows. Because the data collected from the user tracking system is independent and identically distributed (i.i.d.), we use inference processes to verify hypotheses and estimate properties, starting with HT1. HT1: Hypothesis testing and confidence intervals for H1. 1. H0 (Null hypothesis of H1): Mean (µ) of frequency of document topics proposed by the Document Clustering Algorithm are NOT consistent (µ0 = 1) for a user. Hypothesis Testing about H0 : µ = µ0 vs. H1 : µ > µ0 2. Conditions: 95% confidence (test size α = 0.05), sample size ‘n’ < 25, unknown standard deviation ‘σ’, i.i.d. random sample from normal distribution, Æ estimated z-score t-test.
3. Test statistics: sample mean ‘ y ’ = 1.1429, sample standard deviation ‘s’ = 0.2277 are observed from the experiment. 4. Rejection Rule is to reject H0 if y > µ0+zα/2 σ/√n 5. From the experiment, y = 1.1429 > µ0+zα/2 σ/√n = 1.0934 6. Therefore decision is to Reject H0 and accept H1, 95% Confidence Interval for µ is 1.0297 ≤ µ ≤1.2561, and P-value = 0.0039
Although we separated H2 and H3 as different hypotheses to emphasize the ideas, they can be understood as identical and can be proven and estimated together by one hypothesis test, with confidence intervals as described below. So, we consider HT2: HT2: Hypothesis testing and confidence intervals for H2. 1. H0 (Null hypothesis of H2): A user’s average ratio of overlapped topics with other persons in her groups over her total topics which have been referred, µ1, is the same as the average ratio of overlapped topics with other persons out of her groups over her total topics which have been referred, µ2. Hypothesis Testing about H0 : µ1 = µ2 vs. H2 : µ1 > µ2 Because a user can belong to multiple groups, population means µ1 and µ2 are calculated as in the formulas below, respectively, G
µ1 =
nK
nK
k =1 i =1 j =1, j ≠ i G
∑n k =1
K
nK
G
∑∑ ∑ O ,
k =1 i =1 j =1, j∉K G
µ2 =
(nK − 1)
N
∑∑ ∑ O
i, j
∑n k =1
K
i, j
( N − nK )
where Oi,j is user i’s topic ratio overlapped with user j’s topics over i’s total topics, G is the total number of user groups in the system, nK is the total number of users in group K, and N is the total number of users in the system. One instance of random variables in this testing, one user’s overlapped topic ratio with other persons in her group and overlapped topic ratio with other persons out of her group, is illustrated in Figure 3. 2. Conditions: 95% confidence (test size α = 0.05), two i.i.d. random samples from a normal distribution, for two sample sizes n1 and n2, n1 = n2 < 25, standard deviations of each sample σ1 and σ2 are unknown Æ two-sample Welch t-test. 2 2 3. Test statistics: Welch score ‘w0’ = s1 s 2 , where y 1 , y 2 are sample means ( y1 − y 2 ) /
+
n1
n2
of each sample and s1, s2 are sample standard deviations of each sample. 4. Rejection Rule is to reject H0 if the w0 > t df ,α where t refers to the t-cutoff of the ts
distribution table, and dfs is the Satterthwaite’s degree of freedom approximation [15] which is calculated by df
S
=
(s
(s
2 1
2 1
n 1 + s 22 n 2
)
n1 n1 − 1
2
+
(s
2 2
)
2
)
n2 n2 − 1
2
5. From the experiment, y 1 = 0.103, y 2 = 0.0215, dfs = 16.2 and w0 = 4.64 > t16.2, 0.05 = 1.745 6. Therefore decision is to Reject H0 and accept H2, 95% Confidence Intervals for µ1, µ2 and µ1 - µ2 are 0.0659 ≤ µ1 ≤ 0.1402, 0.0183 ≤ µ2 ≤ 0.0247 and 0.0468 ≤ µ1 - µ2≤ 0.1163, respectively, and P-value = 0.0003
Although the confidence intervals found in HT1 and HT2 are broad because of a relatively small set of participants, all values in the intervals still prove our hypotheses. Therefore, supported by HT1 and HT2, we argue statistically that our hypotheses are correct. We conclude that each DL user will engage in consistent activities in response to consistent output of the DLs according to their research interests and learning topics. Also, DL users who share common research interests and learning topics will share the same output from the DLs as well. Therefore, we conclude that using implicit rating data is highly effective in characterizing users, according to our experiment.
Figure 3: An instance of the random variables for user a’s in-group overlappings and out-group overlappings, in the Hypothesis Testing HT2. All overlapping ratios are directed. ab means the overlapping ratio from user ‘a’ to user ‘b’. Because the ratio is the number of topics overlapped over the total number of topics in her user model, ab ≠ ba . In this case, the in-group overlapping ratio of user ‘a’ is the average of ab , ac , and ad , and out-group overlapping ratio is the average of ae and af . Studies on the effect of different types of data on the performance of user cluster mining have highlighted a basic problem caused by the variety of academic terms, as we mentioned in the introduction section. However, we can explore user cluster mining more objectively, because we can obtain user groups without depending on user’s subjective answers to questionnaires about their research interests or preferences [8]. We conducted an ANOVA test to compare the effectiveness of four different user rating data types on the performance of user cluster mining by using implicit rating data and user groups collected from experiments in [8]. Figure 4 shows the result; ANOVA statistics F(3, 64) = 4.86, p-value = 0.0042 and the least significant difference (LSD) = 1.7531. Topics mean noun phrases generated by LINGO. Terms indicate single nouns contained in the original documents, queries, and topics. Although we gained a relatively large LSD because of the small number of participants, we still found statistical significance in this test. Figure 4 shows that the test using proposed terms performs significantly worse. Except for the test using the proposed terms, the other three tests that use selected topics, proposed topics, and selected terms don’t show statistically significant differences from each other even though the test using proposed document topics shows slightly higher performance. We believe that this is because using proposed terms causes too sensitive overlapping both in the in-group testing and out-group testing (to distinguish proper relations between users). This leads us to conclude that
term-frequency based approaches to user cluster mining are not as efficient as document-topic based approaches using user rating and document clustering. 0.2
5
Overlapping Ratio
0.16 0.14
4
0.12 0.1
3
0.08
2
0.06 0.04
1
0.02 0
Average of BIU / BOU
6
0.18
0 selected topics proposed topics selected terms proposed terms Implicit Rating Data Used Between In-Group Users (BIU) Between Out-Group Users (BOU) Distinguishability : Average of BIU/BOU
Figure 4: Effects of implicit data type used, on the average topic overlapping ratios, between in-group users and between out-group users.
5 Conclusions and Future Work We designed and implemented a user modeling and user tracking system for a DL to capture and maintain a user’s ratings and preferences. We then proved that implicit rating data in a complex information system is highly related with the user’s research interests, learning topics, and preferences – through two statistical hypothesis tests. The test results support the claim that implicit ratings are good information for studies on user analysis, personalization, collaborative filtering, and recommending. Finally, we tested the effect of different types of rating data on the performance of user cluster mining and found that using proposed terms performs worst, because of sensitive overlapping ratio of appearance. From this test we conclude that user’s activities of selecting something on the interface, and extracting document topics of returned documents from searches with a document clustering algorithm, represent the user’s characteristics. These results are more meaningful in complex information systems like digital libraries because such systems have dynamic contents and sparse rating data, and thus implicit rating data is more feasible to collect than explicit rating data. Future work will include more advanced data mining techniques using implicit rating data and a wider deployment of a visualization front-end for CITIDEL [16].
6 Acknowledgements We thank the: people and organizations working on CITIDEL, student participants in our experiments, developers of the LINGO algorithm, and developers of the
CitiViz [16] visualization tool. Thanks go to the National Science Foundation for support of grants NSF DUE-0121679, DUE-0121741, IIS-0307867, and NSF IIS0325579.
References 1. 2. 3. 4.
5. 6. 7. 8.
9.
10. 11. 12.
13. 14.
Ravi Kumar, Jasmine Novak, Prabhakar Raghavan and Andrew Tomkins: Structure and Evolution of Blogspace. In Communications of the ACM, Vol. 47, No. 12, December 2004, 35-39 Cass R. Sunstein: Democracy and Filtering. In Communications of the ACM, Vol. 47, No. 12, December 2004, 57-59 Thomas W. Malone, Kenneth R. Grant, Franklyn A. Turbak, Stephen A. Brobst, and Michael D. Cohen: Intelligent information sharing systems. In Communications of the ACM, Vol. 30, No. 5, 1987, 390-402 David M. Nichols, Duncan Pemberton, Salah Dalhoumi, Omar Larouk, Clair Belisle and Michael B. Twidale: DEBORA: Developing an Interface to Support Collaboration in a Digital Library. In Proceedings of the Fourth European Conference on Research and Advanced Technology for Digital Libraries (ECDL ’00), Lisbon Portugal, September 2000, 239-248 Kai Yu, Anton Schwaighofer, Volker Tresp, Xiaowei Xu and Hans-Peter Kriegel: Probabilistic Memory-based Collaborative Filtering, IEEE Transactions on Knowledge and Data Engineering, 2004, Vol. 16, No. 1, 56-69 David M. Nichols: Implicit Rating and Filtering. In Proceedings of 5th DELOS Workshop on Filtering and Collaborative Filtering, Budapest Hungary, November 1997, 31-36 Joseph A. Konstan, Bradley N. Miller, David Maltz, Jonathan L. Herlocker, Lee R. Gordon and John Riedl, GroupLens: Applying Collaborative Filtering to Usenet News. In Communications of the ACM, Vol. 40, No. 3, 1997, 77-87 Seonho Kim and Edward A. Fox: Interest-based User Grouping Model for Collaborative Filtering in Digital Libraries. In Proceedings of the 7th International Conference on Asian Digital Libraries (ICADL’04), Shanghai, China, December 2004. In Springer Lecture Notes in Computer Science 3334, 533-542 Marcos André Gonçalves, Ming Luo, Rao Shen, Mir Farooq and Edward A. Fox: An XML Log Standard and Tools for Digital Library Logging Analysis. In Proceedings of Sixth European Conference on Research and Advanced Technology for Digital Libraries, Rome, Italy, September, 2002, 16-18 Kapil Ahuja, Uma Murthy and Sandi Vasile: In Virginia Tech report, available at http://collab.dlib.vt.edu/runwiki/wiki.pl?MmProjectUserMod, 2004 Carrot2 Project, A Research Framework for experimenting with automated querying of various data sources, processing search results and visualization, available at http://www.cs.put.poznan/pl/dweiss/carrot/, 2005 Stanisław Osiński and Dawid Weiss: Conceptual Clustering Using Lingo Algorithm: Evaluation on Open Directory Project Data. In Advances in Soft Computing, Intelligent Information Processing and Web Mining, Proceedings of the International IIS: IIPWM’04 Conference, Zakopane Poland, 2004, 369-378, available at http://www.cs.put.poznan.pl/ dweiss/site/publications/download/iipwm-osinski-weiss-2004-lingoeval.pdf Aaron Ceglar, John Roddick and Paul Calder: Guiding Knowledge Discovery Through Interactive Data Mining, Managing Data Mining Technologies in Organizations: Techniques and Applications, Idea Group Publishing, 2003, 45-87 CITIDEL: Available at http://www.citidel.org/, 2005
15. R. Lyman Ott and Michael Longnecker: An Introduction to Statistical Methods and Data Analysis, Fifth Edition, Wadsworth Group, 2001 16. Saverio Perugini, Kathleen McDevitt, Ryan Richardson, Manuel Perez-Quiñones, Rao Shen, Naren Ramakrishnan, Chris Williams and Edward A. Fox: Enhancing Usability in CITIDEL: Multimodal, Multilingual, and Interactive Visualization Interfaces, in Proceedings of the Fourth ACM/IEEE Joint Conference on Digital Libraries (JCDL ’04), Tucson Arizona, June 2004, 315-324