Journal of Environmental Quality
SPECIAL SECTION TECHNICAL REPORTS
RIPARIAN BUFFER STRIPS AS A MULTIFUNCTIONAL TOOL IN AGRICULTURAL LANDSCAPES
Effectiveness of Unfertilized Buffer Strips for Reducing Nitrogen Loads from Agricultural Lowland to Surface Waters Ignatius G. A. M. Noij,* Marius Heinen, Hanneke I. M. Heesmans, Jac T. N. M. Thissen, and Piet Groenendijk
S
urface water quality is a major concern in areas with intensive agriculture due to runoff and leaching of nutrients. Nitrogen (N) and phosphorus (P) loads have negative ecological impacts and hinder water use. Improving surface water quality is particularly challenging in rural areas because agriculture is a nonpoint source. Nutrient legislation in the Netherlands since 1986 focused on source measures and substantially reduced nutrient surpluses, but surface water quality still does not comply with current water quality limits (EU, 1991) or with ecological goals of the Water Framework Directive (EU, 2000; Hoogervorst, 2009). Therefore additional mitigation measures are considered: extra source measures, measures that reduce nutrient transport from agricultural fields to surface water, and measures that reduce further transport or impact of nutrients in the surface water system itself. Unfertilized buffer strips (BS) are a widely recognized mitigation option, both for N and P (Barling and Moore, 1994; Dorioz et al., 2006; Dosskey, 2002; Mayer et al., 2005, 2007; Muscutt et al., 1993; Parkyn, 2004; Polyakov et al., 2005; Wenger, 1999). Slope, landscape, and hydrogeology are key factors governing buffer strip effectiveness (BSE) (Burt et al., 2002; Dorioz et al., 2006; Hill, 1996; Hoffmann et al., 2006, 2009; Mayer et al., 2005, 2007; Puckett 2004; Ranalli and Macalady, 2010; Rassam et al., 2008; Sabater et al., 2003; Vidon and Hill, 2004; White and Arnold, 2009). For N, most records on BSE refer to nitrate retention. According to Hill (1996) and Ranalli and Macalady (2010), upper aquifers between 1 and 4 m thick are best for nitrate retention in riparian flood plains. They transfer shallow, horizontal groundwater flow, with sufficient residence time in the active layer of the riparian soil for nitrate removal through uptake by vegetation and denitrification. If riparian top soils are less permeable, influent precipitation surplus is deflected through lower aquifers or across the surface, both reducing BSE (Hill, 1996; Ranalli and Macalady, 2010). Balestrini et al. (2011) and Borin and Bigon (2002) reported high BSE for traditional BS with trees and grass in the Italian Po Valley. However, there is
Unfertilized buffer strips (BS) are widely accepted to reduce nitrogen (N) loads from agricultural land to surface water. However, the relative reduction of N load or concentration (BS effectiveness, BSE), varies with management and local conditions, especially hydrogeology. We present novel experimental evidence on BSE for 5-m-wide grass BS on intensively drained and managed plain agricultural lowland with varying hydrogeology. We selected characteristic sites for five major hydrogeological classes of the Netherlands and installed paired 5-m-wide unfertilized grass (BS) and reference (REF) treatments along the ditch. The REF was managed like the adjacent field, and BS was only harvested. Treatments were equipped with reservoirs in the ditch to collect and measure discharge and flow proportional N concentration for 3 or 4 yr. In addition, N concentration in upper groundwater was measured. We found a statistically significant BSE of 10% on the peat site. At the other sites, BSE for N was low and statistically insignificant. Low BSE was explained by denitrification between adjacent field and ditch, as well as by the site-specific hydrologic factors including low proportion of shallow groundwater flow, downward seepage, low residence time in the BS, and surface runoff away from the ditch. We emphasize that a REF treatment is needed to evaluate BSE in agriculture and recommend reservoirs if drainage patterns are unknown. Introduction of a 5-m-wide BS is ineffective for mitigating N loads from lowland agriculture to surface waters. We expect more from BS specifically designed to abate surface runoff.
Copyright © 2012 by the American Society of Agronomy, Crop Science Society of America, and Soil Science Society of America. All rights reserved. No part of this periodical may be reproduced or transmitted in any form or by any means, electronic or mechanical, including photocopying, recording, or any information storage and retrieval system, without permission in writing from the publisher.
I.G.A.M. Noij and P. Groenendijk, Alterra, Water and Climate Center, WageningenUR, P.O. Box 47, 6700 AA Wageningen, the Netherlands; M. Heinen and H.I.M. Heesmans, Alterra, Soil Science Center, Wageningen-UR, P.O. Box 47, 6700 AA Wageningen, the Netherlands; J.T.N.M. Thissen, Biometris, Plant Research International, Wageningen-UR, P.O. Box 100, 6700 AC, Wageningen, the Netherlands. Assigned to Associate Editor Marc Stutter.
J. Environ. Qual. 41:322–333 (2012) doi:10.2134/jeq2010.0545 Posted online 5 Oct. 2011. Freely available through the author-supported open-access option. Received 24 Dec. 2010. *Corresponding author (
[email protected]). © ASA, CSSA, SSSA 5585 Guilford Rd., Madison, WI 53711 USA
Abbreviations: BS, unfertilized (grass) buffer strip(s) or treatment; BSE, buffer strip effectiveness; bss, below soil surface; FIA, flow injection analyzer; L, location; P, period; PS, precipitation surplus; R, replicate; REF, reference strip or treatment; SFA, segmented flow analyzer; T, treatment.
322
no experimental evidence yet on the effectiveness of newly introduced grass BS in plain deltas with deeply permeable soil and abundant ditches, like the Netherlands. As deltas are often densely populated, both land and surface water are intensively used and it is relevant to also know BSE for these circumstances. The first goal of this research was to provide experimental evidence on BSE for N in plain agricultural lowland with a suitable and novel experimental method (Heinen et al., 2011). We then investigated site-specific influences on BSE for N.
Materials and Methods Hydrogeology and Field Site Description The relative contribution of shallow and deep groundwater to discharge is expected to determine BSE for N (Hill, 1996) and depends on the following factors in the Netherlands (Van Bakel et al., 2007): 1. ditch density: the more ditches, the shallower the discharge flow 2. depth and conductivity of the upper aquifer: the deeper and more permeable, the deeper the discharge flow 3. resistance of the aquitard below the upper aquifer: the more resistant, the shallower the discharge flow Ditch density was taken from the Water Information System (Rijkswaterstaat, 1995) and the topographical map of the Netherlands (Bregt and van Raamsdonk, 1998; Heuvelmans, 1998). Information from the National Groundwater Model (Pastoors, 1992) and the geological map (Zagwijn and van Staalduinen, 1975) was used for depth and conductivity of the soil profiles. The final hydrogeological classification is a
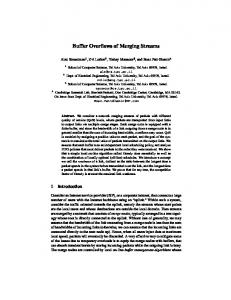
compromise between more differentiation and lower number (i.e., larger area) of classes (Fig. 1). Area percentage refers to the whole of the Netherlands. a. Shallow sand: sandy aquifer with slope on impermeable subsoil >4 m bss) sandy aquifer, area 33.5%. Shallow discharge flow paths starting near the ditch, deeper flow paths starting further away from the ditch. Situations with downward seepage and/or regional flow are not depicted in Fig. 1 but also pertain to this class. c. Sandy aquifer with less-permeable top soil, area 1.4%. Ditch bottom in the aquifer. Predominant deeper flow paths. d. Holland peat: less-permeable deep aquifer in peat soil, area 12.8%. Predominant shallow flow paths. e. Interrupted sand: deep sandy aquifer, interrupted by lesspermeable loam layer below the ditch bottom (1–4 m bss), area 16.1%. Both shallow and deep flow: ratio depends on conductivity of aquifer and loam layer. f. Holland clay: less-permeable deep aquifer in clay soil, area 33.7%. Tile drain discharge predominates because the majority of clay soils is tile drained. Classes b, e, and a provide a hydrogeological sequence with increasing proportion of shallow flow. Classes d and f belong to the so-called Holland profile. We selected five experimental sites that are characteristic for each of the major hydrogeologic classes (except c). We refer to these sites here by the names of the villages to which they belong (Table 1) and refer to the entire classes with the italicized names above (Fig. 1). The sandy sites are drained
Fig. 1. Geographical distribution (left) and profile (right) of hydrogeologic classes in the Netherlands (Van Bakel et al., 2007). Selected experimental locations (left) and expected flow paths (right). (a) Shallow sand: sandy aquifer with slope on impermeable subsoil 1 indicates input from other sources than PS. We calculated N surplus as N fertilizer rate minus N withdrawal by the crop. The absolute treatment effect on N surplus is N surplus REF minus N surplus BS. We used decreasing NO3–N/Cl concentration ratio between field and treatment (both Cgw), and between treatment (Cgw) and reservoir (C ) as an indirect indicator for denitrification, according to Altman and Parizek (1995) and Mengis et al. (1999). The precondition is that other causes for changing ratio, such as mixing with other groundwater or plant uptake, can be excluded. The flow-averaged leaching concentration, C (g m−3), was computed according to (e.g., Chaubey et al., 1994; 1995; Heinen et al., 2011): C=
∑ QC ∑Q
[1]
where Q times C represents the load. Sums were calculated for periods of equal discharge, instead of more common periods of equal time, to reduce the influence of spatial variation in discharge on the treatments (Heinen et al., 2011). For each leaching season and each pair of treatments, the lowest discharge at the end of the leaching period was used. We also computed an average C for all leaching seasons (c.f. Heinen et al., 2011). Buffer strip effectiveness based on reservoirs was computed in two different ways. The first calculation, BSEI, was based on flow-weighted means according to Heinen et al. (2011):
Table 2. Soil characteristics of the experimental sites. Site, hydrogeology Beltrum, deep sand
Replicate A B C
Zegveld, Holland peat
A B C
Winterswijk, shallow sand
A
Loon op Zand, interrupted sand
A
Lelystad, Holland clay
A
cm bss† 0–30 30–100 0–30 30–100 0–30 30–100 0–30 30–100 0–30 30–100 0–30 30–100 0–30 30–60 0–30 30–100 0–30 30–100
OM† % mass 5.7 3.4 5.0 1.2 5.5 1.6 52.0 74.2 51.1 75.8 48.8 72.0 6.6 3.9 3.3 1.5 2.6 1.7
30 g m−3 Cl). Reservoir Cl concentration was in between the concentration of deep and upper groundwater. We observed decreasing NO3–N/Cl ratio between both treatments and reservoirs. As mixing and plant uptake during the leaching period could be excluded, we attributed this decrease to denitrification. Denitrification was less at the BS (Table 5; NO3–N/Cl 1.29 → 0.72, compared with 1.53 → 0.55). All concentration measurements in reservoirs were summarized in Box-Whisker plots (Fig. 3). At all mineral soil sites, but Journal of Environmental Quality • Volume 41 • March–April 2012
most clearly at Beltrum, Nt in reservoirs mainly consisted of Nts, and Nts mainly of NO3–N. At Beltrum, we observed the highest maximum (35 g m−3 Nt) and the highest median Nt concentration (15 g m−3 Nt). Based on NO3–N in upper groundwater, BSEIII was 66% (Table 5). Based on both Nt and NO3–N in reservoirs, however, BSEI was on average −17.2% (Fig. 4a, Table 6), corresponding to an absolute difference in reservoir Nt concentration between REF and BS of −2.5 g m−3 N (Fig. 4b). BSEI was quite variable between replicates and leaching seasons (−101.8 to 22.8%, Fig. 4a) and therefore not significant (Table 7; BSEII = −14.8%; P = 0.583). High variability of negative BSE can be expected for mathematical reasons (Heinen et al., 2011). Given its statistical insignificance and negative value, BSEI,II for N is best interpreted as nil at Beltrum.
Loon op Zand, Interrupted Sand At Loon op Zand, both tracer recovery and discharge were very low and similar for both treatments (Table 3). Note that Q/PS was not calculated with the expected water divide (75 m, Table 1) but with the observed water divide (15 m, Table 1). With the expected water divide, Q/PS would be only 0.14. Even from the first 15 m, PS was not completely recovered (Q/PS = 0.66). Nevertheless, 50% of final tracer recovery was reached within 2 yr. Surface runoff was physically impossible due to an elevated border. Low discharge motivated a separate study (Hoogland et al., 2010). They installed a detailed grid of groundwater wells (1 per 12.5 m2) to observe the groundwater plane in time, showing high spatial and temporal variability in groundwater elevation due to the erratic relief of the cryoturbated loam layer (top 1.5–2.5 m bss, thickness 0.5–1.5 m). Water between 15 and
Table 3. Final tracer recovery (TR), number of days (t0.5) and accumulated amount of water discharge (Q0.5) since tracer application at half of final TR. Sum of discharge during leaching seasons for which buffer strip effectiveness was calculated (Q), corresponding precipitation surplus (PS), and number of flow-weighted reservoir samples (n). Q in mm and PS are calculated from a water divide based on the top of measured groundwater level (top of the slope for Winterswijk); see Table 1. Site, hydrogeology
Replicate
Period
Treatment†
A
2006–2010
A
2007–2010
B
2007–2010
C
2007–2010
A
2006–2010
A
2007–2010
B
2007–2010
C
2007–2010
A
2006–2007
Enlarged reservoirs
2007–2010
Loon op Zand, interrupted sand
A
2006–2009
Lelystad, Holland clay
A
2006–2009
REF BS REF BS REF BS REF BS REF BS REF BS REF BS REF BS REF BS REF BS REF BS REF BS
Beltrum, deep sand
Zegveld, Holland peat
Winterswijk, shallow sand
TR
t0.5
Q0.5
Q
Q
PS
% 40.0 36.3
d 146 411
m3 45 51
m3 132 133 82 88 90 95 119 107 164 180 80 110 110 115 60 86 88 120 410 820 38 36 1958 2191
mm 439 443 272 294 299 317 395 357 1097 1200 636 732 734 765 403 574 220 300 410 820 512 486 816 913
mm 866 866 538 538 542 542 502 502 1106 1106 744 744 752 752 758 758 471 471 860 860 752 752 779 779
66.9 36.9 97.8 63.3 32.1 32.2
2.1 6.8 1.1 5.3 28.7 78.4 45.1 89.0 1.3 1.6 21.1 20.8
136 790 496 778 147 260
771 586 677 771 140 84
663 467 692 114
28 63 65 71 67 87
102 83 58 85 78 43
39 26 1617 820
Q/PS Avg.‡ 0.51 0.51 0.51 0.55 0.55 0.58 0.79 0.71 0.99 1.09 0.72 0.98 0.98 1.02 0.53 0.76 0.47 0.64 0.48 0.95 0.68 0.65 1.05 1.17
0.61 0.61
0.89 0.83
0.55 0.72 0.66 1.11
n
153 152 97 93 109 84 92 96 340 333 197 182 199 206 149 183 66 86 147 268 156 156 217 308
† BS, buffer strip; REF, reference. ‡ Average Q/PS per location (either six or two reservoirs). Table 4. Average nitrogen balance (kg ha−1 yr−1 N) of buffer (BS) and reference (REF) treatments. Site, hydrogeology Beltrum, deep sand Zegveld, Holland peat Winterswijk, shallow sand Loon op Zand, interrupted sand Lelystad, Holland clay
Crop
BS Surplus†
Maize Grass Grass Grass Maize
−65 −280 −217 −134 −29
Fertilizer rate 174 288 425 316 171
REF Crop withdrawal
Surplus
139 368 374 325 168
36 −80 51 −4 3
† Surplus = 0 fertilizer rate – crop withdrawal. www.agronomy.org • www.crops.org • www.soils.org
327
75 m contributed to regional groundwater flow in the aquifer below the loam layer. Even water in the treatments partly moved away from the ditch. Geostatistical simulation revealed high variability of discharge area (or Q) along the ditch. On 10 Apr. 2008, for example, median discharge area for the 5-m reservoir was 17 m2, and 95% was 3 times box range. BS, buffer strip; REF, reference strip.
328
Journal of Environmental Quality • Volume 41 • March–April 2012
(Gelhar and Wilson, 1974), residence time in the treatments was only 0.03 yr. We suspected hydrologic spatial variability was caused by the erratic gullies, some decimeters wide and deep, in the top of the impermeable boulder clay layer that we detected with ground-penetrating radar. We enlarged the treatments and reservoirs (from 5 to 12.5 m) in 2007 to reduce this effect, but the opposite occurred. Between 2007 and 2010, discharge at BS was twice as much compared with REF during leaching seasons. The apparent discharge area of the BS proved to be much larger compared with REF. The top of the slope was about 80 m from the stream, but the contour lines deviated away from the stream opposite the BS, which likely caused extra discharge to the reservoir of the BS.
At Winterswijk, difference in Cgw between field and treatments (12 g m−3 N) was much larger than between REF and BS (2 g m−3 N, Table 5). Therefore, we did not calculate BSEIII. Denitrification occurred during transport from field to treatments (Table 5, NO3–N/Cl). At this site, N concentration of the BS reservoir was much higher than REF (Table 5, Fig. 3). Measured total accumulated Nt load (data not shown) was about 9 kg Nt (7 kg NO3–N) for BS, compared with 3 kg Nt (1.6 kg NO3–N) for REF. In Winterswijk, the equal discharge period for calculating BSEI (Eq. [1–2]) lasted until the beginning of the third season only, due to the very different discharge (Q) between BS and REF. Therefore, we also present BSEI for equal time periods (Fig. 4), to cover the entire experimental period. Average BSEI for Nt varied from −29.4 to −118.9%, with an average of −48.3% for equal discharge and −52.9% for equal time, corresponding to −3.3 g m−3 N. In contrast to the other sandy sites, the negative treatment effect was substantial and consistent for all years and dominated the seasonal effect (Fig. 4).
Lelystad, Holland Clay with Tile Drains Both discharge and final tracer recovery were similar for both treatments in Lelystad (Table 3). Although N-surplus was clearly lower for BS (Table 4), the difference in Cgw between REF and BS was smaller than the difference between field and treatments or reservoirs, and smallest of all sites (Table 5). Therefore, we did not calculate BSEIII. Average Cgw and Nt in reservoirs (Fig. 3) were also lowest at Lelystad. Due to the marine origin of the soil, Cl concentration was higher in both reservoirs compared with other locations. Average BSEI for Nt was 13.9%, corresponding to only 0.44 g m−3 (Fig. 4). Given the insignificant treatment effect for Nt in the overall statistical analysis, the very small BS effect at Lelystad is best interpreted as nil.
Zegveld, Holland Peat
Fig. 4. (a) Buffer strip effectiveness (BSEI ; Eq. [2]) for flow-weighted average total N concentration (Nt), and (b) absolute difference in Nt between reference strip (REF) and buffer strip (BS) (ΔNt), both for different leaching seasons (1, 2, 3, 4, and total [T]), locations, and replicates, for periods of equal discharge (Q) and in Winterswijk also for equal time (t) periods. www.agronomy.org • www.crops.org • www.soils.org
Tracer recovery at Zegveld was faster and higher at Replicate A compared with Replicates B and C (Table 3). Nevertheless, 50% of final recovery was also reached at Replicates B and C within 771days. Discharge was less variable than tracer recovery, both within and between treatment pairs. The average Q/PS ratio indicated almost complete recovery of PS in the reservoirs. According to the steady-state stream lines (FLONET; Molson and Frind, 2010), water starting within 18 m from the ditch flows through the upper 1 m of groundwater, but water from the water divide at 30 m can reach 4 m bss before entering the ditch. 329
Also at Zegveld, N-surplus was lower due to BS treatment (Table 4), but this was not reflected in lower Cgw or C at the BS, either for NO3–N or for Nts (including NO3–N, NH4–N, and soluble organic N; Table 5). We also presented Nts at Zegveld because organic matter dominates N dynamics at this peat site. Also at this site, differences in Cgw between field, treatments, and reservoirs were more pronounced than between BS and REF. Hence, we did not calculate BSEIII. Nitrate and NO3–N/Cl ratio increased between field and treatments, and decreased between treatments and reservoirs, which points to net nitrate production in the field and denitrification in the upper groundwater between treatments and reservoirs. By consequence, the lowest nitrate concentration was found in both reservoirs at Zegveld (Table 5, Fig. 3). Results for C Nt (Fig. 3), Nts, and NO3–N (Table 5) correspond well with values reported before for the Western peat district (4–8 g m3 Nt, 0–3.5 g m3 NO3–N; Van Beek, 2007). Average BSEI for Nt was 9.8%, corresponding to only 0.87 g m−3 N (Fig. 4). BSEI was negative only in the first season of Replicates B and C. Zegveld was the only location with a significant treatment effect on Nt (Table 7, BSEII = 15.1%, P = 0.005). For nitrate, BSEII was not significant in the statistical analysis (Table 7). Reservoir Nt mainly consisted of soluble organic N and to a lesser extent NH4–N.
2004; Polyakov et al., 2005; Wenger, 1999). The BS effect was only statistically significant in Zegveld (Holland peat). At this site, BSEI was also low (10%, Table 6), especially compared with the relatively large proportional area of BS (17%) on these narrow fields. At all sites, low BSE can be explained (i) by N removal through denitrification in the soil of treatments and adjacent field and (ii) by hydrologic factors (Table 8).
Denitrification Although the unfertilized BS reduced N surplus at all sites (Table 4), this was only reflected in lower Cgw below BS in Beltrum (deep sand) and Loon op Zand (interrupted sand) (Table 5). Corresponding BSEIII was 66 and 90%, respectively. We did not calculate BSEIII for Zegveld, Winterswijk, and Lelystad because low Cgw at BS could not be attributed to treatment: Cgw was also low at REF. At all sites except Beltrum, the difference in Cgw between REF and BS was smaller than between adjacent field and treatments (Table 5). Judged by decreasing NO3–N/Cl ratio (Table 5), this was caused by denitrification in the soil between field and treatments (Table 8), except in Zegveld (Holland peat). At the peat site, net production of nitrate occurred, causing even higher Cgw at the BS (Table 5, Nts). Mineralization of abundant organic matter and subsequent denitrification have annihilated potential differences between REF and BS. Denitrification also played a role during transport between treatments and reservoirs (Table 8). At all mineral soil sites, denitrification between REF and reservoir exceeded denitrification between BS and reservoir (Table 5) and therefore leveled out potential differences between both treatments.
Discussion We found very low BSE for N at all five sites characteristic for lowland agriculture, much lower than BSE values reported for other circumstances (e.g., Barling and Moore, 1994; Dosskey, 2002; Mayer et al., 2005, 2007; Muscutt et al., 1993; Parkyn,
Table 6. Buffer strip effectiveness (BSE, %) for five locations, based on flow averaged reservoir concentration (BSEI; Eq. [2]) and based on statistical analysis of individual reservoir concentration measurements (BSEII; Eq. [3]). Species Nt Nts NO3–N Cl
BSE I II I II I II I II
Beltrum Deep sand −17.2 ± 6.4† −14.8 −16.6 ± 6.2† n.d. −17.2 ± 6.4† −14.8 11.5 ± 3.4† 9.1
Zegveld Holland peat 9.8 ± 6.3† 15.1 6.9 ± 4.4† n.d. 44.1 ± 43.8† 42.3 1.3 ± 0.8† 1.6
Winterswijk Shallow sand −48.3 −61.6 −62.5 n.d. −113.6 −147.1 5.9 4.3
Loon op Zand Interrupted sand 10.4 5.9 9.9 n.d. 25.6 23.9 10.0 7.4
Lelystad Holland clay 13.9 5.1 13.2 n.d. 14.5 8.0 8.0 10.8
† Average and standard deviation refer to three replicates. Table 7. Buffer strip effectiveness, based on statistical analysis of individual reservoir concentration measurements (BSEII; Eq. [3]), and corresponding average difference in reservoir concentration (Cavg) between both treatments (REF – BS). P values for the terms location (L), treatment (T), leaching season (S), and mutual interactions. Analysis for Species REF–BS BSEII P values Cavg g m−3 % L T S L×T L×S T×S L×T×S All locations
Only Zegveld, Holland peat Only Beltrum, deep sand
330
Nt NO3–N Cl Nt NO3–N Cl Nt NO3–N Cl
−0.68 −0.94 2.58 1.36 0.44 0.59 −2.34 −2.13 2.34
−6.8 −15.3 6.8 15.1 42.3 1.6 −14.8 −14.8 9.1
0.061 0.025 5 m from ditch). § Contributes less to the explanation of low BSE because total nitrogen is not dominated by nitrate. ¶ Contributes very little to the explanation of low BSE because of drain pipes. www.agronomy.org • www.crops.org • www.soils.org
331
(i.e., existing) BS with trees and grass along agricultural fields (5–8 m wide). Reported high BSE for NO3–N was assessed without REF and attributed to the hydrologic effect of the trees and denitrification (Balestrini et al., 2011; Borin and Bigon, 2002). We expect lower BSE values in case a REF would have been used because denitrification would also occur without BS. Reservoirs proved valuable for our situation with unknown contribution from different flow paths. They revealed high spatial variability along ditches. Therefore, reservoir measurements before BS installation would further improve the experimental set-up (Heinen et al., 2011).
Upscaling The effectiveness of BS for N proved to be controlled by sitespecific factors (Table 8). Hence, BS would have to be tailormade, but our results predict little perspective for effective BS application in lowland plains. At sites with pipe drains that cover 40% of agriculture in the Netherlands (Massop et al., 2000), BS are not effective, as suggested previously by Muscutt et al. (1993). For the relatively uniform Holland peat area (12.8%), BSE proved to be low. As for the sandy soils, our results correspond to nitrate removal on flood plains differentiated by aquitard depth range (Hill, 1996: optimum 1–4 m bss). At deep sand (33.5%), the aquifer clearly runs too deep (>>4 m bss) and at shallow sand (2.4%) too shallow (