Attitudes, behaviours, math tools Running head: ATTITUDES, BEHAVIOURS AND MATH TOOL USE
Effects of Attitudes and Behaviours on Learning Mathematics with Computer Tools Helen C. Reeda1, Paul Drijversa, Paul A. Kirschnerb a
Freudenthal Institute for Science and Mathematics Education, Utrecht University, PO Box 9432, 3506 GK Utrecht, The Netherlands b
Open University of the Netherlands,
Valkenburgerweg 177, 6419 AT Heerlen, The Netherlands
1
Corresponding author.
E-mail address:
[email protected] Present address: Faculty of Psychology and Education, VU University Amsterdam, Van der Boechorststraat 1, 1081 BT Amsterdam, The Netherlands Tel: +31 (0)20 598 7023 Fax: +31 (0)20 598 8902
1
Attitudes, behaviours, math tools
2
Abstract This mixed-methods study investigates the effects of student attitudes and behaviours on the outcomes of learning mathematics with computer tools. A computer tool was used to help students develop the mathematical concept of function. In the whole sample (N = 521), student attitudes could account for a 3.4 point difference in test scores between individuals on a 10-point scale. General attitude towards mathematics positively predicted test scores. However, more able students who were well-disposed towards mathematical computer tools achieved lower scores. Self-reported behaviours were unrelated to test scores. Detailed observation of a small number of students (N = 8) revealed that positive attitudes towards mathematics and mathematical computer tools augmented exhibited learning behaviours, and that both a positive attitude to mathematical computer tools and exhibited learning behaviours benefited tool mastery. Although tool mastery and test scores are intimately related, reflective processes appear to mediate this relationship. Promoting learning with mathematical computer tools needs to take several factors into account, including improving student attitudes, raising levels of learning behaviours, and giving sufficient opportunity for constructing new mathematical knowledge within meaningful mathematical discourse.
Keywords applications in subject areas; improving classroom teaching; interactive learning environments; pedagogical issues; secondary education
Attitudes, behaviours, math tools
3
1. Introduction Although the use of computer tools in schools is widespread, actual outcomes of employing such tools have been disappointing. While computer tools are purported to enhance the learning experience and to bring learners to higher levels of understanding, motivation, engagement and self-esteem (Deaney, Ruthven, & Hennessy, 2003; Hennessy, Ruthven, & Brindley, 2005; NCTM, 2000), they are often marginalised within existing classroom practices, or used only for repetitive, delimited activities, rather than to promote complex learning (Hennessy et al.; Hoyles, Noss, & Kent, 2004; Kirschner & Wopereis, 2003). In mathematics education also, research has shown that the potential benefits of employing mathematical computer tools are not always realised (Artigue, 2002; Guin & Trouche, 1999). For example, students may learn only to manipulate the tools rather than master the underlying concepts (Hennessy et al.). This issue is further complicated because what students learn when using such tools appears to be moderated by their attitudes towards both the subject domain and the tools, and also by the kinds of behaviours undertaken when using these tools. Galbraith and Haines (1998), for example, identified attitudes and behaviours along the dimensions of confidence, motivation and engagement, and with regard to mathematics, computers and the interaction between them, as important influences on learning with mathematical computer tools. Similarly, Pierce, Stacey, and Barkatsas (2007) reported that mathematics confidence, confidence in using technology, attitude to learning mathematics with technology, and affective and behavioural engagement contribute to the effectiveness of learning processes. Pierce and Stacey (2004) found that students with positive attitudes towards mathematics and mathematical computer tools overcame initial difficulties when using such a tool and progressed to more effective behaviours, such as using the tool to explore and develop their conceptual understanding. Negative attitudes led to attempted avoidance of the tool and a
Attitudes, behaviours, math tools
4
lack of success in using it to improve algebraic insight. In Vom Hofe’s (2001) study, students whose behaviours focused only on manipulation of the tool lost sight of meaning and reached an “intellectual dead end” (p. 117), while those exhibiting more reflective behaviours were better able to connect their work to the underlying mathematical concepts.
1.1 Aims of the study Research indicates that student attitudes towards both mathematics and mathematical computer tools, and the behaviours employed while using those tools, influence the extent to which intended learning outcomes are realised. However, the relationships between tool use, individual psychological factors and learning are not well understood (Gravemeijer, 2005). Gaining insight into these relationships should help educators and tool designers tune toolbased learning arrangements to differences between students, thereby making individual learning experiences more effective. The study presented here investigates the relationships between student attitudes, behaviours and learning outcomes when a computer tool is used to learn about a specific mathematical concept.
1.2 Theoretical background 1.2.1 Attitudes and their effects on behaviour Literature on student attitudes when learning mathematics with computer tools reveals many diverse - and sometimes incompatible - definitions of the notion of attitude (Galbraith & Haines, 1998; Hannula, 2002; Ruffell, Mason, & Allen, 1998). For this reason, the perspective adopted by this study needs to be clarified. Attitudes are seen as cognitive and affective orientations or dispositions towards an object, idea, person, situation, et cetera (Fiske & Taylor, 2008). Following common approaches in attitudinal research within mathematics education (Garcia, 2001; Townsend & Wilton, 2003), both self-concept (i.e.,
Attitudes, behaviours, math tools
5
beliefs about one’s ability to learn and perform tasks) and anxiety (i.e., feelings of tension that hinder learning processes and performance) are included in this conceptualisation. Attitudes may affect an individual’s behaviour in the presence of attitude-objects in predictable ways (Ajzen & Fishbein, 1980). This predictive relationship does not always hold, however, and the likelihood that exhibited behaviours correspond with predicted ones is higher when attitudes are stable and strongly held, embedded in the individual’s belief system, concern a domain which the individual knows well, are formed from personal, relevant experience, and are considered important by the individual (Fiske & Taylor, 2008). Two attitude-objects are distinguished in this study, namely (1) mathematics as a subject domain, and (2) the use of computer tools for learning and doing mathematics. On the basis of experiences with mathematics at school, students develop general attitudes about its nature and value and about their own abilities and interest in doing it (Boekaerts & Simons, 2003). As these attitudes concern a domain to which students have considerable personal exposure, it is likely that they may be highly predictive of behaviour when learning and doing mathematics. Second, students may have specific attitudes about using mathematical computer tools based on previous use of such tools. Even when they do not have direct experience, they may generalise their attitudes from using a computer in the personal domain to using it as a tool for mathematics, particularly if these attitudes are extremely positive or negative (Shook, Fazio, & Eiser, 2007). In that case, however, the absence of relevant direct experience may mean that such attitudes may be less predictive of behaviour. As described by Boekaerts and Simons (2003), individuals’ attitudes colour their experience in learning situations to which those attitudes apply, thereby affecting the perception of competence in meeting perceived task demands - the system of personal agency called self-efficacy (Bandura, 1997). When individuals expect to be able to meet demands, they activate a learning intention by which they are prepared to invest effort in goal-oriented
Attitudes, behaviours, math tools learning behaviours. Conversely, when they doubt their ability to meet demands, they activate a coping intention, falling back on coping behaviours (e.g., non-participation or disengagement) to restore well-being at the expense of the learning process. Coping behaviours when learning mathematics and when using mathematical computer tools have been reported (e.g., Guin & Trouche, 1999; Pierce & Stacey, 2004; Sfard, 1991); however these are not the focus of the present study and are not examined further.
1.2.2 Learning behaviours for mathematics A crucial element of goal-oriented learning is the disposition to act in an appropriate way on instructional information such that the instructional aim will be achieved (Rothkopf, 1981). Effective mathematics learning is thought to involve active engagement, ongoing discourse and reflection on one’s own and others’ actions (Gravemeijer, 1994). This is particularly important in contemporary mathematics education, where knowledge and skills are actively constructed through exploration, investigation and perseverance on a wide variety of challenging and complex problem solving tasks (NCTM, 2000). At the same time, communication and reflection are believed to stimulate modification or reorganisation of previously held ways of thinking and acting, and to enable abstraction and generalisation, allowing a higher level of learning to be reached (Gravemeijer, 1994). In short, purposefulness, investigation, reflection and communication are essential goal-oriented learning behaviours for the acquisition of mathematical knowledge and skills (NCTM; Oonk & De Goeij, 2006). It should be noted, however, that the relevance of these behaviours has still to be confirmed in the specific context of learning with mathematical computer tools.
1.3 Research framework This perspective on attitudes and learning behaviours underlies the framework of the present study. In short, the attitudes which students have towards both mathematics and
6
Attitudes, behaviours, math tools
7
mathematical computer tools may influence the kinds of behaviours they undertake when learning mathematics with such tools. Students with positive attitudes in this regard are likely to exhibit goal-oriented learning behaviours when using these tools, while those with negative attitudes are likely to employ coping behaviours and neglect the learning process. The final element of the research framework concerns learning outcomes. Recent research in mathematics education posits that the use of mathematical tools and the development of conceptual understanding are intertwined. The instrumental approach (Artigue, 2002) couples tool techniques with mental processes in the form of cognitive schemes called instrumentation schemes. The process by which the tool user develops these schemes - the instrumental genesis - is bi-directional: the tool shapes the user’s thinking while the user’s actions adapt the use of the tool (Hoyles et al., 2004); thus, instrumentation schemes contain related and co-emerging conceptual and technical aspects. It is therefore assumed here that learning outcomes may have two, interrelated forms: (1) improved understanding of the targeted mathematical concepts, henceforth referred to as conceptual understanding, and (2) technically and conceptually correct use of tool techniques, henceforth referred to as tool mastery.
1.4 Research context, questions and hypotheses The present study was subsidiary to a research project undertaken in spring 2008 by the Science and Mathematics Education Institute of a large Dutch university. In that project, a computer-based learning arrangement was used to aid secondary school students in developing the mathematical concept of function, whose principal tenets are typically difficult to comprehend (Akkoç & Tall, 2002; Sfard, 1991). Pre-algebra students often view functions as actions, i.e., localised numerical manipulations according to some formula (Briedenbach, Dubinsky, Hawks, & Nichols, 1992). The aim of the research project was to guide such students towards both a process and an object conceptualisation of function. With
Attitudes, behaviours, math tools
8
a process conceptualisation, a function is seen as a dynamic process of dependency and covariation which transforms certain objects into other ones (Briedenbach et al.). With an object conceptualisation, a function is seen as a real entity which can be recognised and manipulated as a whole (Dubinsky & Mcdonald, 2001), has several, systematically related representations (e.g., algebraic expression, table, graph), and can be part of a family with common features. The computer tool was designed to help students elaborate, refine and develop their own constructions of process and object knowledge of functions within realistic contexts offering a variety of solution strategies (Gravemeijer, 2005). Within this context, the present study addresses two issues. First, it quantifies the extent to which learning outcomes are affected by student attitudes and behaviours when using this computer tool. Second, it examines the relationships between attitudes, behaviours and learning outcomes in detail, in order to obtain qualitative insight into the factors underlying that effect. Attitudes and behaviours are frequently measured using self-reports (e.g., Pierce et al., 2007) which enable economical survey methods to be employed on a large scale. The present study also uses large-scale self-reports to address the first issue specified. Unfortunately, there is substantial evidence of discrepancy between self-reported behaviours and exhibited or observed behaviours (e.g., Veenman, Prins, & Verheij, 2003). Thus, in addressing the second issue, we focus on a small number of individual students for whom both exhibited behaviours and tool mastery - a process-related learning outcome - are observed. Through this combined approach, results are obtained which may be generalisable to larger populations of interest, while a more fine-grained view of learning processes and awareness of the level of agreement between self-reported and exhibited behaviours enable a more robust interpretation of those findings (Tobin & Fraser, 1998). Consequently, the research questions and hypotheses of this study are:
Attitudes, behaviours, math tools (1)
9
To what extent can improvements in understanding the concept of function be predicted from student attitudes towards mathematics and mathematical computer tools, and from self-reported behaviours when learning and doing mathematics? The hypothesis is that students with a more-positive attitude towards mathematics, those with a more-positive attitude towards learning mathematics with computers, and those reporting higher levels of goal-oriented learning behaviours will achieve higher understanding of the function concept from using the computer tool than students with less-positive attitudes and those reporting lower levels of such behaviours.
(2)
What are the relationships between attitudes, behaviours (both self-reported and exhibited) and learning outcomes (both improvements in conceptual understanding and tool mastery) of a small number of individual students when using the mathematical computer tool? The hypothesis here is that more-positive attitudes will augment levels of exhibited learning behaviours, and that higher learning outcomes will be attained by those students having more-positive attitudes and those exhibiting higher levels of learning behaviours. Furthermore, it is expected that there will be a discrepancy between selfreported and exhibited behaviours, but there are no specific expectations as to either magnitude or direction.
2. Material and methods 2.1 Participants For the first research question, the participants were 565 grade 7 and 8 students, aged 12 to 14 years old, in 23 classes from one Belgian and seven Dutch secondary schools. Their mathematics teachers (11 in total), who voluntarily taught one to four classes within the context of the research project, were also involved. Participating classes came from three different educational levels, namely pre-vocational education (PV), higher general secondary
Attitudes, behaviours, math tools
10
education (HG) and pre-university education (PU). Several classes combined more than one of these levels, which is common practice in the initial years of secondary education in the Netherlands. Participant characteristics are presented in Table 1.
**** INSERT TABLE 1 ABOUT HERE ****
For the second research question, eight of the participating students - four males and four females - in two different combined higher general/pre-university (HG/PU) classes served as individual cases, working in four pairs. According to Onwuegbuzie and Leech (2007), this number of individuals is sufficient for obtaining insights into process-related phenomena. These students were chosen by the two class teachers as being representative of a range of mathematical abilities in those classes.
2.2 Intervention The intervention which provided the context for this study was designed, developed and implemented within the research project described in Section 1.4 and is fully documented elsewhere1. The learning arrangement comprised eight lessons on the mathematical concept of function which replaced the corresponding lessons in the students’ regular textbook. Learning materials included electronic workbooks with embedded applets (i.e., small interactive environments accessible through the Internet) and printed workbooks. Tasks were presented within realistic contexts, requiring students to construct chains of operations and link them to different representational forms, namely tables, graphs, algebraic expressions and verbal descriptions. Four lessons were structured around use of the applets; some limited applet work was done in other lessons. Applet work was carried out in student pairs allocated by the teacher; work in the printed workbooks was done individually. Tasks not completed during the
Attitudes, behaviours, math tools
11
lessons were assigned as homework. Each lesson also contained whole-class discussion of results and learning points. At the conclusion of the series of lessons, a standardised written test was administered.
2.3 Instruments and data Student attitudes and self-reported behaviours were collected using pre-intervention questionnaires. Questionnaire items (23 in total) were derived from existing measurement instruments for these constructs, namely the Mathematics and Technology Attitudes Scale (Pierce et al., 2007) and scales developed by Galbraith and Haines (1998) for attitudes towards mathematics and technology, and Garcia (2001) for attitudes towards multimedia instruction. These were supplemented by items derived from Oonk and De Goeij’s (2006) inventory of mathematical attitudes and behaviours. Example questionnaire items are presented in Table A1 of Appendix A. To measure the attained level of understanding of the function concept, a standardised test was designed by the research project team and its content validity was verified by two of the participating teachers. Completed test papers and test scores were collected for the participating students. Covariate data concerning class educational level and teacher attitude were provided by participating teachers through pre-intervention questionnaires. Questionnaire items were derived from work by Da Ponte, Oliveira, and Varandas (2002), Goos and Bennison (2004), Hennessy et al. (2005), and from experiences of teachers who had participated in a similar earlier intervention. Example questionnaire items are presented in Table A2 of Appendix A. To measure exhibited behaviours and tool mastery, screen audio-videos of interactions with the electronic materials were made for the eight case students (working in four pairs) using Camtasia Studio 2® software (TechSmith). These screen audio-videos were collected for 17 computer sessions (one session was lost due to technical problems), with a
Attitudes, behaviours, math tools
12
total duration of 354 minutes. In addition, the electronic workbooks of all students were run and stored on the central server of the research project.
2.4 First research question: Measurement and analysis 2.4.1 Outcome variable The outcome variable was students’ attained understanding of the function concept, operationalised as the score on the standardised written test graded by the teacher from 1 (low) to 10 (high) with a passing grade of 5.5. Grading took into account both correctness of answers and quality of reasoning. Five test papers per teacher (10% of the total) were also graded by a second rater, who was an experienced mathematics teacher and a member of the project team. For this sample, Krippendorff’s alpha coefficient for interval data (Hayes & Krippendorff, 2007) was .92, which indicates high reliability of the test grades.
2.4.2 Predictors Potential predictors of individual test scores were student attitudes towards mathematics and the use of mathematical computer tools, along the dimensions of selfconcept and anxiety, and self-reported behaviours when learning and doing mathematics. Student attitudes and behaviours were operationalised as four variables containing students’ average scores on groups of questionnaire items relating to: (1) their general attitude towards mathematics (MATH, 5 items), (2) their attitude towards using computers for mathematics (TOOLS, 4 items), (3) the extent to which they reported purposeful and investigative behaviours when undertaking mathematical activities (PURINV, 6 items), and (4) the extent to which they reported reflecting upon and communicating about their thinking and actions (REFCOM, 8 items). These combinations of learning behaviours were made for the whole sample analysis because of some semantic similarity in the corresponding sub-behaviours and because of the data capacity restrictions described in Section 2.4.4.
Attitudes, behaviours, math tools
13
All items were measured using 5-point rating scales, with the range of answers from ‘strongly disagree’ to ‘strongly agree’. Scale values therefore ranged from 1 (very negative attitude/ low level of self-reported behaviour) to 5 (very positive attitude/ high level of selfreported behaviour). The midpoint represented a neutral attitude or medium level of selfreported behaviour. Table 2 presents characteristics of the attitude and behaviour scales.
**** INSERT TABLE 2 ABOUT HERE ****
For all scales there was inter-individual variability (SDs ranging from 0.49 to 0.80) across almost the full range of possible values. On average, students reported a positive general attitude towards mathematics (MATH) ( X = 3.69, SD = 0.68, N = 621) and reported exhibiting purposeful and investigative behaviours (PURINV) ( X = 3.53, SD = 0.49,
N = 621). There were no other clear tendencies found, as the average scores deviated less than one SD from the neutral scale midpoint for the remaining two scales. Reliability analysis applied a lower threshold criterion of .70 for Cronbach’s alpha coefficient, which indicates an adequate scale (Garson, 2009). The alpha coefficient for the purposeful and investigative behaviours scale (PURINV) proved to be unacceptably low so that it was excluded from further analysis. Thus, three scales were retained as predictors in the subsequent analyses: General attitude towards mathematics (MATH, α = .76), Attitude
towards using computers for mathematics (TOOLS, α = .75) and Reflective and communicative behaviours (REFCOM, α = .73). To test the construct validity of these three measures, Principal Components Analysis with Varimax rotation was performed on the relevant items. When three factors were extracted, these corresponded well with the three scales and explained 18.05%, 16.03% and 13.89% of variance respectively. Items corresponding to the MATH scale had factor loadings ranging from .54 to .80. For the TOOLS scale, loadings ranged from .61 to .84, and for the
Attitudes, behaviours, math tools
14
REFCOM scale from .48 to .66. Thus, the alignment of empirically derived factors with the theoretical scale structures provides support for the validity of the study measures.
2.4.3 Covariates The learning outcome measure was not corrected for the initial (i.e., pre-intervention) state of students’ understanding, as the workbook tasks which could have determined this were not completed by many students. However, it is reasonable to assume that participating students did not possess much directly relevant prior knowledge as the mathematical concept of function is not generally known, nor had it been previously covered in their mathematics courses beyond the introduction of basic algebraic expressions. In addition, pre-intervention interviews with the eight case students confirmed that their prior knowledge with regard to the function concept in no way approached the targeted learning outcomes. The class educational level was included as a covariate. Since teacher attitude towards the use of computer tools in mathematics education has been found to impact student outcomes through its impact on teachers’ instructional choices (Cox et al., 2003; Kendal & Stacey, 2001), this was also included as a covariate. A single scale (TEACH) was used to capture teacher attitude towards the use of mathematical computer tools (α = .84, 10 items) and scores were averaged for each individual ( X = 3.74, SD = 0.51, N = 11). Participating teachers proved to be generally positive regarding computer tool use in mathematical education, with minima and maxima of 3.00 and 4.70 respectively on a 5-point rating scale, where higher scores indicated a more-positive attitude. This is not surprising, given that participating teachers had volunteered to take part in the intervention and could therefore be expected to be favourably disposed towards using computers in their lessons.
Attitudes, behaviours, math tools
15
2.4.4 Analysis Before performing the whole sample analysis, 41 cases (7.2%) for which no attitude measurements were available were removed. In addition, three extreme outliers were also removed. Two participants had not completed the final test while the third scored extremely low on all scales. Thus, 521 students remained for inclusion in the main analysis. Normality and linearity of the data were acceptable. To facilitate interpretation of results, explanatory variables were rescaled to have a meaningful zero point. Variables corresponding to attitudes and behaviours were centred on their grand means so that zero values represented average scores. Class educational level was transformed into dummy variables, contrasting combined PV/HG, HG and combined HG/PU with PU, the reference (majority) group. For the first research question, a four-level nested structure was recognised. At the lowest level (i.e., students), attained understanding of the function concept was the outcome variable and explanatory variables were the three scales of student attitudes and behaviours described in Section 2.4.2. The second level (i.e., classes) covariate was class educational level. At the third level (i.e., teachers), the covariate was teacher attitude towards the use of mathematical computer tools. No variables were defined at the fourth level (i.e., schools). As hierarchically structured data is not correctly analysed by conventional statistical methods (Hox, 2002), multilevel analysis was used. The power of multilevel analysis is largely determined by the available sample size at each level of the nested structure, in particular at the highest level (Snijders, 2005). Although parameter estimates for regression coefficients and their standard errors may be unbiased when the number of groups in a twolevel structure is less than 30, the standard errors of second-level variances may be underestimated (Maas & Hox, 2005). Thus, real but small effects may go undetected. As it was not possible to increase the number of groups, the available power was sustained in two ways. First, the number of levels was collapsed to two - classes and students
Attitudes, behaviours, math tools
16
- and the teacher attitude covariate was reassigned to the class level. Second, the number of variables examined was limited. Nevertheless, given the fact that the number of classes was less than 30, it is possible that not all effects were detected. Several multilevel models were fitted using the MLwiN® programme. First, the intercept only one-level and two-level models were compared to ascertain whether there was variance at the class level. Then, all covariates were entered into the covariate model. First-level predictor variables (i.e., student attitudes and behaviours) were subsequently entered into the student model. Next, random slope variation was added to the significant predictors to test whether regression slopes varied across classes. As this was not the case, no cross-level interactions were tested. The direction of the research hypotheses meant that significance testing was one-sided.
2.5 Second research question: Measurement and analysis 2.5.1 Outcome variables For the eight cases, outcome variables were (a) the student’s score on the standardised written test indicated in Section 2.4.1; and (b) the extent to which the student exhibited mastery of the computer tool. Tool mastery (i.e., technically and conceptually correct use of tool techniques) was operationalised as the demonstrated global level of technical understanding and understanding of the relationship between techniques and task requirements when observed across all computer sessions. Examples of tool techniques and their correct use are provided in Table B1 of Appendix B. Mastery ratings were from 1 (low) to 10 (high), with 6 representing a medium level of mastery.
2.5.2 Independent variables The first set of independent variables contained the self-reported levels of goaloriented learning behaviours. These were operationalised as four variables containing the case student’s average scores on groups of questionnaire items relating to the extent to which
Attitudes, behaviours, math tools
17
he or she reported purposefulness (3 items), investigation (3 items), reflection (4 items), and communication (4 items). Thus, in effect, the PURINV and REFCOM scales of the whole sample analysis (see Section 2.4.2) were decomposed into the underlying individual learning behaviours for the case analysis. Again, scores ranged from 1 (low level of self-reported behaviour) to 5 (high level of self-reported behaviour), with the midpoint representing a medium level of self-reported behaviour. The second set of independent variables pertained to the global levels of purposeful, investigative, reflective and communicative behaviours exhibited by each case student when observed across all computer sessions. These behaviours were identified according to a detailed differentiation of learning behaviours derived from previous research in this area (Artigue, 2002; Boon & Drijvers, 2005; Guin & Trouche, 1999; Oonk & De Goeij, 2006; Pape, Bell, & Yetkin, 2003; Pierce & Stacey, 2004). Examples are provided in Table B2 of Appendix B. For each case, the global level of each exhibited behaviour was rated on a scale of 1 (low) to 5 (high), with the midpoint representing a medium level of exhibited behaviour.
2.5.3 Analysis The screen audio-videos of the case students’ interactions with the computer tool were transcribed and summarised. The final answers in the electronic workbooks were used to confirm transcription accuracy and whether the screen audio-videos captured the processes which led to these answers. Transcriptions were examined for evidence of tool mastery and learning behaviours. Tool mastery and the global level of each learning behaviour exhibited by each case student were rated by one of the researchers. Rating accuracy was confirmed for two cases by a second researcher, with a Krippendorff’s alpha coefficient for ordinal data (Hayes & Krippendorff, 2007) of .85 indicating good inter-rater reliability. Answers to individual questionnaire items were used to judge the consistency of specific exhibited behaviours with the case student’s self-reports. For each case, the global
Attitudes, behaviours, math tools
18
level of each exhibited learning behaviour was also compared with the case’s self-report. Then, for all eight cases together, Wilcoxon signed ranks tests were used to determine the correspondence between self-reported and exhibited behaviours. As the research hypothesis had no direction, significance testing was two-sided. Next, the associations between attitudes, exhibited learning behaviours and learning outcomes were calculated as Spearman’s rankorder correlation coefficients. The direction of the research hypotheses meant that significance testing was one-sided. The non-parametric methods used are suitable for smallsample, ordinal data (Siegel & Castellan, 1988).
3. Results
3.1 First research question Comparison of model-fit of the one- and two-level intercept only models revealed significant variance at class level (χ²(1) = 108.57, p < .001). Thus, a two-level hierarchical structure is relevant, justifying the use of multilevel analysis. The intraclass-correlation, indicating the proportion of variance at class level, was .27 - a medium effect. Table 3 presents parameter estimates for the tested models.
**** INSERT TABLE 3 ABOUT HERE ****
In the covariate model, teacher attitude towards the use of computer tools in mathematics education (TEACH) proved not to be associated with test scores (B = -0.38,
SE = 0.37, p = .15). Class educational level accounted for 40.6% of the variance at class level, which is a very large effect. In the student model, the regression coefficients for student attitudes towards mathematics (MATH) and towards using computers for learning mathematics (TOOLS) were both significant (B = 0.61, SE = 0.09, p < .001 and B = -0.23,
SE = 0.08, p < .01 respectively). Thus, general attitude towards mathematics positively
Attitudes, behaviours, math tools
19
predicts test scores but scores are lower when students have a more-positive attitude towards using computers in the mathematics lesson. Together, these predictors explain 8.9% of variance at student level and 16.1% at class level, which are medium effects. Students’ selfreported reflective and communicative behaviours (REFCOM) appear to have no influence on test scores (B = -0.07, SE = 0.11, p = .27). Testing for random slopes indicated no significant variance in the regression slope of any first-level predictors across classes. Thus, the student model serves as the final model, explaining 20.2% of the total variance - a moderately large effect - and with a model-fit which is significantly better than that of the
intercept only model (χ²(5) = 79.55, p < .001). These results mean that pre-university (PU) students with average attitudes obtain 6.88 points (SE = 0.20) out of a possible 10 on the final test. By comparison, students from classes with lower educational levels have lower outcomes: combined higher general/preuniversity (HG/PU), higher general (HG), and combined pre-vocational/higher general (PV/HG) scoring respectively 0.77 (SE = 0.30, p < .01), 0.69 (SE = 0.49, p < .10) and 2.09 (SE = 0.51, p < .001) points lower on the final test. These effects are mitigated by two kinds of student attitudes. First, test scores are 0.61 points (SE = 0.09, p < .001) higher when general attitude towards mathematics (MATH) increases by 1 point on a 5-point scale, equivalent to a 2.44 point difference in test scores between the least and the most positive students on a 10-point final test. In addition, a 1 point increase in attitude towards using computers for learning mathematics (TOOLS) lowers test scores by 0.23 points (SE = 0.08, p < .01), giving a difference of 0.92 points on a 10-point final test between students with the most and the least favourable attitudes in this respect. Taken together, these attitudes could potentially account for a 3.36 point difference in test scores between individuals (out of a maximum score of 10 points), which far exceeds the difference in scores accounted for by class educational level alone.
Attitudes, behaviours, math tools
20
The standardised coefficients show that general attitude towards mathematics (βMATH = .25) is a stronger predictor of final test scores than is attitude towards mathematical computer tools (βTOOLS = -.11). These are medium and small effects with post-hoc power of 100% and 88.7% respectively. However, taking into account that the final model explains only 20.2% of total variance, we recognise that, while the model has predictive power, a considerable amount of variance remains unexplained. Residuals analysis and ANOVA with post-hoc comparisons indicated that assumptions of normality and homoscedasticity were met, with the exception of one HG/PU class in which test scores were lower than those of the other classes at that educational level (F(7) = 4.20, p < .001). Thus, the analyses were repeated excluding this class. The obtained results were very similar, with the exception of the regression coefficient for HG/PU classes, which rose from -0.77 (SE = 0.30, p < .01) to -0.64 (SE = 0.31, p < .05). This indicates that the apparently lower performance by HG/PU classes compared to HG classes, which is an anomaly considering their ability levels, is attributable to the performance of that one class. To further investigate the effects of student attitudes, Pearson correlation coefficients were calculated between test scores, attitude towards mathematics (MATH) and attitude towards using computers for learning mathematics (TOOLS). Results are given in Table 4.
****INSERT TABLE 4 ABOUT HERE ****
For all educational levels, more-positive general attitudes towards mathematics are moderately to strongly associated with higher test scores. In addition, attitude towards using computers for learning mathematics has a moderate negative relation with test score in higher ability (PU and HG/PU) classes but has no effect in lower ability (HG and PV/HG) classes. Finally, these two types of attitudes are strongly and positively related in the lowest ability (PV/HG) classes but have no relation at other educational levels. These results mean that
Attitudes, behaviours, math tools
21
students at higher educational levels who are well disposed towards using mathematical computer tools achieve lower test scores. Furthermore, lower-ability students hold congruent attitudes towards both mathematics and mathematical computer tools, but their attitude towards tools does not affect their test performance.
3.2 Second research question The eight case students, working in four pairs, were from two combined higher general/pre-university level (HG/PU) classes. Students in HG/PU classes had no significant response tendency with regard to attitudes towards mathematics or mathematical computer tools (MATH: X = 3.62, SD = 0.80, N = 196; TOOLS: X = 3.73, SD = 0.80, N = 192) and, discounting the one class with anomalous results, those with average attitudes obtained 6.24 out of 10 points on the final test. An overview of the attitudes, self-reported behaviours and test scores of the eight cases is presented in Table 5, with pseudonyms used to ensure anonymity. Ratings of exhibited behaviours and tool mastery are presented in Table 6. Full case descriptions to substantiate these ratings are available from the corresponding author.
**** INSERT TABLE 5 ABOUT HERE ****
**** INSERT TABLE 6 ABOUT HERE ****
3.2.1 Attitudes Only one of the case students held a negative general attitude to mathematics; we were told by the teacher that she suffered from mathematics anxiety. The other students were positive to highly positive about mathematics. Two of the cases were neutral towards mathematical computer tools; the remainder were positive to highly positive about such tools.
Attitudes, behaviours, math tools
22
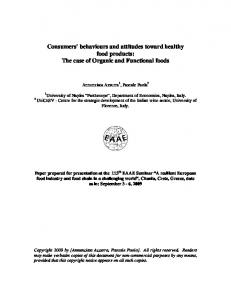
3.2.2 Self-reported and exhibited behaviours With the exception of purposefulness, the case students tended to overestimate their self-reported learning behaviours when compared to exhibited behaviours. Wilcoxon signed ranks tests (two-sided) indicate that this discrepancy is significant for investigation (p < .05) and a tendency for reflection (p = .11) and communication (p = .11). There is no discrepancy for purposefulness (p = .29). A graphical representation of self-reported and exhibited behaviours for each case is presented in Figure 1, with the scale of each axis reflecting the range of scores (maximum = 5 points).
**** INSERT FIGURE 1 ABOUT HERE ****
It can be seen that the case students exhibited more purposefulness than other types of learning behaviours. Only one of them showed less than a medium level of purposefulness, exhibiting off-task behaviour. The remaining students were generally focused, striving to follow task instructions and verifying their work. As tasks increased in difficulty, however, some of the students began to flounder. For the other types of learning behaviours, exhibited levels were most often medium to low (3 points or less). While there was variability across the range of investigative and reflective behaviours, communication seemed to be at one of two levels: low (1 point) or rather high (4 points). With respect to exhibited investigation, students with low levels tended to give superficial and ‘quick’ answers, often drawing conclusions from single instances. They also seemed to prefer adhering to a single technique, even when this was not the most appropriate for the task. These students followed task instructions strictly, which frequently led to them working automatically. Students demonstrating medium levels of investigation showed they wanted to understand the tasks and occasionally tried different ways of doing things but did
Attitudes, behaviours, math tools
23
not display creativity or adaptability. Students with high exhibited levels spent time investigating problem solutions, exploring behavioural effects of different functions, and spontaneously using concrete materials to explore situations and support their reasoning. Students exhibiting low levels of reflection tended to give simplistic answers, getting stuck on certain ideas and having difficulty moving past specific situations and examples. They did not appear to challenge and extend their prior knowledge as a consequence of obtaining unexpected results. One student appeared able to reflect on the implications of task results, but only when prompted by the teacher or the observer. Students exhibiting high levels of reflection seemed willing and able to evaluate results, to think about problems in a new way and to construct new mathematical relationships. One also spontaneously tried to connect mathematical content to real-life situations. In regard to exhibited communication, all of the case students had difficulty using and understanding formal mathematical language; indeed, their written answers to the computer tasks did not reflect the richness of some of the preceding discussions. Students generally exhibited a level of communicative behaviour which matched that of their partner. One pair’s conversations contained much banter, keeping them at a superficial level of communication. Another pair discussed possible solutions to more difficult tasks, but did not build upon each other’s ideas. The pair who communicated well with each other actively discussed each others’ reasoning and sometimes went on to talk about mathematical and situational content, such as the meaning of coordinates displayed on a graph. There were discrepant levels of communication with only one pair, Mary and John. John appeared reluctant to build on Mary’s ideas and tried to impose his own. He reported not to set great store by discussion but to prefer sharing his own solutions. Mary did not allow herself to be overruled, however, and argued her opinions, forcing John to acknowledge her ideas. This was consistent with her self-report of seeing two-way communication as important.
Attitudes, behaviours, math tools
24
3.2.3 Learning outcomes Six of the eight case students demonstrated at least a medium degree of tool mastery, showing understanding of both tool techniques and the underlying mathematics. Two cases appeared not to have understood the technique-task relationship, confusing parameters and restricting their tool use to the simplest techniques. Attained level of tool mastery was, however, not necessarily consistent with the amount of time spent in control of the tool: Kim and John both monopolised the tool during the computer sessions but achieved greatly different levels of tool mastery. With respect to understanding of the function concept, it appeared that the conceptual and technical understanding which some students demonstrated while using the tool did not necessarily translate to high test scores. Other students appeared to retain an action-based conceptualisation of function, reasoning in the final test on the basis of number substitution instead of function behaviours. Almost all of the students were unable to use precise mathematical language to describe the behaviours and features of graphs in the final test.
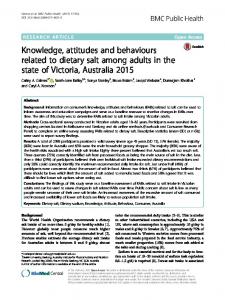
3.2.4 Attitudes, exhibited behaviours and learning outcomes Table 7 presents the Spearman rank-order correlation coefficients for the relationships between attitudes, exhibited behaviours and learning outcomes for the eight cases. Attitudes towards mathematics and mathematical computer tools are unrelated, which is consistent with findings for HG/PU classes in the whole sample. Attitude towards mathematics is moderately to strongly positively correlated with exhibited purposefulness and communication, while attitude towards mathematical computer tools has strong positive correlations with exhibited investigation and reflection. Attitudes are not related to test scores of these students. Attitude towards mathematics is also unrelated to tool mastery; however, there is a strong, positive correlation between attitude towards mathematical computer tools and tool mastery. Figure 2
Attitudes, behaviours, math tools
25
shows that attitudes are associated with a greater spread of tool mastery scores than of test scores, indicating that attitudes may have more varying effects on tool mastery than on test scores.
**** INSERT TABLE 7 ABOUT HERE ****
**** INSERT FIGURE 2 ABOUT HERE ****
Turning to the relationships between exhibited behaviours and learning outcomes, only reflection is correlated with test scores in a positive sense. With the exception of communication, individual behaviours have a moderate to strongly positive correlation with tool mastery. Figure 3 shows that exhibited behaviours are associated with greater variability in tool mastery scores than in test scores, indicating that exhibited behaviours - like attitudes may affect tool mastery more differentially than test scores. Finally, there is a moderate, positive correlation between tool mastery and test scores.
**** INSERT FIGURE 3 ABOUT HERE ****
4. Conclusions and discussion The present study provides some intriguing insights into the relationships between tool use, learning processes and outcomes, and individual mediating factors in the form of attitudes and behaviours. The findings indicate patterns which support previous research in this area while at the same time bringing forth worthwhile new avenues for further investigation.
Attitudes, behaviours, math tools
26
4.1 Answer to the first research question The first research question focused on the extent to which improvements in conceptual understanding can be predicted from student attitudes towards mathematics and mathematical computer tools, and from self-reported behaviours when learning and doing mathematics. It was found that, irrespective of educational level, student attitudes towards mathematics and mathematical computer tools - in terms of self-concept and anxiety - may together account for almost 3.4 points difference between individuals in understanding the concept of function, on a 10-point scale. As expected, students with a more-positive attitude towards mathematics had higher test scores. However, there was an unexpected negative effect of attitude towards mathematical computer tools. Students from higher educational levels with a more-positive attitude towards such tools achieved lower test scores. This finding recalls Guin and Trouche’s (1999) report that students who are highly attached to a tool are often less well able to construct an efficient and objective relationship with it than those who are less willing to use it. This effect - henceforth referred to as the interest reversal effect - is similar to the expertise reversal effect (Kalyuga, Ayres, Chandler, & Sweller, 2003), which holds that instructional methods that are highly effective with novice learners can lose their effectiveness and even have negative effects when used with more experienced learners. Finally, self-reported behaviours were unrelated to test scores.
4.2 Answer to the second research question The second research question concerned the relationships between attitudes, behaviours and learning outcomes of a small number of individual students (cases) when using the mathematical computer tool. The aim was to obtain qualitative insight into the factors underlying the effects of attitudes and behaviours on learning outcomes. First, it was found that attitude towards mathematics is associated with different behaviours than is
Attitudes, behaviours, math tools
27
attitude towards mathematical computer tools. This suggests that these two kinds of attitudes have different effects when learning with mathematical computer tools, as will be seen in the following. The associations between attitude towards mathematics, attitude towards mathematical computer tools and test scores found in the whole sample were not replicated in the cases. This is likely a consequence of the small number of cases, given that these effects were not strong in the whole sample. However, four of the five cases with a highly positive attitude towards mathematics also proved to have a good understanding of tool techniques and of their relationship to task requirements (i.e., tool mastery). These students, thus, appear to have achieved a sound basis for further progress. It is probable that, in the whole sample, such students were generally able to translate this basis into high test scores. This is supported by the finding that higher test scores of the case students were accompanied by higher levels of tool mastery. The cases also shed light on the interest reversal effect found in the whole sample. It is possible that abler students who are well-disposed to mathematical computer tools prioritise technical aspects over learning. Indeed, case students with a more-positive attitude towards mathematical computer tools were eager to take control of the tool and were quicker to gain proficiency with it. This finding is consistent with that of Pierce and Stacey (2004). Yet, two cases that were highly positive towards mathematical computer tools obtained only near average or lower than average scores on the final test. These students exhibited relatively low levels of reflection and communication. This suggests that, while such students are willing and able to use mathematical computer tools, they may do so in an isolated and unthinking way, which may prevent them from rising above manipulation of the tool to construct new mathematical understanding. This notion is supported by the finding that lower levels of reflection negatively affected test scores for the case students.
Attitudes, behaviours, math tools
28
The finding that self-reported behaviours are unrelated to test scores in the whole sample has several possible explanations which can be tested on the basis of the cases: (1) self-reports do not predict actual behaviours for mathematics learning, as hypothesised, and/or (2) general learning behaviours are less relevant for effective learning from mathematical computer tools, and/or (3) the behaviours which students normally exhibit when learning and doing mathematics do not transfer to situations involving computer tools. The first explanation is supported by the cases. As expected, exhibited learning behaviours - other than purposefulness - were not reliably predicted by self-reports. Specifically, the case students tended to overestimate the extent to which they employ these behaviours. The second explanation (i.e., relevance of general learning behaviours) is not sustained by the cases. Although three of the four exhibited behaviours were unrelated to test scores, three did appear to benefit tool mastery, as expected. This suggests that, even if general learning behaviours may not always directly translate to effective test performance, they nevertheless contribute to understanding the relationship between techniques and task requirements which, according to instrumentation theory (Artigue, 2002), is bound up with the construction of mathematical knowledge. It also suggests that students who exhibit low levels of learning behaviours may not achieve appropriate and insightful use of mathematical computer tools. In other words, the instrumental genesis of such students may be at risk. The third explanation (i.e., non-transfer of behaviours) is consistent with the cases. Given that computer tools increase possibilities for exploration and investigation in collaboration with others (Hennessy et al., 2005), it is possible that learning processes when using such tools are more affected by the quality of the dialogue which students establish with their learning partners than in traditional mathematical classroom situations. Moreover, as the intervention was quite different to the students’ regular mathematics lessons with established rules about expected conduct, it is possible that the students acted in ways which
Attitudes, behaviours, math tools
29
do not correspond to their usual classroom behaviours. Additional support for non-transfer of behaviours is found in the literature. Pierce and Stacey (2004) indicated that what students do with technology does not necessarily concur with their normal repertoire for learning and doing mathematics. Farrell (1996) also reported that students’ behaviours are different when using technology than when doing conventional mathematics.
4.3 Implications for students Taken together, it seems that student attitudes towards mathematics and mathematical computer tools have a moderate impact on the extent to which intended learning outcomes of using such a tool are realised, in terms of both improved insight into the targeted mathematical concepts and technically and conceptually correct use of tool techniques. However, the picture of how student behaviours relate to learning outcomes is more complex. On the one hand, goal-oriented learning behaviours may contribute strongly to the attainment of tool mastery. On the other, neither self-reported nor exhibited learning behaviours - other than reflection - appear to impact test performance. This suggests a discrepancy between the mechanisms underlying attainment of tool mastery and those underlying effective test performance. However, there are several indications that this discrepancy may not be mechanistic but rather temporal. First, tool mastery was found to be associated with test scores, which is consistent with the premise that both types of learning outcomes are intimately related (Artigue, 2002; Hoyles et al., 2004). Second, both attitudes and exhibited behaviours seem to have more differential and/or stronger effects on tool mastery than on test scores, suggesting a more direct pathway to tool mastery than to conceptual understanding. In other words, rather than technical and conceptual aspects co-emerging, as predicted by instrumentation theory (Artigue), it may be the case that the construction of new mathematical knowledge requires a process of reflection on the understanding acquired about tool techniques and their
Attitudes, behaviours, math tools
30
relationship to mathematical tasks. This notion is related to the concept of the emergence of models for reasoning out of a process of a posteriori generalisation (in a reflective, connective sense) and formalisation of models which students themselves generate while solving problems (Gravemeijer, 1994). The possibly crucial role of reflection is supported by the finding that students with higher levels of reflection had better understanding of the function concept - as evidenced by their test scores - and by Vom Hofe’s (2001) report that more reflective students are better able to connect tool work to mathematical concepts. We propose that this process of reflection requires more time than that which was available to the students in this study. This means that students’ learning with mathematical computer tools needs to be extended across more protracted periods. Taken together, our findings indicate that promoting learning with mathematical computer tools must take several factors into account at the same time. These include improving student attitudes, raising levels of goal-oriented learning behaviours, and giving sufficient opportunity for constructing new mathematical knowledge from acquired tool mastery. Perhaps most important for this last point is the need for students to embed tool use within meaningful mathematical discourse, in which developing ideas are reflected upon, discussed and built upon with others (Doorman et al., 2009). As Artigue (2002) argued, “any technique, if it is to become more than a mechanically-learned gesture, requires some accompanying theoretical discourse” (p. 261).
4.4 Implications for design and implementation of mathematical computer tools A second potential explanation for the interest reversal effect is that students who are well-disposed to mathematical computer tools may have high expectations based on previous experiences with such tools. If a tool does not live up to expectations, students may dismiss its worth and disengage from the learning experience. This means that designers of mathematical computer tools should be aware of the tools which are commonly available to
Attitudes, behaviours, math tools
31
students and ensure that their products are at least comparable in terms of attractiveness and sophistication. Furthermore, students need to be allowed to translate tool mastery to improved mathematical insight over more extended periods. Tool designers, therefore, need to provide integral and integrated learning arrangements, offering ergonomically compatible applications in several mathematical domains extending across several years, which can be embedded within classroom practices. Teachers also have a crucial role to play in realising classroom environments which are conducive to productive tool use. First, they must enable effective tool-related practices in their classrooms. Particularly, students who exhibit low levels of goal-oriented learning behaviours - for whom the process of instrumental genesis may be at risk - must be supported. Teachers are also indispensable for helping students marry technical with conceptual competence (Guin & Trouche, 1999; Kendal & Stacey, 2001) and for elevating students’ proficiency with mathematical language by ensuring that the necessary discourse takes place. An important part of this discourse involves enabling a convergence of the individual conceptions which students develop while learning mathematics (Sherin, 2002) and, in particular, while using mathematical computer tools (Drijvers et al., 2009).
4.5 Implications for theory and recommendations for future research The case findings indicate that more-positive attitudes towards mathematics and mathematical computer tools are moderately to strongly related to higher exhibited levels of goal-oriented learning behaviours. It appears, therefore, that the research framework presented in Section 1.3 concerning the relationship between attitudes and learning behaviours is reasonably confirmed and appropriate for understanding the specific situation of learning mathematics with computer tools. However, discrepancies between self-reported and exhibited learning behaviours and the lack of a clear relationship between learning behaviours and test performance indicate
Attitudes, behaviours, math tools
32
that more research is needed which uses more reliable measures than self-report to identify exactly what kinds of behaviours are relevant in this kind of learning situation and why. In this respect, it is important to know which behaviours affect the quality of the process of instrumental genesis and how these effects are realised. To that end, it would be worthwhile to further develop the behavioural profiles identified by Guin and Trouche (1999), who distinguished various approaches adopted by students using symbolic calculators in relation to their learning gains. Furthermore, student attitudes and behaviours have been found to be influenced by school and classroom factors (Samuelsson & Granström, 2007; Webster & Fisher, 2003). To our knowledge, these effects have not been fully investigated in the context of learning mathematics with computer tools and thus should be addressed in future research. A next step would be to investigate how taking account of all these factors in the design and tuning of computer-based learning arrangements could be employed to favourably change student attitudes and behaviours as well as improving learning outcomes. Townsend and Wilton’s (2003) research, for example, indicates that tertiary level students’ attitude towards mathematics, which is often negative and resistant to change, can be improved by cooperative learning in a supportive learning environment. Formative intervention (Engeström, 2008) may be appropriate for this purpose, whereby the course and content of the learning arrangement is open to negotiation and reshaping, so that the agency of the participants can be explicitly incorporated in the research design.
4.6 Limitations The conclusions and interpretations presented here are necessarily tempered by certain limitations of the study. First, the sample was not sufficiently large to ensure that all effects were detected. The results of this study should therefore be tested by future research compatible in design and methods to this study. In this way, the available database can be
Attitudes, behaviours, math tools
33
augmented, thereby permitting analysis on a greater scale. Secondly, the scale for measuring purposeful and investigative behaviours did not achieve sufficient reliability to be included in the whole sample analysis. It is possible that the items used in this study lost strength in translation from English to Dutch. As the case analysis suggests that these behaviours do play a role in learning, future research should aim to obtain a reliable and valid scale for use in Dutch secondary schools. Finally, none of the case students had extremely negative attitudes or extremely low levels of self-reported learning behaviours, although these did occur in the overall sample. It was, therefore, not possible to explore the learning processes of such students and findings cannot be generalised to individuals at that end of the spectrum.
Acknowledgements The authors thank Peter Boon, Michiel Doorman and Sjef van Gisbergen for their contributions to this study, and Erlijn van Genuchten, Renske de Kleijn and Haytske Zijlstra for their helpful comments on earlier versions of this article.
Footnote 1
“Tool Use in an Innovative Learning Arrangement for Mathematics” (NWO-PROO project
number 411-04-123). For details, see Drijvers, Doorman, Boon, Van Gisbergen, and Gravemeijer (2007) and the research project website http://www.fi.uu.nl/tooluse/en.
Attitudes, behaviours, math tools
34
Appendix A. Example items student and teacher questionnaires Table A1
Example items student questionnaire Scale name: Derived from
Itema,b
General attitude towards mathematics: I enjoy doing mathematics.
Galbraith and Haines (1998)
Attitude towards using computers for mathematics: I like using a computer for mathematics.
Pierce et al. (2007)
Having to use a computer in the mathematics lesson
Garcia (2001)
makes me uneasy.
Purposeful and investigative behaviours: I like to test my understanding of mathematics by
Galbraith and Haines (1998)
doing a diagnostic exercise. If I can’t solve a mathematics problem in one way I
Pierce et al. (2007)
try a different solution.
Reflective and communicative behaviours: If I don’t understand something in the mathematics
Galbraith and Haines (1998)
lesson I carry on thinking about it afterwards. I like to share my solutions with others.
Oonk and De Goeij (2006)
Note. a English-language items were translated to Dutch for this study. b
Items were measured using 5-point rating scales, with the range of answers from ‘strongly
disagree’ to ‘strongly agree’.
Attitudes, behaviours, math tools
35
Table A2
Example items teacher questionnaire Itema,b
Derived from
ICT helps students experience things actively.
Da Ponte et al. (2002)
ICT makes calculations and manipulations easier.
Goos & Bennison (2004)
ICT can help students develop understanding and insight.
Da Ponte et al. (2002); Goos & Bennison (2004); Hennessy et al. (2005)
A danger of ICT is that students get hung up on the
Hennessy et al. (2005)
techniques.
Note. a English-language items were translated to Dutch for this study. b
Items were measured using 5-point rating scales, with the range of answers from ‘strongly
disagree’ to ‘strongly agree’.
Attitudes, behaviours, math tools
36
Appendix B. Example tool techniques and learning behaviours Table B1
Example Tool Techniques Technique
Correct use of technique
Arrow chain
The student knows how to make or change an arrow chain. He or she can add, connect and position input/output boxes and operations boxes in the right order to answer the task. He or she understands the difference between inputting a number and inputting a variable. He or she understands how to change values in operations boxes.
Break-even
The student knows how to determine a break-even point by combining other
point
techniques, such as making an arrow chain, making a table or graph, scrolling and zooming in.
Line graph
The student knows how and when to obtain a line graph in order to extrapolate, compare functions or find points of intersection.
Zoom in and out The student knows how to use the zoom buttons in the table or graph to change the steps in a table or the scale of the graph so that the necessary information is suitably displayed. Labels
The student knows how to make and change input and output labels, and uses them to help organize his or her thinking.
Attitudes, behaviours, math tools
37
Table B2
Example Learning Behaviours Learning Behaviour Specific form of behaviour
Purposeful: Perseveres with a task until it is solved. Focuses on task. Trial-and-improve: tries an answer and uses the feedback to get closer to the solution.
Investigative: Tries to really understand what the task is about. Shows creativity in solving problems. Tries to find different ways to do things.
Reflective: Tries to connect mathematical content to daily life. Continues to think about content which has not been understood. Tries to construct mathematical understanding from what is being/has been learned.
Communicative: Actively listens to others’ solutions. Talks to others about mathematical content of tasks. Shares solutions with others.
Attitudes, behaviours, math tools
38
References Ajzen, I., & Fishbein, M. (1980). Understanding attitudes and predicting social behavior. Englewood Cliffs, NJ: Prentice-Hall. Akkoç, H., & Tall, D. (2002). The simplicity, complexity and complication of the function concept. In A. D. Cockburn & E. Nardi (Eds.), Proceedings of the 26th Conference of
the International Group for the Psychology of Mathematics Education, 2 (pp. 25-32). Norwich, UK: PME. Artigue, M. (2002). Learning mathematics in a CAS environment: The genesis of a reflection about instrumentation and the dialectics between technical and conceptual work.
International Journal of Computers for Mathematical Learning, 7, 245-274. Bandura, A. (1997). Self-efficacy: The exercise of control. New York: Freeman. Boekaerts, M., & Simons, P. R-J. (2003). Leren en instructie: Psychologie van de leerling en
het leerproces [Learning and instruction: Psychology of the learner and the learning process] (3rd edition). Assen, The Netherlands: Koninklijke Van Gorcum. Boon, P., & Drijvers, P. (2005). Algebra en applets, leren en onderwijzen [Algebra and applets, learning and teaching]. Utrecht, The Netherlands: Freudenthal Institute/ICOISOR. Briedenbach, D., Dubinsky, E., Hawks, J., & Nichols, D. (1992). Development of the process conception of function. Educational Studies in Mathematics, 23, 247-285. Cattell, R. B. (1966). The scree test for the number of factors. Multivariate Behavioral
Research, 1, 245-276. Cox, M., Webb, M., Abbott, C., Blakeley, B., Beauchamp, T., & Rhodes, V. (2003). ICT and
pedagogy: A review of the research literature. London: Becta. Da Ponte, J. P., Oliveira, H., & Varandas, J. M. (2002). Development of pre-service mathematics teachers’ professional knowledge and identity in working with
Attitudes, behaviours, math tools
39
information and communication technology. Journal of Mathematics Teacher
Education, 5, 93-115. Deaney, R., Ruthven, K., & Hennessy, S. (2003). Pupil perspectives on the contribution of information and communication technology to teaching and learning in the secondary school. Research Papers in Education, 18, 141-165. Doorman, M., Drijvers, P., Boon, P., Van Gisbergen, S., Gravemeijer, K., & Reed, H. (2009).
Tool use and conceptual development: an example of a form-function shift. Manuscript in preparation, Freudenthal Institute, University of Utrecht. Drijvers, P., Doorman, M., Boon, P., Van Gisbergen, S., & Gravemeijer, K. (2007). Tool use in a technology-rich learning arrangement for the concept of function. In D. PittaPantazi & G. Philippou (Eds.), Proceedings of the Fifth Congress of the European
Society for Research in Mathematics Education CERME5 (pp. 1389-1398). Larnaca, Cyprus: University of Cyprus. Drijvers, P., Doorman, M., Boon, P., Van Gisbergen, S., Reed, H., & Gravemeijer, K. (2009).
The teacher and the tool: whole-class teaching behaviour in the technology-rich mathematics classroom. Manuscript in preparation, Freudenthal Institute, University of Utrecht. Dubinsky, E., & Mcdonald, M. A. (2001). APOS: A constructivist theory of learning in undergraduate mathematics education research. In D. Holton (Ed.), The teaching and
learning of mathematics at university level: An ICMI study (pp. 275-282). Dordrecht, The Netherlands: Kluwer Academic Publishers. Engeström, Y. (2008). From design experiments to formative interventions. Proceedings of
the Eighth International Conference for the Learning Sciences - ICLS 2008, Volume 1, 3-24.
Attitudes, behaviours, math tools
40
Farrell, A. M. (1996). Roles and behaviors in technology-integrated precalculus classrooms.
Journal of Mathematical Behavior, 15, 35-53. Fiske, S. T., & Taylor, S. E. (2008). Social cognition: From brains to culture. New York: McGraw-Hill. Galbraith, P., & Haines, C. (1998). Disentangling the nexus: Attitudes to mathematics and technology in a computer learning environment. Educational Studies in Mathematics,
36, 275-290. Garcia, J. F. C. (2001). An instrument to help teachers assess learners’ attitudes towards multimedia instruction. Education, 122, 94-101. Garson, G. D. (2009). Reliability Analysis. Retrieved March 30, 2009, from http://www2.chass.ncsu.edu/garson/pa765/reliab.htm Goos, M., & Bennison, A. (2004, November). Teachers’ use of technology in secondary
school mathematics classrooms. Paper presented at the annual conference of the Australian Association for Research in Education, Melbourne, Australia. Gravemeijer, K. P. E. (1994). Developing Realistic Mathematics Education. Utrecht, The Netherlands: CD-β Press. Gravemeijer, K. P. E. (2005). PROO application 411-04-123, Tool use in innovative learning
arrangements for Mathematics. Retrieved November 30, 2007, from http://www.fi.uu.nl/tooluse/en/docs/411-04-123AanmeldingToelichting.pdf Guin, D., & Trouche, L. (1999). The complex process of converting tools into mathematical instruments: The case of calculators. International Journal of Computers for
Mathematical Learning, 3, 195-227. Hannula, M. S. (2002). Attitude towards mathematics: emotions, expectations and values.
Educational Studies in Mathematics, 49, 25-46.
Attitudes, behaviours, math tools
41
Hayes, A. F., & Krippendorff, K. (2007). Answering the call for a standard reliability measure for coding data. Communication Methods and Measures, 1, 77-89. Hennessy, S., Ruthven, K., & Brindley, S. (2005). Teacher perspectives on integrating ICT into subject teaching: commitment, constraints, caution, and change. Journal of
Curriculum Studies, 37, 155-192. Hoyles, C., Noss, R., & Kent, P. (2004). On the integration of digital technologies into mathematics classrooms. International Journal of Computers for Mathematical
Learning, 9, 309-326. Hox, J. (2002). Multilevel analysis: Techniques and applications. Mahwah, NJ: Lawrence Erlbaum Associates. Kalyuga, S., Ayres, P., Chandler, P., & Sweller, J. (2003). The expertise reversal effect.
Educational Psychologist, 38, 23–31. Kendal, M., & Stacey, K. (2001). The impact of teacher privileging on learning differentiation with technology. International Journal of Computers for Mathematical
Learning, 6, 143-165. Kirschner, P., & Wopereis, I. G. J. H. (2003). Mindtools for teacher communities: a European perspective. Technology, Pedagogy and Education, 12, 105-124. Maas, C. J. M., & Hox, J. J. (2005). Sufficient sample sizes for multilevel modeling.
Methodology, 1, 86-92. National Council of Teachers of Mathematics (NCTM). (2000). Principles and standards for
school mathematics. Reston, VA: National Council of Teachers of Mathematics. Onwuegbuzie, A. J., & Leech, N. L. (2007). A call for qualitative power analyses. Quality &
Quantity, 41, 105-121. Oonk, W., & De Goeij, E. (2006). Wiskundige attitudevorming [Mathematical attitude development]. Panama-Post. Rekenwiskundeonderwijs: Onderzoek, ontwikkeling,
Attitudes, behaviours, math tools
42
praktijk [Arithmetic and mathematics education: Research, development, practice], 25(4), 37-39. Pape, S. J., Bell, C. V., & Yetkin, I. E. (2003). Developing mathematical thinking and selfregulated learning: A teaching experiment in a seventh-grade mathematics classroom.
Educational Studies in Mathematics, 53, 179-202. Pierce, R., & Stacey, K. (2004). A framework for monitoring progress and planning teaching towards the effective use of computer algebra systems. International Journal of
Computers for Mathematical Learning, 9, 59-93. Pierce, R., Stacey, K., & Barkatsas, A. (2007). A scale for monitoring students’ attitudes to learning mathematics with technology. Computers & Education, 48, 285-300. Rothkopf, E. Z. (1981). A macroscopic model of instruction and purposive learning: An overview. Instructional Science, 10, 105-122. Ruffell, M., Mason, J., & Allen, B. (1998). Studying attitude to mathematics. Educational
Studies in Mathematics, 35, 1-18. Samuelsson, J., & Granström, K. (2007). Important prerequisites for students’ mathematical achievement. Journal of Theory and Practice in Education, 3, 150-170. Sfard, A. (1991). On the dual nature of mathematical conceptions: Reflections on processes and objects as different sides of the same coin. Educational Studies in Mathematics,
22, 1-36. Sherin, M. G. (2002). A balancing act: developing a discourse community in a mathematics classroom. Journal of Mathematics Teacher Education, 5, 205-233. Shook, N. J., Fazio, R. H., & Eiser, J. R. (2007). Attitude generalization: Similarity, valence, and extremity. Journal of Experimental Social Psychology, 43, 641-647. Siegel, S., & Castellan, N. J., Jr. (1988). Nonparametric statistics for the behavioural
sciences (2nd Edition). New York: McGraw-Hill.
Attitudes, behaviours, math tools
43
Snijders, T. A. B. (2005). Power and sample size in multilevel modeling. In B. S. Everitt & D. C. Howell (Eds.), Encyclopedia of Statistics in Behavioral Science, Volume 3 (pp. 1570-1573). Chichester, UK: Wiley. Tobin, K., & Fraser, B. J. (1998). Qualitative and quantitative landscapes of classroom learning environments. In B. J. Fraser & K. G. Tobin (Eds.), International handbook
of science education (pp. 623-640). Dordrecht, The Netherlands: Kluwer Academic Publishers. Townsend, M., & Wilton, K. (2003). Evaluating change in attitude towards mathematics using the ‘then-now’ procedure in a cooperative learning programme. British Journal
of Educational Psychology, 73, 473-487. Veenman, M. V. J., Prins, F. J., & Verheij, J. (2003). Learning styles: Self-reports versus thinking-aloud measures. British Journal of Educational Psychology, 73, 357-372. Vom Hofe, R. (2001). Investigations into students’ learning of applications in computerbased learning environments. Teaching Mathematics and its Applications, 20, 109119. Webster, B. J., & Fisher, D. L. (2003). School-level environment and student outcomes in mathematics. Learning Environments Research, 6, 309-326.
Attitudes, behaviours, math tools Figure Captions
Figure 1. Cases: self-reported and exhibited behaviours. Figure 2. Cases: attitudes and learning outcomes. Figure 3. Cases: exhibited behaviours and learning outcomes.
44
Attitudes, behaviours, math tools
Figure 1.
45
Attitudes, behaviours, math tools
Figure 2.
46
Attitudes, behaviours, math tools
Figure 3.
47
Attitudes, behaviours, math tools
48
Table 1
Participant Characteristics (Students, Classes and Teachers) Characteristic Students (N = 565)
Classesa (N = 23)
%N
Grade: -7
55
9.7
-8
510
90.3
- PV/HG combination
2
8.7
- HG
2
8.7
- HG/PU combination
8
34.8
11
47.8
Educational level:
- PU (incl. Belgian class) Mean class size (SD) Teachersc (N = 11)
N
25.13 b (4.94)
Sex: - Male
4
36.4
- Female
7
63.6
Mean years of experience (SD)
11.82 d (11.44)
Note. a Two small classes from one teacher were combined into a single class for the project. b
Range 12 to 30 students.
c
In addition to the described participants, five more teachers initially agreed to participate
and provided data on teacher attitude and class characteristics. Three also provided data on student attitudes and behaviours, but either did not complete the intervention or did not return required data, so that their students (N = 56) could not be included in the main analyses. d
Range 1 to 36 years.
Attitudes, behaviours, math tools
49
Table 2
Student Attitude and Behaviour Scale Characteristics Scale name MATH
General attitude towards
Na
X
SD
Min
Max # items
α
612 3.69
0.68
1.00
5.00
5
.76
602 3.71
0.80
1.00
5.00
4
.75
605 3.53
0.49
2.00
5.00
6
.49
616 2.90
0.58
1.00
4.75
8
.73
mathematics TOOLS
Attitude towards using computers for mathematics
PURINV
Purposeful and investigative behaviours
REFCOM Reflective and communicative behaviours
Note. a Questionnaire data from classes who did not complete the intervention or return data
on learning outcomes were included in the reliability analyses, as the focus of interest was the scale structures and not the individual students.
Attitudes, behaviours, math tools
50
Table 3 Parameter Estimates for Multilevel Models
Intercept only
Covariate model
Student model b
model Par.
SE
Par.
SE
Par.
SE
6.36
0.19
6.87
0.22
6.88
0.20
Fixed effects
Intercept Student variables: General attitude towards
0.61*** 0.09
mathematics (MATH) Attitude to computers for
-0.23**
0.08
-0.07
0.11
learning maths (TOOLS) Reflection and communication (REFCOM) Class variables: HG/PUa (HGPUDUM)
-0.80**
0.33
-0.77**
0.30
HGa (HGDUM)
-0.62
0.54
-0.69
0.49
PV/HGa (PVHGDUM)
-2.02*** 0.56
-2.09*** 0.51
Teacher variables: Use of computers in maths
-0.38
0.37
-
-
education (TEACH) Random effects
Student level variance
2.01
0.13
2.01
0.13
1.83
0.12
Class level variance
0.76
0.25
0.41
0.15
0.34
0.12
Deviance
1894.38
1882.41
Note. a Baseline PU. b
This serves as the final model, as no random slopes were significant.
** p < .01 (1-sided). *** p < .001 (1-sided).
1814.82
Attitudes, behaviours, math tools Table 4 Pearson Correlations between Test Scores and Student Attitudes per Educational Level
test score-MATH Educational level
test score-TOOLS
MATH-TOOLS
r
N
r
N
r
N
PU
.20**
243
-.19**
242
.02
242
HG/PU
.33***
185
-.19**
182
-.08
182
HG
.46***
56
-.05
55
.00
55
PV/HG
.36*
37
.11
37
.48**
37
All levels
.26***
521
-.16***
516
Note. * p < .05 (2-sided). ** p < .01 (2-sided). *** p < .001 (2-sided).
.02
516
51
Attitudes, behaviours, math tools Table 5 Individual Cases: Attitudes, Self-reported Behaviours and Test Scores
Attitudes
Self-reported behaviours
Test
TOOLSb
PURc
INVd
REFe
COMf
score
2.60
3.00
3.33
3.33
3.00
3.00
6.3
Mike
3.60
4.25
3.00
4.00
3.00
4.25
5.8
Mary
4.40
4.75
4.67
4.67
4.75
4.75
5.3 g
John
4.20
4.50
4.00
4.00
2.75
3.50
6.3
Sarah
4.80
3.75
3.33
4.00
2.75
1.75
6.0
Jim
4.40
4.00
3.67
4.00
4.25
4.00
7.0
Ellie
4.40
3.00
3.67
4.33
3.00
3.25
5.5
Sean
3.60
4.00
3.33
4.00
3.50
3.00
7.0
Student
MATHa
Kim
Note. a MATH = general attitude towards mathematics. b
TOOLS = attitude towards using computers for mathematics.
c
PUR = purposeful behaviours.
d
INV = investigative behaviours.
e
REF = reflective behaviours.
f
COM = communicative behaviours.
g
The student was prevented from completing the test due to technical difficulties.
52
Attitudes, behaviours, math tools Table 6 Individual Cases: Ratings for Exhibited Behaviours and Tool Mastery
Tool
Exhibited behaviours Student
PURa
INVb
REFc
COMd
mastery
Kim
3
1
1
1
2
Mike
2
3
2
1
6
Mary
5
5
5
4
8
John
5
5
2
1
8
Sarah
5
1
1
4
6
Jim
5
2
5
4
8
Ellie
3
1
1
1
2
Sean
4
3
4
1
8
Note. a PUR = purposeful behaviours. b
INV = investigative behaviours.
c
REF = reflective behaviours.
d
COM = communicative behaviours.
53
Attitudes, behaviours, math tools
54
Table 7 All Cases: Spearman Rank-Order Correlationsa for Attitudes, Exhibited Behaviours and Learning Outcomes
Attitudes
MATHb TOOLSc MATH
1.00
TOOLS
Exhibited behaviours
test
tool
INVe
REFf
COMg
score
mastery
0.04
0.63* -0.14
0.06
0.76*
-0.22
0.15
1.00
0.41
0.96*** 0.73*
0.23
0.27
0.78*
1.00
0.32
0.43
0.73*
0.52
0.68*
1.00
0.71*
0.00
0.35
0.79*
1.00
0.41
0.72*
0.87**
1.00
0.24
0.37
1.00
0.72*
PUR
PURd
Learning outcomes
INV REF COM test score tool
1.00
mastery Note. a N = 8 for all correlations except those involving the test score (N = 7 after discounting
one student’s score). b
MATH = general attitude towards mathematics.
c
TOOLS = attitude towards using computers for mathematics.
d
PUR = purposeful behaviours.
e
INV = investigative behaviours.
f
REF = reflective behaviours.
g
COM = communicative behaviours.
* p < .05 (1-sided). ** p < .01 (1-sided). *** p < .001 (1-sided).