STIM2. STIM 2. STIM 1. --- --- --------- --. ---. STRONG. 10. 9. 8. 7. 6. 5. 4. 3. 2. 1. WEAK. PROP Thresholds. To measure PROP thresholds we used an up-down, ...
Perception & Psychophysics
1992.52 (5). 479-486
Effects of context on sweet and bitter tastes: Unrelated to sensitivity to PROP (6-n-propylthiouracil) KRYSTYNA M. RANKIN
John B. Pierce Laboratory and Yale University, New Haven, Connecticut and University of Stockholm, Stockholm, Sweden and LAWRENCE E. MARKS John B. Pierce Laboratory and Yale University, New Haven, Connecticut In a double-shifting context paradigm, subjects gave magnitude estimates of the perceived intensity of qualitatively dissimilar taste substances (saccharin and quinine, sucrose and quinine) or qualitatively similar ones (saccharin and sucrose), with each pair of substances taking on different contextual sets of concentrations in different sessions. The dissimilar pairs produced substantial differential effects of context (e.g., a particular concentration of saccharin or sucrose was judged more intense than a particular quinine in one contextual setting, less intense in another), but the similar pair did not. This result accords with the hypothesis that differential context effects depend on qualitative similarity. Contrary to expectations, however, the magnitude of the context effect did not differ in tasters and nontasters of the bitter substance 6-n-propylthiouracil (PROP), groups previously shown to differ in sensitivity to bitterness in saccharin. Similarity judgments suggest that saccharin and sucrose were qualitatively alike for all subjects, regardless of sensitivity to PROP. When subjects judge the intensities of stimuli with different qualities (or stimuli from different modalities) on a common psychophysical scale, the relative judgments given to the different qualities can shift as a result of changes in the contextual setting of the stimuli-the ensemble of possible stimulus values. These effects emerge in a double shifting-context paradigm: One contextual setting pairs Quality 1 with low stimulus intensities and Quality 2 with high intensities; the other context reverses the pairing. For example, when subjects judged the loudness of a set of 5OQ-Hzand 25OQ-Hz tones, 500-Hz tones were judged louder than 2500-Hz tones of the same SPL in one condition, but softer in another (Marks, 1988). The results of dual-context studies have repeatedly shown that shifting multiple contexts exerts interacting effects, in such a way that two stimuli judged equal in one contextual condition may be judged markedly unequal in another, whether the stimulus sets be auditory (Marks, 1988; Marks & Warner, 1991), visual (Potts, 1991), gustatory (Rankin & Marks, 1991), or heteromodal (Marks et al., 1988; Marks, Szczesiul, & Ohlott, 1986). A key factor determining whether judgments show differential context effects is the degree of qualitative similarity between the stimuli: The more similar the stimuli, This research was supported by NIH Grant DC00271 to L.E.M. We thank Jennifer Scott for her invaluable help in running the experiments and analyzing the data. Please request reprints from L.E. Marks, John B. Pierce Laboratory, 290 Congress Avenue, New Haven, CT 06519.
the smaller the shift in the judgments from one context to another. For example, Marks and Warner ( 1991) found that the size of the context effect varied systematically with the difference in sound frequency. When sound frequencies differed by less than a critical bandwidth, inferred intensity matches did not change across different contexts; but when frequencies differed much more than a critical bandwidth, the influence of context was substantial, with the size of the context-induced shift relating directly to the size of the difference in sound frequency. Analogous effects appear in taste. Rankin and Marks (1991) had subjects judge the intensity of NaCI and sucrose of varying concentrations on a single psychophysical scale, with four concentrations of each substance common to two contextual sets. The results revealed a substantial context effect on the common concentrations; for example, 0.25 M sucrose was judged weaker than 0.1 M NaCI in one condition, stronger in the other. Furthermore, the magnitude of the context effect was smaller when the stimulus sets contained NaCI and NaCI-sucrose mixtures, which are qualitatively more similar than NaCI and pure sucrose. The present study had two aims. The first was to test further the role of similarity in context effects in taste perception by examining sweet and bitter tastes. We compared a pair of similar-tasting substances, sucrose and saccharin, with two pairs of dissimilar ones: sucrose and quinine, and saccharin and quinine. We expected that pairing sucrose and saccharin would produce a small or negligible
479
Copyright 1992 Psychonomic Society, Inc.
480
RANKIN AND MARKS
differential effect of context, but that pairing sucrose and quinine and pairing saccharin and quinine would produce large context effects. The second aim was to compare the magnitude of these context effects in two populations of subjects who differ in their sensitivity to bitter substances. To do this, we relied on the well-known, genetically based differences that are defined by, and most evident in, responses to a certain class of bitter compounds, including the thiocarbamides 6-n-propylthiouracil (PROP) and phenylthiourea (PTC) (see, e.g., Fischer, 1967). Although most people (called tasters) are relatively sensitive to these substances, a small fraction (nontasters) are highly insensitive. Moreover, the difference in sensitivity between the groups is not restricted to thiocarbamides. For example, nontasters also show elevated thresholds to the bitter taste in saccharin (Bartoshuk, 1979). Because tasters and nontasters differ in their sensitivity to the bitterness of saccharin, the present study included saccharin among the taste substances. Although tasters and nontasters alike should perceive sucrose and quinine to be qualitatively dissimilar, and thus should produce a large differential context effect, it is conceivable that saccharin and quinine are more similar to tasters than to nontasters because saccharin tastes relatively more bitter to tasters; if so, then, compared with nontasters, tasters might show a slightly smaller context effect with saccharin and quinine. And because saccharin tastes relatively less bitter to nontasters, saccharin and sucrose may be more similar to nontasters than to tasters; if so, tasters might show a relatively larger context effect with saccharin and sucrose. The present study had three parts: First, we measured thresholds for PROP, to determine each subject's status as a taster or nontaster. This was followed by three double shifting-eontext experiments. Finally, we had all subjects rate the similarity of the three taste substances at three different concentrations.
METHOD PROP Thresholds To measure PROP thresholds we used an up-down, twoalternative forced-ehoice method. On each trial, the subjects tasted 5 rnl of deionized water preceded or followed by 5 rnl of dissolved PROP, rinsing their mouths between samples with deionized water. The task was to identify the sample containing PROP. When the subject correctly identified a given concentration of PROP on two consecutive trials, its concentration was then decreased and the procedure was repeated until the subject responded incorrectly. After a single incorrect response, the concentration of PROP was then increased. The procedure continued through six such reversals, and threshold for the run was taken as the average log concentration. Thirty paid subjects were tested. Each subject's threshold was measured three times, on separate days, and the average was taken as that subject's threshold for PROP. We chose 20 subjects for further study on the basis of their thresholds: 10 tasters (subjects with thresholds below 1.8 x 10⁻⁵ M) and 10 nontasters (subjects with thresholds above 3.5 x 10-' M). Two subjects dropped out during the course of the study, leaving 18 subjects in all, 9 tasters and 9 nontasters, who participated in all parts of the study.
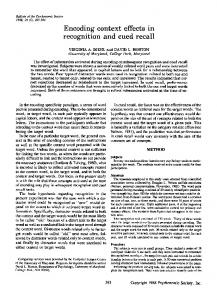
Experiment 1: Dual Shifting-Context Paradigm Experiment I contained three parts. In each, subjects judged the intensity of two different taste substances at several concentrations on one common scale, using the method of free magnitude estimation. Condition A consisted of 7, out of a set of 10, highest concentrations of one tastant (e.g., sucrose), and 7, out of a set of 10, lowest concentrations of another (e.g., quinine); in Condition B, the contexts were reversed. Figure I illustrates the design. Thus, the overall range of intensity levels was about the same in both contextual conditions. Four concentrations of each substance were common to both conditions. Stimuli. The taste stimuli were sucrose, quinine hydrochloride, and sodium saccharin, each dissolved in deionized water to 10 different concentrations. (See Table 1.) Procedure. The stimuli were presented at room temperature (ca. 22 0 C) in plastic cups containing 5 rnl of solution. Using the sipand-spit procedure, the subjects tasted the stimuli one at a time and gave magnitude estimates to stand for their perceived intensities. To the first stimulus, the subjects assigned whatever number seemed appropriate to represent the taste intensity. Then, to subsequent stimuli, they were to assign other numbers in proportion, using the last solution for comparison. The subjects could use any type of positive number: whole, decimal, or fraction. The subjects judged each of the stimuli five times in the course of the session, for 70 samples in all. Order of presentation was random for each subject. The subjects were instructed to rinse their mouths with deionized water before starting the experiment and between successive samples. The subjects waited a minimum of 30 sec between samples, longer if they thought it necessary. They held each sample in their mouths for approximately 3 sec and, after spitting it out, wrote their magnitude estimate of the taste intensity on a response sheet. The subjects were advised to ignore the qualitative differences between the stimuli and concentrate on comparing their intensities. Experiment IA tested sucrose and saccharin, IB tested sucrose and quinine, and IC tested saccharin and quinine. Each experiment consisted of two 35-45 min sessions (contextual conditions) run on separate days, counterbalanced for order over subjects, with a minimum of 2 and a maximum of 5 days between sessions. Experiment 2: Similarity Stimuli. In Experiment 2, the same 18 subjects rated the qualitative similarity of each of 36 stimulus pairs. This set comprised all possible pairs (except the identity pairs) of three concentrations each of sucrose, saccharin, and quinine: 0.70, 0.28, and O.087M sucrose; 0.004, 0.0015, and O.OOO4M saccharin; and 0.0001, 0.000047, and 0.()()()()17M quinine. These were the highest, middle, and third from lowest concentrations used in Experiment 1.
STiM 1
STRONG 10
z
9
o
8
c(
7
j::::
a: I-
z W o z o o
STIM2
STIM 2
STIM 1
6
5 4
---
--- --------- --
---
3 2 1 WEAK
A
B
CONDITION
Figure 1. Graphic representation of the dual-eontext experimental design. Condition A presents high concentrations of Stimulus 1 and low concentrations of Stimulus 2. Condition B reverses the pairings.
EFFECTS OF CONTEXT ON TASTES
481
As predicted, saccharin and sucrose (Figure 20) showed the smallest contextual effect. After normalization to saccharin, the two sucrose functions almost overlap, showing very little shift in relative vertical position, whereas sucrose and quinine (Figure 2E) and saccharin and quinine (Figure 2F) show large shifts. The size of the separation between the functions indicates the magnitude of the context effect; the larger the separation, the greater the effect of context on the judgments of intensity. Consider how the judgments of intensity of a given stimulus changed between conditions in Experiments 1B (Table 2) and 1C (Table 3). For example, Figure 2C shows that, on the average, 0.000037M quinine was given numbers 45 % smaller in Condition B than in Condition A (see Procedure. Presentation of the stimulus pairs was random across Table 3). This drop is equivalent to a decrease of about subjects, with half the subjects tasting one substance first and the 0.2 log unit in concentration-assuming that the subjects other half the other substance first. The subjects responded by markused numbers similarly in the two different test sessions. ing the appropriate location on an 18-cm-long line, labeled "same" To circumvent the possibility that subjects simply used on the left and "different" on the right. A separate sheet of paper smaller numbers in Condition B versus Condition A, we was provided for each judgment; the subjects were asked not to can compare the judgments of quinine to the judgments refer back to their previous judgments. of saccharin in the two conditions. For example, in ConRESULTS AND DISCUSSION dition A, 0.000037 M quinine was judged stronger than 0.0015M saccharin, but in Condition B, the same quiExperiment 1: Differential Effects of Context nine was judged weaker than 0.0015M saccharin. Such The magnitude estimates of intensity given to each stim- shifts in the perception of the relative intensity of differulus were averaged arithmetically for every subject and ent stimuli have been called differential or "slippery" conthen averaged geometrically over subjects for each con- text effects (Marks & Warner, 1991). dition in each of the three parts of the experiment. Panels Analysis of variance (ANOVA), applied to the log judgA-C of Figure 2 plot the mean judgments as a function ments, establishes the statistical reliability of differential of stimulus concentration for each part of Experiment I. context effects, which appear in the stimulus x condi(Note that on this figure and the next, the abscissa has tion interaction. As expected, this interaction was insigbeen scaled differently for each substance, for ease of dis- nificant for saccharin-sucrose [F(l, 17) = 0.43, P = .52], play.) The shifts induced by context vary across the three but highly significant for both sucrose-quinine [F( 1,17) = panels as a function of qualitative similarity between the 12.3, P = .003] and saccharin-quinine [F(l, 17) = 24.5, substances. P = .00001]. Visual inspection of Figure 2 suggests that, The overall magnitude of the context-based shifts be- contrary to our expectations, context exerted a numericomes more evident when the data are normalized; nor- cally smaller effect on sucrose-quinine than on sacmalized functions are shown in panels D-F of Figure 2. charin-quinine. Because saccharin is slightly bitter and We normalized the data in the following way: First, we thus might be more similar to quinine than sucrose is, we calculated the overall geometric mean of the responses expected that the context effect might be smaller for sacto the four common saccharin concentrations (Experi- charin-quinine. Direct statistical comparison, however, ment 1A) in Condition A, M(A), and the corresponding showed that the difference between the two differential geometric mean in Condition B, M(B). Next, we aver- context effects is not reliable [for the three-way interaction aged the two means M = [M(A)+M(B)]/2. Finally, we of experiment x stimulus x condition, F(l,34) = 1.97, multiplied all the responses for saccharin and sucrose in P = .17]. Condition A by M/M(A) and all the responses in CondiOther results obtained from ANOV As showed that, as tion B by M/M(B). expected, in all three subexperiments, the effect of stimThis procedure makes the saccharin functions in Ex- uli was insignificant [F(l, 17) < 1 for both sucrose-sacperiment 1A overlap; consequently, the difference be- charin and sucrose-quinine, and F(l, 17) = 2.82, P = tween the two sucrose functions represents the overall .11, for saccharin-quinine], confirming that at least the magnitude of the differential contextual effect. If the ob- first two pairs of taste qualities were matched quite well served differences in judgments were due simply, for ex- overall for subjective intensity, and that the effects of conample, to the subjects using different-sized numbers in centration were highly significant [F(3,51) ~ 34.5, P < the two conditions-that is, to a change in numerical .0001, for all three pairs]; subjects could clearly differmodulus-then, after normalization, the sucrose functions entiate the different levels of the stimuli. should overlap as well. The same normalization proceBecause numerical response scales can change over sesdure was applied in Experiments 18 (normalized to su- sions, it is especially important to look at changes in relcrose) and 1C (normalized to saccharin). ative response to each pair of substances, not just changes Table 1 Molar Concentrations Used in Experiment 1 Sucrose Saccharin Quinine .70 .004 .0001 .52 .0029 .000079 .38 .0021 .000069 .28* .000047* .0015* .000037* .21 * .0011 * .15* .00077* .000028* .11* .000022* .00056* .087 .0004 .000017 .060 .000013 .00029 .044 .00021 .000001 *Concentration common to the two contextual conditions.
482
RANKIN AND MARKS GEOMETRIC MEANS
NORMALIZED MEANS 100
100 A Saccharin-Sucrose
0
Saccharin-Sucrose
E
Sucrose-Quinine
10
10
---
--a-
HIGHSAJA
lOWSR/A
~
LOWSMI
--.-
HIGHSRIB
W
le(
100
100
:=
B
IIII
/~ --
w
W
10
C ::::l I-
---0-
Z c:l e(
:=
Sucrose-Qu inine
100 C
10
LOWQ'A
---0-
LOWSR/B HIGH "'"
F
#~
--
HIGH SArA LOWQ'A
LOWSR!B HIGH"'"
100
Saccharin-Quinine
---0-
1 01
~--
10 HIGH SRiA
A
10 HIGH SA/A
LOWQ'A LOWSNB HIGH"'"
10
1
Saccharin-Quinine
01
----0-
HIGH SAiA
LOWO'A
LOWSMI HIGH"'"
10
STIMULUS CONCENTRATION
Figure 2. Magnitude estimates of taste intensity, plotted against concentrations of saccharin (SA) and sucrose (SR)(Experiment IA: panels A and D), sucrose and quinine (Q) (Experiment IB: panels B and E), and saccharin and quinine (Experiment IC: panels C and F). In each panel, results for Conditions A and B are given by squares and circles, respectively. Panels A-C show original geometric means of the estimates, and panels D-F show normalized estimates. For ease of display, the abscissa gives the molar concentrations of sucrose directly, but the concentrations of saccharin and quinine have been multiplied by factors of 100 and 1,000, respectively.
in response to a single substance. Underlying this view is the distinction between two kinds of contextual effect. First, there are general (perhaps universal) effects, which can show themselves in judgments of all stimuli. Poulton (1989) has reviewed many judgmental effects, such as the tendency for subjects to stretch or compress their response scale according to the range of stimuli presented. Second, there are differential or relative effects, whose magnitude depends on the qualitative similarity between the stimuli. The present study focuses on the latter. Whereas general context effects may largely represent changes in overt responding (for instance, changes in the decision rules governing how subjects map numerical responses onto stimuli), differential effects may represent real changes in percepts themselves (Marks, in press; Schneider & Parker, 1990).
Figure 3 shows (normalized) taste functions separately for tasters and nontasters. These functions resemble the pooled functions shown in Figure 2. Neither tasters nor nontasters show a differential effect of context for saccharin-sucrose, but both groups show marked effects for sucrose-quinine and for saccharin-quinine. Thus, contrary to our hypothesis, we found no differences between tasters and nontasters with regard to differential context effects: ANOVAs showed the interaction of group x condition x stimuli to be insignificant for all three parts of the experiment (each F < I).
Experiment 2: Judgments of Similarity Even though Experiment I showed the magnitude of differential context effect to be substantially the same in tasters and nontasters, context effects may nevertheless
EFFECTS OF CONTEXT ON TASTES Table 2 Magnitude of the Context Effect, Expressed in Percentages for Eat:h of the Common Concentrations of Sucrose and Quinine (Experiment 18) Concentration Contextual Concentration Contextual Quinine (%) Shift (%) Sucrose (M) Shift (%) .28 34.5 .000047 2.9 .21 58.6 .000037 11.9 .15 55.3 .000028 28.9 .11 27.4 .000022 17.0 Mean
44.0
15.2
Table 3 Magnitude of the Context Effect, Expressed in Percentages for Eat:h of the Common Concentrations of Saccharin and Quinine (Experiment 1C) Concentration Contextual Concentration Contextual Saccharin (M) Shift (%) Quinine (%) Shift (%) .0015 42.6 .000047 60.6 .0011 37.5 .000037 45.1 .00077 36.3 .000028 71.4 .00056 34.8 .000022 26.6 Mean
100
37.5
50.9
vary over individuals, depending on how similar they perceive the two substances. Perhaps, however, the dichotomy between tasters and nontasters of PROP does not capture the interindividual differences in similarity. To examine more directly any possible relation between differential context effects and perceived similarity, we used multidimensional scaling (MDS) to help interpret the dissimilarity ratings of the taste stimuli obtained in Experiment 2. Two versions of MDS were applied, nonrnetric and metric. Nonmetric analysis. The pooled data matrix, consisting of average responses (distances in millimeters from the left-hand end of the rating line) given to each stimulus pair, was first submitted to nonrnetric MDS (KYST), generating two-dimensional and three-dimensional solutions. Overall, Kruskal stress values were low (0.05 for the two-dimensional solution and 0.018 for the threedimensional solution), and there was a near linear relation between the derived distances and original ratings . In both solutions, Dimension I differentiates taste quality (bitter vs. sweet), and Dimension 2 differentiates taste intensity (weak vs. strong). Dimension 3 is harder to interpret; the interpretation becomes easier when we assess
-r--------------, Tast8lll: Suc:ro6e & Quinine
Tast8lll: Saccharin & Sucrose
w ~
483
Tast8lll:Saccharin & Quinine
10
--
::E
tiw
-+- .... Q18
-+-
w
c t: 100
Hlgn SAIA LOW QIA
LOW sAle
Hlgn o/e
::;)
Z CJ
Nontasters: Saccharin & Sucrose
Nontasters: Saccharin & Quinine
Nontasters: Sucrose & Quinine
c(
::E 10
.......-~~~~~+,
1 +--~~~~ 01
10
+-~~
01
............-~~~ .......~~~....J,
+-~~~
10 0 I
~
lOwSAle
---
H19nO/8
......--~ ............-~~~-l 10
STIMULUS CONCENTRATION Figure 3. Normalized magnitude estimates of taste intensity, plotted against concentrations of saccharin (SA), sucrose (SR), and quinine (Q) for tasters (upper panels) and nontasters Oower panels), as In Figure 2.
484
RANKIN AND MARKS
results of tasters' and nontasters' data separately, using metric MDS, as discussed below. Metric analysis. Given the good relationship between the proximities and distances, it was deemed appropriate to analyze the data by the metric procedure of INDSCAL. INDSCAL is particularly useful for our purposes, since it provides not only a Euclidean map of the stimulus space, with uniquely specified axes defining the dimensions, but also measures of the extent to which each subject relies on each of the derived, underlying dimensions. The 18 individual matrices of dissimilarity ratings were analyzed with SINDSCAL (a symmetric version of INDSCAL) to obtain dimensions for the group and weights on each dimension for the 18 individuals. Again, two-dimensional and three-dimensional solutions were derived. The correlation between the derived distances and the original distances was .80 for the three-dimensional solution and. 77 for the two-dimensional solution. Stimulus space. Dimensions 1 and 2 account for 43 % and 14% of the total variance, respectively, in the threedimensional solution(45% and 14% in the two-dimensional solution), and they are relatively straightforward to interpret. Dimension 3 accounts for only 7 % of the total variance, with just 3 subjects placing much weight on it. As in the nonmetric solution, Dimension 1 differentiates quality, with sweet (including sucrose, SR, and saccharin, SA) at one end, and bitter (quinine, Q) at the other. Dimension 2 differentiates intensity (L = low, M = medium, H = high; see Figure 4). SINDSCAL analyses were also run separatelyfor tasters and nontasters. For nontasters, Dimensions 1, 2, and 3 account for 53%,15%, and 9% of the variance, respectively; for tasters, the corresponding values are 34%, 15%, and 9%. Furthermore, the stimulus spaces for tasters and nontasters are not identical. Thus, tasters space the three sets of intensity levels (Dimension 2) more uniformly than nontasters do. Nontasters tend to group the high and medium concentrations (see Figure 5). Moreover, Dimen-
0.6
.~
H5RO
0.4
l/l
0
c:
Cl>
E
~ c: o
0.2·
H5A 0
°MQ
HQ
M5R
o·
~
o
M5A
.~
zs
o
~02 o
-04
LQ
L5R
o
0
L5A
~0.6 +--.,...--...,---~--.,----1 I
-06
-04
-0.2
o
02
04
Dimension1/Quality
Figure 4. Two-dimensional solution found by SINDSCALfor nine taste stimuli. L, M, and H = low, medium, and high concentrations; SA, SR, and Q = saccharin, sucrose, and quinine.
-r-----------------,
06
A Nontasters
0.4 02 - 0
HO
0
MO
o -02 ~
"U)
c
-0.4
LSR o
LOO
CD
-0.6
c
06
I
-0.6
"U) CD
E
o
MSA
0
C ~ c o
-0.4
-0.2
0.2
0
0.4
0.6
-r-----------------, B Tasters
0.4 -
HSR 0
00 HQ
MO
HSA 0
0.2 -
0MSA 0
0
-0.2 -
LO
-0.4
0
LSA LSR
,
-0.6 -0.6
-0.4
-0.2
0
0
0
MSR
, 02
0.4
0.6
Dimension lIQuality Figure S. Two-dimensional solution found by SINDSCAL for nine taste stimuli for nontasters (panel A) and tasters (panel B). L, M, and H = low, medium, and high concentrations; SA, SR, and Q = saccharin, sucrose, and quinine.
sion 3 (not shown in the figures) seems to represent another aspect of quality for nontasters, with low and medium concentrations of saccharin plus the three concentrations of sucrose toward one end, and the high concentration of saccharin and all concentrations of quinine toward the other. No clear qualitative or quantitative division is obvious for tasters, for whom Dimension 3 remains difficult to interpret. Subject weights. The INDSCAL procedure provides each subject's individual weightings on the component dimensions of the analysis. Figure 6 displays weights on the three dimensions obtained from the initial analysis (performed on the ensemble of data from the 18 subjects), with individuals identified as tasters (T) and nontasters (NT). As Figure 6A shows, most nontasters emphasized quality (Dimension 1), with all but 1 giving coefficients of 0.56 or greater, and put less weight on intensity (Dimension 2). Though difficult to interpret, Dimension 3 in the overall analysis is clearly more important to nontasters than to tasters (Figure 6B). Note that 2 of the 3 tasters who strongly emphasized Dimension 3 had the highest PROP thresholds among the tasters. Otherwise, there is little relation between subject weights and PROP thresholds.
EFFECTS OF CONTEXT ON TASTES
z-
09
'iii c
0.8
C
0.7
Q>
~ c 0 'iii c
Q>
E
(5 c 0
E
Ol
'iii
:s:
0.6 0.5 0.4
-
A
0
NT2 0 T14
T13 o ONTl 0 NT9
0.3
NT30 OJ NT10
°Tl1
0
0.2
T16 0 T19
-0.1
0
t~?\3 5 T20
0 NT4
0.1 0
OT17
NT6 0
T18
0 NT17
I
04
0.2
0
0.6
08
Weight on Dimension 1/Quality
0.7 C')
c 0 'iii c
04
(5 c
0.3
E
0.2
'iii
0.1
0
0 T16
0.5
Q>
E
B
06
Tl1 0 NT9
NT2 0 0 T18
Ol
:s:
0
0 0 T14
0 T19
0 -0.1
0.2
be that sucrose and saccharin are never qualitatively different enough to produce a context effect. With respect to sampling, it is possible that our population of tasters was not sufficiently sensitive to the bitter taste in saccharin to make the compound differ substantially from sucrose. Most of the similarity ratings of saccharine-sucrose obtained from both tasters and nontasters fell toward the "similar" end of the scale, and MDS confirmed this observation. That is, most subjects found sucrose and saccharin similar in taste-and presumably not dissimilar enough to induce a context effect. A different approach-not the one taken here-would be to measure directly individual sensitivity to the bitter taste in saccharin. Then one could look at the correlation between sensitivity to the bitter taste in saccharin and the size of the context effect. On the other hand, it is possible that even to individuals most sensitive to the bitter taste of saccharin, saccharin is still predominantly sweet, and that its predominant sweetness makes it too similar to sucrose to produce a differential context effect. That is, sucrose and sacccharin may not produce such an effect in anyone. In fact, in comparison with tasters, nontasters may have depressed
T20g o NT? NT3 NT10 T130 0 o 0 T12 T17 c9 NT5 NT1 o NT4
04
0.6
A Nontasters
0.8 -
I
I
0
NT6
0.8
0 52
06-
Weight on Dimension 1/Quality
51 04·
(NT).
The SINDSCAL analysis differentiates, albeit only very slightly, between tasters and nontasters. Overall, nontasters emphasize the quality dimension more than tasters do. There is no evidence, however, that the two groups of subjects fall into distinct categories with respect to similarity of sucrose and saccharin, though we anticipated that they might. It is not surprising, therefore, that there was no difference between the two groups with respect to magnitude of the differential context effect in judgments of taste intensity. There may be several reasons why tasters and nontasters showed equivalent context effects for sucrose and saccharin. One could be a matter of sampling; another could
54cf~ I 0 55
~
'iii
C Q>
Perceived Similarity and Context Effects
53 0
0.2 •
0
0-
C
Similar results emerge from the analyses run separately on the data of tasters and nontasters. Nontasters emphasized Dimension 1 (Figure 7A), whereas tasters emphasized Dimensions 1 (quality) and 2 (intensity) more equally (Figure 7B). Nontasters also tended to emphasize Dimension 3 more than tasters did, except for 3 tasters who have low weights on both Dimensions 1 and 2.
0
0 59
Figure 6. Individual subject weightson Dimension 1 versus weights
on Dimension 2 (panel A), and weights on Dimension 1 versus weights on Dimension 3 (panel B), for tasters (f) and nontasters
485
~
c 0 'iii c
560
.
-02 0
0.2
04
0.6
57
.
10
08
Q>
E
(5 c 0
B Tasters
0.8 -
E
0
Ol
'iii
:s:
06 -
513 0
514
04 -
0 516
02
0 0 5 17 511
c:0
52O
512
0 0-
519
0 518
.
02 0
02
.
04
06
08
Weight on Dimension 1/Quality Figure 7. Individual subject weights on Dimension 1 versus weights on Dimension 2 for nontasters (NT, panel A) and tasters (T, panel B), when results for each group were analyzed separately (three-dimensional solution).
486
RANKIN AND MARKS
sensitivity to the sweetness as well as the bitterness of saccharin (Gent & Bartoshuk, 1983); consequently, if similarity depends on the qualitative makeup of complex stimuli (e.g., the ratio of bitterness to sweetness), the taste of saccharin may differ only modestly in nontasters and tasters. This interpretation also bears on another issue, namely, the neural mediation of sweetness in saccharin and sucrose. The sweetness of saccharin and sucrose may be subserved by different populations of receptors (see Faurion, Satito, & Mac Leod, 1980; Schiffman, Cahn, & Lindley, 1981). One might conjecture that differential context effects arise when stimuli activate different populations of receptors. The present study failed, however, to yield any evidence of a differential context effect with sucrose and saccharin. If the sweetness of sucrose and the sweetness of saccharin are mediated by different receptors, the present results would speak against the conjecture that differential context effects depend on activation of different receptor populations. The main findings support the similarity model of differential context effects. That is, sucrose and saccharin are perceived as qualitatively similar, and they produced no differential effect. Quinine and saccharin, and quinine and sucrose, however, are perceived as dissimilar, and they produced substantial context effects. On the other hand, the results revealed no difference between tasters and nontasters in the size of the differential context effect. In light of the similarity ratings, however, this result should not be surprising. As mentioned earlier, the two groups did not differ with respect to their judgments of similarity of sucrose and saccharin, though we expected they would. This expectation, in turn, was based on earlier findings that saccharin is less bitter to nontasters than to tasters (Bartoshuk, 1979). It is important to note that those results come from judgments of intensity. In our study, by contrast, subjects judged similarity. Furthermore, our stimulus set also included quinine, which is very bitter. It is therefore conceivable that in the context of the bitter quinine, tasters as well as nontasters perceived sucrose as similar to saccharin, even though tasters are relatively more sensitive to saccharin's bitter taste. We still do not understand the precise quantitative relation between degree of similarity and magnitude of context effects in taste. Is there, for example, a "threshold" for context effects-that is, a point beyond which two substances are dissimilar enough to begin producing a context effect? Can all taste stimuli be placed on a single quantitative continuum of qualitative similarity, whereby the magnitude of the context effect relates directly to the degree of dissimilarity between the stimuli? And again, what role, if any, do individual differences in the per-
ception of similarity play in determining the size of the differential context effect? Marks and Warner's (1991) results may be relevant here. They found that judgments of loudness showed no differential context effect when tones of different frequencies fell in the same critical band; so critical bandwidth may provide a "threshold" for differential context effects in loudness. Like loudness judgments, taste intensity judgments may not be sensitive to relatively small variations in taste quality, as, for example, those between sucrose and saccharin. In future studies, the similarity between taste stimuli should be varied systematically, both by mixing substances with "basic" taste qualities (sweet, sour, salty, bitter) and by testing substanceswith complex tastes. REFERENCES BARTOSHUK, L. M. (1979). Bitter taste of saccharin related to the genetic ability to taste the bitter substance 6-n-propylthiouracil (PROP). Science, 205, 934-935. FAURlON, A., Sxrrrc. S., & MAC LEOD, P. (1980). Sweet taste involves several distinct receptor mechanisms. Chemical Senses,S, 107-121. FISCHER, R. (I %7). Genetics and gustatory chemoreception in man and other primates. In M. R. Kare & O. Maller (Eds.), The chemical senses and nutrition (pp. 61-81). Baltimore: Johns Hopkins University Press. GENT, J. F., & BARTOSHUK, L. M. (1983). Sweetness of sucrose, neohesperidin dihydrochalcone and saccharin is related to the ability to taste the bitter substance 6-n-propylthiouracil. Chemical Senses, 7, 265-272. MARKS, L. E. (1988). Magnitude estimation and sensory matching. Perception & Psychophysics, 43, 511-525. MARKS, L. E. (in press). The contingency of perceptual processing: Context modifies equal-loudness relations. Psychological Science. MARKS, L. E., STEVENS, J. c.. BARTOSHUK, L. M., GENT, J. F., RiFKIN, 8., & STONE, V. K. (1988). Magnitude matching: The measurement of taste and smell. Chemical Senses, 13, 63-87. MARKS, L. E., SZCZESIUL, R., & OHLOTT, P. (1986). On the crossmodal perception of intensity: Journal of Experimental Psychology: Human Perception & Performance, 12, 517-534. MARKS, L. E., & WARNER, E. (1991). Slippery context effect and critical bands. Journal of Experimental Psychology: Human Perception & Performance, 17,986-9%. POULTON, E. C. (1989). Bias in quantifyingjudgments. Hillsdale, NJ: Erlbaum. POTTS, B. C. (1991). The horizontal-vertical illusion: A confluence of configural, contextual, andframingfactors. Unpublished doctoral dissertation, Yale University. RANKIN, K. M., & MARKS, L. E. (1991). Differential context effects in taste perception. Chemical Senses, 6, 617-629. SCHIFFMAN, S. S., CAHN, H., & LINDLEY, M. G. (1981). Multiple receptor sites mediate sweetness: Evidence from cross adaptation. Pharmacology, Biochemistry & Behavior, 15, 377-388. ScHNEIDER, B., & PARKER, S. (1990). Does stimulus context affect loudness or only loudness judgments? Perception & Psychophysics, 48, 409-418.
(Manuscript received December 5, 1991; revision accepted for publication May 3, 1992.)