Effects of Endogenous Task Complexity and the Endowed Bundle on Stated Choice Wuyang Hu
[email protected] Assistant Research Professor Department of Resource Economics University of Nevada – Reno Reno, Nevada 89557 Tel: 775.784.6434
Selected Paper prepared for presentation at the American Agricultural Economics Association Annual Meeting, Long Beach, California, July 23-26, 2006
Copyright 2006 by Wuyang Hu. All rights reserved. Readers may make verbatim copies of this document for non-commercial purposes by any means, provided that this copyright notice appears on all such copies.
1
Effects of Endogenous Task Complexity and the Endowed Bundle on Stated Choice Abstract Conventionally, studies examining the impacts of choice complexity only consider complexity introduced exogenously from the tasks respondents face. In the context of a stated conjoint survey, this article establishes endogenous complexity measures through decision-makers’ experience known as the endowed bundle before the survey. Results show that complexity should not only be defined exogenously. Endogenous complexity measures are important in determining the utility associated with an alternative and the decision of whether to participate in the market. In addition, some of these complexity effects are nonlinear. We also show that exogenous complexity simultaneous affects the choice consistency.
Key Words: Complexity, Endowed Bundle, Random Utility, Stated Choice JEL code: C81, D12
Along with the increasingly popular application of discrete analyses of human choices, literature on various internal design or data collection issues related to these approaches has grown rapidly. Among these issues, considerable attention has been directed to understanding the impacts of choice task complexity on respondents’ decision making. The complexity of choice tasks may be linked to how the tasks are framed, the context of choices, or the cognitive abilities of individuals (Masatlioglu and OK 2005). Swait and
2
Adamowicz (2001b), Dellaert and Stremersch (2005), and Conlon et al. (2001a and b) studied the impact of task complexity on choices of consumer goods; DeShazo and Fermo (2002 and 2004) examined the similar impacts in individuals’ visits to recreational sites; Arentze et al. (2003), Hensher et al. (2005) investigated the complexity issue involved in choice of different transportation options; and Swait and Adamowicz (2001a) presented a comprehensive examination of the impacts of complexity on choices in a variety of settings ranging from food and durable consumer products, to recreational sites, and to transportation options with variations of both stated and revealed preferences. The general finding of these studies is that the complexity of choice tasks has important influence on choice decisions.
In this article, we continue to investigate this issue and focus on the impacts of stated choice task complexity on consumers’ choices and the welfare implications. However, this study differs significantly from existing research in several aspects. First, almost all previous analyses treat complexity of a choice as a purely exogenous issue in that all aspects of choice complexity are assumed as being introduced by choice sets themselves, regardless if in a conjoint experiment or in an actual shopping experience, rather than by the choice makers. In reality however, a given choice situation may be regarded as complicated to one individual but simple to another. We argue that ignoring individual perceptions in complexity measures may introduce bias in the analysis and this bias may explain why there are discrepancies in the literature explaining the impacts of choice complexity. The endogenous complexity measures introduced in this article are based on survey respondents’ endowed bundle of product attributes and correct the potential bias.
3
One of the endogenous measures is alternative-specific thus also offers greater modeling potentials. Second, we show that after controlling the impacts from endogenous complexity, exogenous complexity may still play a role affecting respondents’ choice patterns. Third, in many past studies dealing with the issue of complexity, product attributes used often reflect a type of natural grading, such as the degree of congestion or accessibility of a park or the grade of the quality of a food product. This study uses a dataset on Japanese consumers’ stated purchasing intentions for canola oil. All attributes used are 0/1 dummy variables and in particular, these variables are defined in such a way that there is no clear pre-assumption on whether respondents would like or dislike a certain attribute to be present in their product. We begin the discussion by distinguishing the difference between exogenous and endogenous complexity measures.
Theory on Complexity Measures From the early works such as Johnson and Payne (1985) to the more current studies such as Swait and Adamowicz (2001a,b), DeShazo and Fermo (2002, 2004), Sandor and Franses (2004), and Sandor and Wedel (2005), choice complexity has commonly been defined in two ways. The first, as Conlon et al. (2001a) summarizes, can be called the task-based complexity. These measures may be given as the absolute number of attributes or alternatives in one choice set or the total number of choice sets faced by a respondent. Conlon et al. (2001b) refer to the second type as context-based complexity, which in turn incorporates measures such as the difference between alternatives within or across choice sets. A popular such measure used in the literature is the standard deviation between the levels of attributes of two or more alternatives in a choice set (given that not
4
all non-price attributes are dummy variables as in this current study). Clearly, both these types of measures ignore the interaction between respondents’ experience and the given choice sets in the definition of choice complexity. In other words, these measures evaluate complexity completely from the exogenously given choice sets determined by the researcher. The measures of complexity are therefore given from the researchers’ perspective but not that from the respondents who are the ones actually completing the choice tasks.
Huneke et al. (2004) showed that consumers’ choices among a group of products with complex attributes are strongly affected by their pre-existing product knowledge, their motivation when making the choices and subsequently their cognitive involvement in the tasks. This finding evidently suggests that choice tasks will be processed by respondents and the complexity of the tasks should also incorporate human characteristics. An exogenously defined complexity measure may not be viewed the same by different individuals with different cognitive background. For the stated conjoint experiments, one important factor determining the degree of complexity of an alternative to an individual is how familiar the alternative is to that individual. If an alternative offered in the survey is identical to the product the individual normally consumes (such as visiting a park) or purchases from the market (such as a food item) then there is almost no complexity involved. The individual knows exactly how the product will work or taste and can make a consumption decision almost instantly. This normal consumption is originally coined as “customary consumption” by Munro and Sugden (2002) reflecting a type of reference point effect incorporated in the broader prospect theory formulated by Kahneman and
5
Tversky (1979). To assist intuition, we follow the terminology used in Masatlioglu and OK (2005) and refer to this reference purchase as the endowed bundle.
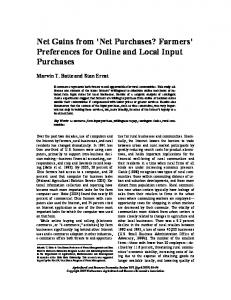
Based on this discussion, Figure 1 shows the bias that may be introduced by an exogenous complexity measure. Suppose the very left darkened boxes represent the six attributes of an endowed bundle. The other columns represent two choice tasks, namely, choose one alternative out of the two offered in each choice set. If the color of the boxes is identical then they represent the same level of an attribute. According to this notion, choice set 1 is quite complicated exogenously as all six attributes are different between alternatives A and B. For the same reason, the two alternatives in choice set 2 represent a simple task—only the first attribute is different between the two alternatives.i However, endogenously these two choice sets suggest the same level of complexity. For choice set 1, since the darkened boxed are identical with the endowed bundle, no extra effort is required to evaluate these attributes. The total number of attributes to evaluate is 6. For choice set 2, although a respondent has to evaluate attributes 2-6 in both alternatives, they are identical between the alternatives. The total number of attributes that has to be assessed is 5 plus the first attribute in alternative D thus also equal to 6. Certainly there may be cases that the exogenous and endogenous complexity measures are identical but the key point is that these two types of measures can be quite different.
In the past, literature on choice complexity has shown a moderate degree of discrepancy in results. For example, DeShazo and Fermo (2002) found that all their five complexity and correlational variables have significant impact on choices while Arentze (2003) only
6
found the number of attributes has significant impact but not the number of alternatives or the number of choice tasks. In addition, Conlon et al. (2001a) found that neither the number of alternatives nor the number of attributes has significant impacts on choices but the similarity between attributes is significant. We argue that only using the exogenous complexity measures may contribute to these differences. If endogenous measures were used, these dissimilarities might have been reduced or even eliminated. Some studies have noticed the potential problem of using only exogenously defined complexity measures. Hensher and Greene (2005) and Dellaert and Stremerschm (2005) suggest researchers have to consider factors outside the survey questions themselves, such as respondents’ experience and their information processing abilities. DeShazo and Fermo (2004) attempted this by interacting their exogenous complexity variables with respondents’ characteristics. This article formally introduces a systematic way to construct the endogenous complexity measures and incorporate them into the empirical analysis. An additional benefit of this approach is that we are able to create alternativespecific complexity measures that are difficult to achieve in exogenous measures.
Data and Empirical Complexity Measures Data used in this study are from a larger survey conducted in Japan from May to July in 2004. The final data containing necessary components that are suitable for this current study are from the city of Tokyo with 367 usable responses. A check of the demographic characteristics of the data shows that the sample is fairly representative of the population in Tokyo except that females are over-sampled. Given that the survey required the major grocery shopper of a household to complete, this over-representativeness of females is
7
not surprising. The survey employs a conjoint choice experiment to elicit purchasing intentions of Japanese consumers on canola oil with a series of credence attributes identified through a course of focus group discussions and pre-testing. These credence attributes are: low saturated fat content, high Oleic acid content, high Alpha-Linoleic (AL) acid content, high Vitamin E content, Genetically modified (GM) content, certified organic (JAS label), certified functional food (FOS label), and domestically produced. Properties of all these attributes are fully debriefed before the choice experiment. In the questionnaire, the first four attributes (saturated fat, Oleic acid, AL acid, and Vitamin E) are grouped into one category called “health information.” Similarly, the two food certification (organic and functional) attributes are grouped into the category “certificates” in the questionnaire. Figure 2 displays a sample choice set.
It is obvious that except for the price all attributes are either present or absent. The price used in the survey has five levels ranging from 298 Yen (1 Yen roughly equals to 0.0087 USD) to 698 Yen with each increment of 100 Yen. As shown in Figure 2, each choice set contains three alternatives. The first two alternatives are described by the attributes and the last alternative is a choose-none alternative. DeShazo and Fermo (2004) also included the choose-none alternative in their surveys to examine the impact of complexity. This alternative gives respondents an option not to participate in the market. Since it does not specifically state the consequence of “not participating”, respondents can treat it either as purchasing their most often purchased product or as not making any purchase at all. This gives them the flexibility to interpret in a way they feel most comfortable with. These alternatives in choice sets were formed orthogonally by
8
fractional factorial design and each respondent was randomly assigned to one of the 8 blocks each with 8 choice sets.
The basis for the endogenous complexity measures is obtained by asking the respondents one simple question before they enter the choice experiments—what is your most often purchased canola oil. This question was asked for each of the credence attributes used in the later choices and this reveals the endowed bundle. Respondents’ answers to these questions can be yes (present), no (not present) or not sure. In this survey, we did not force the respondents to take a guess of whether an attribute is present in their most often purchases product if they were not sure initially. Based on their answers to these questions, variable “ENCOMA” is created to measure how may attributes an alternative has that is different from the endowed bundle.ii If a respondent is not certain about whether his/her most purchased oil has a certain attribute, the counter receives a zero. This is based on the notion that if a respondent is not sure about an attribute, he/she probably does not think this attribute is important and may pay less to no attention on this attribute in making a purchase decision. The presence or absence of the attribute does not contribute too much to the complexity of an alternative. This enables the choose-none option to be the simplest in terms of the endogenous complexity measure. It is noticeable that some studies have approached the difference between the endowed bundle and the alternatives offered in the choice experiment differently. For example, based on prospect theory Hu et al. (2006) analyze the impacts on choices from the absolute difference between the reference and the actual price of a product. This study, however, builds on the qualitative difference to obtain the complexity measures; i.e., on whether there is a
9
difference between the price in the endowed bundle and the price offered but not on how much the difference is.
The second endogenous complexity measure “ENCOMS” summarizes the complexity of the choice set. This can be explained in the following three situations: (1) if both alternatives have the same attribute and the attribute is missing in the endowed bundle, variable ENCOMS receives 1; (2) for the same attribute in (1) if it is also present in the endowed bundle, variable ENCOMS receives 0; (3) if one alternative contains an attribute but the other does not, then no matter whether the attribute is present or absent in the endowed bundle, ENCOMS receives 1. In addition to these endogenous complexity measures, we also include an exogenous complexity measure commonly seen in the literature. It is the number of choice tasks ranging from 1 to 8 corresponding to the sequence of choice tasks each respondent sees in the choice experiment. Table 1 summarizes the descriptive statistics of the attribute variables as well as the complexity measures. The variable representing the saturated fat content is omitted to avoid collinearity in model estimation.
Models Models in this study are based on random utility theory. Suppose the utility of individual i choosing alternative j in the t-th choice set is given by: (1)
U ijt = Vijt + ε ijt = X ijt β + ε ijt
In this expression, Vijt is the deterministic portion of the random utility, which can in turn be expressed by the attributes associated with the alternative represented by
10
vector X ijt ; β is a vector of unknown coefficients associated with the attributes; the error term ε represents the uncertainties in measuring this specific utility. If the error is assumed to follow iid maximum Gumbel distribution (Hu 2005), the probably of alternative j being chosen by individual i in the t-th choice set can be expressed by the logit model: (2)
Pijt =
exp(µ ijt X ijt β )
∑ exp(µ
k∈set t
ikt
X ikt β )
Pijt denotes the choice probability; µ ijt is the scale parameter associated with the maximum Gumbel distribution; and k indexes the alternatives within choice set t.
In this study, the endogenous complexity measure ENCOMA is alternative specific thus this variable and its squared term ENCOMA2 can be directly incorporated into the utility function; i.e., in vector X ijt . Literature on choice complexity and the status quo bias predicts that when the choice task becomes more complicated, there is a higher intention for respondents to stay out of the choice (Tversky and Shafir 1992, Dhar 1997, Moon et al. 2005). Furthermore, Dallaert et al. (2005) argue that when the choose-none option is included in a respondents’ choice set, higher choice complexity may change the utility associated with this option. Since the alternative specific complexity measure does not apply to the choose-none alternative (the alternative itself does not signify any complexity), the choice set specific measure ENCOMS is created to examine the impact of complexity on the behavior to switch out of the choice task. This is realized through the mixed logit model. In particular, we specify the coefficient associated with the alternative specific constant BUYNO as random and can be explained by variable
11
ENCOMS:iii (3)
β iBUYNO = α 0 + α 1 ENCOMS it + α 2 ENCOMS 2 it + φi
Variable ENCOMS2 is the square of ENCOMS and is added to reflect the possibility that the impact of the complexity measure on the attractiveness of the choose-none alternative may not be linear. The noise term φi is assumed to be iid normally distributed with 0 mean and standard deviation of σ φ , where σ φ is to be estimated.
As widely seen in the previous literature, exogenous complexity measures are often used to examine respondents’ choice consistency. Since the scale parameter µ ijt in equation (2) is inversely proportional to the standard deviation of the choice error (Train 2003), the impact of exogenous complexity measure on choice consistency can be modeled through reparameterized µ ijt . The exogenous complexity measures in this study is variable TASK and since this variable is choice set specific, µ ijt can be simplified into µ t and has the following form:iv (4)
µ t = exp(γ 1TASK t + γ 2TASK 2 t )
Similarly, the squared variable TASK2 is also included to reflect the possible nonlinear impact of variable TASK on choice errors. Substituting equations (3) and (4) into (2), one can obtain the fully parameterized logit model. The estimation of this model follows the simulated maximum likelihood estimation procedure outlined in Trian (2003) with 120 Halton replications. The simulated log likelihood function is: (5)
N
T
J
i
t
j
( )
LL = ∑∑∑ I ijt ln Pijts
12
where I ijt is an indicator variable only equals one if individual i has chosen alternative j in the t-th choice set. Pijts is the corresponding simulated probability according to the density function of the random parameter for BUYNO.
Utility Estimation Results A series of models have been estimated to show the differences among specifications involving different complexity measures. Table 2 presents these results. The signs and significance level of parameters in all models are consistent showing that the specifications are robust. The magnitude of the parameters cannot be directly compared across models due to the factor of scaling in estimation. The indirect comparison however is possible when we show the implied marginal effects in the next section. The first model is a conditional logit including no complexity measures. Conditional logit model II includes the alternative specific measures and it significantly increases the model fit. Mixed logit model I incorporates the choice set specific endogenous complexity measures into the random parameter specification for the BUYNO variable. Originally both ENCOMS and the squared term ENCOMS2 were used but the squared term was found insignificant and subsequently dropped from the analysis. The mixed logit model significantly improves the model fit. The final model is the mixed logit model II where the exogenous complexity measures are used to explain choice consistency. Since this model has the highest model fit, we focus our discussion based on this specification.
13
Variable BUYNO is significantly negative. This shows that on average Japanese consumers would like to be able to purchase canola oil when given the opportunity. Making no choices, either due to the unattractiveness of the alternatives offered or to other reasons, causes utility loss. Among the four types of nutrients relating to health information, respondents treat the content of Vitamin E as less preferred to a claim of low in saturated fat (the omitted category). The high in Oleic acid claim and the high in AL acid claim are treated equally as the low in saturated fat claim. Genetically modified content in oil is strongly disliked by the respondents given the negative coefficient associated with variable GM. The presence of both types of certificates (either for organic food or for functional food) is desired by the respondents. Finally it seems that Japanese consumers do not prefer imported oil as revealed by the significantly negative coefficient of variable IMP.
Before we interpret the complexity measures in the utility function, further refinement to the mixed logit model II may be conducted by checking for whether there is heterogeneity associated with variables ENCOMA and ENCOMA2. A separate mixed logit model was estimated and we found the standard deviation terms of the above two variables were not significant. This shows that at least for this study, there is no evidence that respondents’ characteristics (such as demographics) affect the weights of the endogenous complexity measures in their utility function and decision making. Based on exogenous complexity measures, past studies have shown that respondents’ perceptions, experience, and knowledge all may play a role in shifting the impacts of the complexity measures. This article from another perspective suggests that because the complexity
14
measures used are endogenous, they may have already reflected a significant amount of individual information of the respondents contained in the endowed bundle, further heterogeneity among the respondents is therefore controlled. Since both the original and squared term of variable ENCOMA are significant, this implies that respondents’ reaction towards the complexity issue is not linear. Based on the estimated coefficient and the range of the ENCOMA variable (0-6), Figure 3 sketches the impact of these measures to the utility.
First, when an alternative is identical to the endowed bundle, no complexity is involved and the impact of complexity to the utility is also zero. When the offered alternative deviates from the endowed bundle, the utility will be affected negatively and the lowest utility is observed when 3 attributes in the offered alternative are different from those in the endowed bundle. Importantly, after this point, the marginal increase in complexity will actually produce marginal increase the utility as well although the total impact on utility remains negative. This pattern however stopped at the point where 5 attributes are different. When the offered alternative is completely different from the endowed bundle in all 6 attributes as defined, the utility associated with the alternative becomes positive, holding other factors constant. This finding may suggest an implicit trade off between the tendency of habit keeping and variety seeking: in general consumers would like to stay with the product they are familiar with and normally purchase. When a product offered is different from this endowed bundle, consumers tend to reject this product. However when a certain bench market is passed (3 attributes in this study), the alternative offered may be so different than the endowed bundle that it represents an almost different
15
type of product. The variety seeking behavior starts to overshadow the habit keeping behavior and the offered alternative does not seem to be “so bad” any more. Finally, when the offered alternative is completely different from their endowed bundle, consumers may actually want to try this new alternative.
Variable ENCOMS shows a different type of impact on the utility. Recall equation (3) that this choice set specific endogenous complexity measure is to explain the behavior whether to participate in the choice task and the impact is linear according to the estimation result. Due to the negative coefficient estimate of α 1 , the utility associated with the choose-none alternative is monotonically decreasing over variable ENCOMS. The range of variable ENCOMS is from 2 to 6 in the data. Together with the estimates of α 0 (-1.202) and α 1 (-0.053) in Table 2, one can calculate the range of the overall utility coefficient associated with the choose-none alternative, the range which is from -1.308 to -1.520. These results show that when the endogenous complexity of a choice occasion increases, the respondents would be more likely to avoid the choose-none option but to get involved into the choice task. Furthermore, the standard deviation of BUYNO (variable SD-BUYNO) is significantly different from zero. This indicates that even after incorporating the choice set specific complexity measure ENCOMS as a covariate of the sample average estimate of the coefficient associated with the choose-none alternative, there is still unexplained heterogeneity across the sampled individuals on how they may react towards this choice option. As we pointed out earlier, although additional variables such as respondents’ demographic characteristics may be easily included in equation (3)
16
to further explain the heterogeneity, the purpose of this study is not to examine this type of question and hence results incorporating these variables are not reported.
The effect of the complexity measure ENCOMS on the choose-none alternative may initially seem somewhat counter-intuitive. Conlon et al. (2001a) suggest that the effort respondents put into choice tasks is often correlated with the task complexity. If more effort is involved, a more exogenously complicated task may be converted into a simpler task and therefore the choice becomes not as-much of a deterring task. Since we did not explicitly model respondents’ effort involved in the choices, this consideration remains a possible explanation. Another similar explanation is offered by Haaijer et al. (2000) and DeShazo and Fermo (2002) in that respondents’ effort may not be able to keep up with the increasing degree of choice task complexity and the attractiveness of the choose-none option may indeed be a nonlinear function in the choice complexity. Since our model did not show this nonlinear effect, we cannot draw a clear conclusion on whether this may occur in a conjoint experiment with much more attributes involved than the current study.
Finally, in this analysis the exogenous complexity measure TASK as well as its quadratic term TASK2 are found to be significant in explaining the scale of the choice probabilities. The scale parameter is inversely proportional to the standard errors of choices, which explains the consistency of choices across choice sets. Based on the coefficients associated with these two variables, the scale and choice standard errors are plotted over variable TASK in Figure 4. The relationship is also nonlinear. Over the beginning 6 choice sets, the errors of choices are decreasing indicating a learning effect
17
in that respondents attract experience from previous choices and they can make choices more closely to what they intend to make. As the choice tasks continue however, the fatigue effect, which may previously co-exist with the learning effect, begins to dominate. The choices are features by more noises after the 6th choice set. Respondents may be cognitively tired after seeing and making choice decisions 6 times and they may start to pay increasingly less attention to the last two choice sets and make decisions that can simply lead them through the survey. This may lead the choices to look closer to random than before and therefore increase the choice errors.
Marginal Values To substantiate the impact of the endogenous complexity variables, Table 3 presents the marginal values of some selected variables. Marginal values are calculated as the ratio between the coefficient of an interested attribute and the opposite of the price coefficient. Attributes selected for this purpose are GM (GM content), IMP (imported), and BUYNO. GM is selected because consumers’ willingness to pay (WTP) for GM food has been a widely discussed topic around the world in both science and social science. Attribute IMP is selected because seeing Japanese consumers’ WTP for imported oil may have implications to both Japanese domestic canola oil producers/sellers and to international vegetable oil traders. Although BUYNO in its own sense is not an attribute, its marginal value shows the desirability of the third alternative in each choice set—the alternative that allows respondents to switch out of the market.
18
All confidence intervals of the marginal values in Table 3 are calculated by simulating from the multivariate normal distribution constructed by the estimated parameter vector and the covariance matrix in the mixed logit model. These confidence intervals show that all marginal values are negative and are significantly different from zero. When calculating these marginal values, the default case (the left column of Table 3) is that the complexity variable ENCOMA is maintained as the sample median, which is 3. The right column of the table shows the situation when one additional unit of complexity is generated by a particular attribute. The mean marginal value of variable GM evaluated at the median endogenous complexity is -1625.32 Yen. However, when the presence of GM attribute increases the complexity of the alternative it is in (from 3 to 4 for variable ENCOMA), the marginal value becomes -1522.323 Yen, which is much less negative. This is because the nonlinear impact of the complexity effects represented by variables ENCOMA and ENCOMA2. Similarly, for the attribute “imported”, if one additional unit of complexity measure is created by including the attribute IMP into the alternative, the marginal value of IMP increases by more than 100 Yen. These results show that if the research wishes to obtain the WTP for the GM attribute from a conjoint experiment, the complexity measures may need to be considered as it makes a sizeable difference of the implied marginal value and eventually the WTP measure. For international vegetable oil traders, understanding Japanese consumers’ WTP for imported canola oil has important implications to their trading plan. This study shows that the WTP measure of imported canola oil may also be affected by whether the complexity factors are considered in the conjoint experiment.
19
The marginal value associated with variable BUYNO is a little more complicated than that for attributes GM and IMP. The coefficient of BUYNO was specified as a random parameter with covariate ENCOMS. This makes it important to know the level of variable ENCOMS. In Table 3, ENCOMS is first evaluated at the sample median assuming the number of difference attributes between the other two alternatives in a choice set after comparing with the endowed bundle is 4. Since the choose-none option does not represent any complexity, different assumptions on variable ENCOMA will not affect the marginal value of BUYNO. On the other hand, marginal value of BUYNO is calculated based on the assumption that the value of variable ENCOMS is assumed to be 5 rather than 4. Clearly, increasing the endogenous complexity of the choice set will decrease the utility associated with the choose-none option. This reduction is introduced by the negative coefficient associated with the linear term ENCOMS. Its effect on the marginal value of BUYNO appears to be smaller than the alternative specific complexity measure ENCOMA (and its square term) on the marginal values of the attributes.
Conclusion This study is targeted at understanding the impacts of choice task complexity on decision making in the context of stated choice. It raises and tests an important postulation that complexity should not only be defined exogenously through the choice tasks themselves but also from the perspectives of the respondents based on their experience prior entering the choice tasks given. This produces the endogenous complexity measures. In this study, pre-existing experience is described by respondents’ most commonly consumed product known as the endowed bundle. We show that there exist potential significant
20
differences between the two types of complexity measures and due to this difference the endogenous complexity may offer a potential to explain some discrepancies in the relevant literature.
The endogenous complexity has important implications to the utility associated with an alternative. The impact is not linear over the increasing of complexity. We find that when a choice alternative becomes more different and implicitly be more complicated to respondents, they may instead choose this product if it shows enough difference to the one they normally purchase. We contend that this is a result of the relative strength between the behavior of habit keeping and variety seeking. Furthermore, because the alternative specific endogenous complexity measure has incorporated information regarding each respondent, further between-subject heterogeneity in the models may be reduced. Along with the increase of complexity, the utility of the choose-none option also decreases indicating a sign of more involvement of the respondents into the choice tasks. In addition to endogenous complexity, as in previous literature, we show that the exogenous complexity measures also have important impacts on the consistency of choices. Marginal values of several selected variables are calculated which reinforces the importance of including the complexity measures into the choice model. Finally, although in this study, the product involved is canola oil, it is worth pointing out that by minor adjustment, the hypotheses and testing approaches in this article also applies to other types of goods such as visits to a park, attractiveness of a piece of antique, choice of transportation modes as well as food or other consumption goods.
21
References
Arentze, T., A. Borgers, H. Timmermans and R. DelMistro (2003) “Transport Stated Choice Responses: Effects of Task Complexity, Presentation Format and Literacy”
Transportation Research E 39: 229-244. Conlon, B., B. G. C. Dellaert and A. van Soest (2001a) “Complexity and Accuracy in Consumer Choice: The Double Benefits of Being the Consistently Better Brand” Working Paper, Tilburg University. ________ (2001b) “Consumer Choices Between Few Alternatives: A Mixed Logit Model with Utility-Based Attribute Consideration Thresholds” Working Paper, Tilburg University. Dellaert, B. G. C. and S. Stremerschm (2005) “Marketing Mass-Customized Products: Striking a Balance Between Utility and Complexity” Journal of Marketing
Research 42: 219-227. DeShazo, J. R. and G. Fermo (2002) “Designing Choice Sets for Stated Preference Methods: The Effects of Complexity on Choice Consistency” Journal of
Environmental Economics and Management 44: 123-143. ________ (2004) “Implications of Rationally-Adaptive Pre-Choice Behavior for the Design and Estimation of Choice Models” Working Paper, School of Policy and Social Research, University of California at Los Angeles. Dhar, R. (1997) “Consumer Preference for a No-Choice Option” Journal of Consumer
Research 24: 215-231. Haaijer, R., W. Kamakura and M. Wedel (2000) “Response Latencies in the Analysis of Conjoint Choice Experiments” Journal of Marketing Research 37: 376-382.
22
Hensher, D. A., J. Rose and W. H. Greene (2005) “The Implications on Willingness to Pay of Respondents Ignoring Specific Attributes” Transportation 32: 203-222. Hu W. (2005) “Logit Models: Smallest versus Largest Extreme Value Error Distributions” Applied Economics Letters 12: 741-744. Hu, W., W. Adamowicz and M. Veeman (2004) “Individual-Level Approaches to Demand Analysis: Innovations and Challenges” Working Paper, Department of Resource Economics, University of Nevada, Reno. Hu, W., W. Adamowicz and M. Veeman (2006) “Labeling Context and Reference Point Effect in Models of Food Attribute Demand” American Journal of Agricultural
Economics forthcoming. Huneke, M. E., C. Cole and I. P. Levin (2004) “How Varying Levels of Knowledge and Motivation Affect Search and Confidence during Consideration and Choice”
Marketing Letters 15: 67-79. Johnson, E. J. and J. W. Payne (1985) “Effort and Accuracy in Choice” Management
Science 31: 395-414. Kahneman, D. and A. Tversky (1979), “Prospect Theory: An Analysis of Decision under Risk” Econometrica 47: 263-291. Masatlioglu, Y. and E. A. OK (2005) “Rational Choice with Status Quo Bias” Journal of
Economic Theory 121: 1-29. Moon, A., P. C. Boxall and W. Adamowicz (2005) “Complexity in Choice Experiments: Choice of the Status Quo Alternatives” Working Paper, Department of Rural Economy, University of Alberta.
23
Munro, A. and R. Sugden (2002) “On the Theory of Reference-Dependent Preferences”
Journal of Economic Behavior and Organization 50: 407-428. Sandor, Z. and P. H. Franses (2004) “Experimental Investigation of Consumer Price Evaluations” Technical Report, Econometric Institute, Erasmus University Rotterdam. Sandor, Z. and M. Wedel (2005) “Heterogeneous Conjoint Choice Designs” Journal of
Marketing Research 42: 210-218. Swait, J. and W. Adamowicz (2001a) “The Influence of Task Complexity on Consumer Choice: A Latent Class Model of Decision Strategy Switching” Journal of
Consumer Research 28: 135-148. ________ (2001b) “Choice Environment, Market Complexity and Consumer Behavior: A Theoretical and Empirical Approach for Incorporating Decision Complexity in Models of Consumer Choice” Organizational Behavior and Human Decision
Processes 86: 141-167. Train, K. Discrete Choice Methods with Simulation. Cambridge University Press, 2003. Tversky, A. and E. Shafir (1992) “Choice Under Conflict: The Dynamics of Deferred Decision” Psychological Science 3: 358-361.
24
Table 1. Definition and Descriptive Statistics of Variables Variable BUYNO OLE VE ALP GM JAS FOS IMP PRICE ENCOMA ENCOMA2 ENCOMS ENCOMS2 TASK TASK2
Definition Alternative specific constant for the choose-none alternative Dummy variable for Oleic acid Dummy variable for Vitamin E Dummy variable for AL acid Dummy variable for Genetically Modified content Dummy variable for organic food label Dummy vairale for functional food label Dummy variable for imported oil Price Alternative specific endogenous complexity Alternative specific endogenous complexity squared Choice set specific endogenous complexity Choice set specific endogenous complexity squared Choice set sequence number as exogenous complexity Choice set sequence number as exogenous complexity squared
Mean 0.333 0.166 0.167 0.167 0.333 0.167 0.333 0.333 306.977 1.339 3.749 5.472 30.450 4.500 25.500
Std. Dev. 0.471 0.372 0.373 0.373 0.471 0.373 0.471 0.471 242.231 1.398 5.631 0.711 7.161 2.291 21.126
25
Table 2. Estimation Results Variable BUYNO OLE VE ALP GM JAS FOS IMP PRICE# ENCOMA ENCOMA2 ENCOMS SD-BUYNO TASK TASK2
Conditional Logit I Coeff. Std. Dev. -0.974*** 0.159 -0.081905 0.096 -0.297*** 0.085 0.037041 0.097 -1.879*** 0.088 0.313*** 0.091 0.700*** 0.063 -0.832*** 0.072 -1.305*** 0.265
Conditional Logit II Coeff. Std. Dev. -1.155*** 0.183 -0.110 0.097 -0.326*** 0.086 0.011 0.098 -1.856*** 0.089 0.324*** 0.091 0.706*** 0.063 -0.808*** 0.075 -1.267*** 0.266 -0.252*** 0.089 0.054*** 0.018
Mixed Logit I Coeff. Std. Dev. 0.849 0.651 -0.268* 0.132 -0.365*** 0.090 -0.031 0.124 -2.083*** 0.086 0.445*** 0.137 0.855*** 0.073 -1.063*** 0.084 -1.403*** 0.000 -0.367*** 0.120 0.071*** 0.022 -0.466*** 0.102 2.073*** 0.123
Mixed Logit II Coeff. Std. Dev. -1.202*** 0.310 -0.034 0.058 -0.134*** 0.050 0.0076 0.051 -0.811*** 0.150 0.182*** 0.065 0.322*** 0.063 -0.390*** 0.082 0.649*** 0.129 -0.180*** 0.060 0.035*** 0.011 -0.053** 0.021 -2.019*** 0.119 0.408*** 0.086 -0.035*** 0.009
LL -2608.839 -2604.293 -2274.001 -2252.810 0.179 0.181 0.284 0.301 adj. ρ 2 # Coefficient reported is based on original variable divided by 1000. *, **, and *** represents significant at the 10%, 5%, and 1% significance level respectively.
Table 3. Marginal Values of Selected Variables Attribute GM IMP
BUYNO with (median ENCOMS)
Median Complexity*
Additional Complexity*
-1625.32
-1522.32
(-1633.32, -1617.31)
(-1530.10, -1514.54)
-966.29
-863.29
(-972.20, 960.37)
(-869.14, 857.44)
-2238.75
-
(-2253.13, -2224.37)
-
BUYNO (with median plus -2323.39 additional one unit (-2337.63, -2309.15) ENCOMS) * Numbers in parentheses are lower and upper bounds of the 95% confidence interval based on 5000 simulation replications.
26
Attributes 1 2 3 4 5 6
Endowed Bundle
Choice Set 1 (exogenously complex) Alt. A Alt. B
Choice Set 2 (exogenously simple) Alt. C Alt. D
endogenously equivalent
Figure 1. Exogenous and endogenous complexity measures
Now suppose you are shopping for a bottle of vegetable oil. The following choices are the ONLY ONES AVAILABLE to you in the grocery store. The oil you buy is WELL PRESENTED (i.e. no damaged bottle, etc.). Please examine each choice below and choose by circling ONE AND ONLY ONE of the three options. Canola oil A
Canola oil B
Health information
Low in Saturated Fat
Vitamin E Enriched
Derived from GM Canola Seeds
No
No
Domestic or imported
Domestic
Domestic
Price(600g)
498 Yen
498 Yen
ª
ª
Buy none of These
Certificates
1 CIRCLE ONE ONLY Figure 2. A sample choice set in questionnaire
ª 2
3
27
0.20
Increase in Utility
0.10
0.00 0
1
2
3
4
5
6
-0.10
-0.20
-0.30 Endogenous Complexity
Figure 3. Impacts on utility by the alternative specific endogenous complexity measure
3.5 3
Measure
2.5 2 1.5 1 0.5 0 1
2
3
4 5 Task Sequence
Scale
6
7
8
Standard Error
Figure 4. Impacts on scale and choice error from task sequence as the exogenous complexity measure
28
Notes i
There appears to be some difference in the literature of how to determine whether a
choice set is complex. Swait and Adamowicz (2001a,b) assume that if two alternatives are similar in their attributes, it is difficulty to find out which one is more attractive. Sandor and Franses (2004) and DeShazo and Fermo (2002) argue that if the attributes of two alternatives are more apart, more effort is required to understand each attribute and therefore the task becomes more cognitively complex. This study follows the second type of assumption. This is because in this study, except price, all other attributes are dummy variables. If two attributes are ‘similar’, they will be identical and simple to evaluate. ii
To give a more manageable measure of complexity, we treat the health information as
one attribute. That is, if a respondent feels that the canola oil he/she normally purchases is low in saturated fat but the health information of a given alternative shows “high in AL acid” then we count this as one difference. We treat the organic food label and functional food label in the certificates as two separate features and each may create a difference. Therefore, the total number of different attributes between an endowed bundle and a given alternative is from 0 to 6. iii
Other variables such as respondents’ demographic variables may too be used as
covariates in explaining the random coefficients. This creates a great variety of model specifications. Since the purpose of this article is to focus on the complexity measures, these other specifications were attempted but not incorporated into the current analysis.
29
iv
The scale parameter may also be alternative specific and/or individual specific
depending on the assumption. For example, Hu et al. (2004) estimated a fixed effect scale function in a mixed logit model.
30