by Jessie Y. C. Chen, Michael J. Barnes, and Caitlin Kenny. ARL-TR-5643 ... Jessie Y. C. Chen and Michael J. Barnes ...... FORT GORDON GA 30905-5233. 1.
Effects of Imperfect Automation on Operator’s Supervisory Control of Multiple Robots by Jessie Y. C. Chen, Michael J. Barnes, and Caitlin Kenny
ARL-TR-5643
Approved for public release; distribution is unlimited.
August 2011
NOTICES Disclaimers The findings in this report are not to be construed as an official Department of the Army position unless so designated by other authorized documents. Citation of manufacturer’s or trade names does not constitute an official endorsement or approval of the use thereof. Destroy this report when it is no longer needed. Do not return it to the originator.
Army Research Laboratory Aberdeen Proving Ground, MD 21005-5425
ARL-TR-5643
August 2011
Effects of Imperfect Automation on Operator’s Supervisory Control of Multiple Robots Jessie Y. C. Chen and Michael J. Barnes Human Research and Engineering Directorate, ARL
Caitlin Kenny University of Central Florida
Approved for public release; distribution is unlimited.
Form Approved OMB No. 0704-0188
REPORT DOCUMENTATION PAGE
Public reporting burden for this collection of information is estimated to average 1 hour per response, including the time for reviewing instructions, searching existing data sources, gathering and maintaining the data needed, and completing and reviewing the collection information. Send comments regarding this burden estimate or any other aspect of this collection of information, including suggestions for reducing the burden, to Department of Defense, Washington Headquarters Services, Directorate for Information Operations and Reports (0704-0188), 1215 Jefferson Davis Highway, Suite 1204, Arlington, VA 22202-4302. Respondents should be aware that notwithstanding any other provision of law, no person shall be subject to any penalty for failing to comply with a collection of information if it does not display a currently valid OMB control number.
PLEASE DO NOT RETURN YOUR FORM TO THE ABOVE ADDRESS. 1. REPORT DATE (DD-MM-YYYY)
2. REPORT TYPE
3. DATES COVERED (From - To)
August 2011
Final
1 October 2009–30 September 2010
4. TITLE AND SUBTITLE
5a. CONTRACT NUMBER
Effects of Imperfect Automation on Operator’s Supervisory Control of Multiple Robots
5b. GRANT NUMBER 5c. PROGRAM ELEMENT NUMBER
6. AUTHOR(S)
5d. PROJECT NUMBER
Jessie Y. C. Chen, Michael J. Barnes, and Caitlin Kenny* 5e. TASK NUMBER 5f. WORK UNIT NUMBER 7. PERFORMING ORGANIZATION NAME(S) AND ADDRESS(ES)
8. PERFORMING ORGANIZATION REPORT NUMBER
U.S. Army Research Laboratory ATTN: RDRL-HRM-AT Aberdeen Proving Ground, MD 21005-5425
ARL-TR-5643
9. SPONSORING/MONITORING AGENCY NAME(S) AND ADDRESS(ES)
10. SPONSOR/MONITOR’S ACRONYM(S)
Safe Operations for Unmanned Reconnaissance in Complex Environments Army Technology Objective
SOURCE ATO 11. SPONSOR/MONITOR'S REPORT NUMBER(S)
12. DISTRIBUTION/AVAILABILITY STATEMENT
Approved for public release; distribution is unlimited. 13. SUPPLEMENTARY NOTES *
University of Central Florida, Institute for Simulation & Training, Orlando, FL
14. ABSTRACT
A military multitasking environment was simulated to examine the performance of robotics operators whose task was to manage a team of four ground robots with the assistance of RoboLeader, an intelligent agent that could coordinate the robots by changing their plans based on developments in the mission environment. The reliability of RoboLeader’s recommendations was manipulated to be either false-alarm prone (FAP) or miss prone (MP), with a reliability level of 60% or 90%. The visual density of the targeting environment was also manipulated. Results showed that the type of RoboLeader unreliability (FAP vs. MP) affected operator’s performance of tasks involving visual scanning (target detection, route editing, and situation awareness). There was a consistent effect of visual density for multiple performance measures. Participants with higher spatial ability performed better on the two tasks that required most visual scanning (i.e., target detection and route editing). Participants’ self-assessed attentional control was found to impact their secondary tasks (communication and gauge monitoring) more than their primary tasks (target detection and route editing). 15. SUBJECT TERMS
human-robot interaction, simulation, supervisory control, imperfect automation, reliability, individual differences 17. LIMITATION OF ABSTRACT
16. SECURITY CLASSIFICATION OF: a. REPORT
b. ABSTRACT
c. THIS PAGE
Unclassified
Unclassified
Unclassified
18. NUMBER OF PAGES
19a. NAME OF RESPONSIBLE PERSON
Jessie Y. C. Chen 19b. TELEPHONE NUMBER (Include area code)
UU
44
407-384-3968 Standard Form 298 (Rev. 8/98) Prescribed by ANSI Std. Z39.18
ii
Contents
List of Figures
v
List of Tables
vi
1. Introduction
1
2. Method
3
2.1 Participants ......................................................................................................................3 2.2 Apparatus.........................................................................................................................4 2.2.1 Simulator .............................................................................................................4 2.2.2 Simulation of Unreliable RoboLeader ................................................................5 2.3 Surveys and Tests ............................................................................................................5 2.4 Procedure .........................................................................................................................5 2.5 Experimental Design .......................................................................................................8 2.6 Measures and Data Analysis ...........................................................................................8 3. Results
8
3.1 Target Detection Performance.........................................................................................8 3.2 Route Editing.................................................................................................................10 3.3 Situation Awareness ......................................................................................................11 3.4 Communication Task Performance ...............................................................................12 3.5 Gauge Monitoring Performance ....................................................................................12 3.6 Perceived Workload ......................................................................................................12 3.7 Operators’ Interaction With the Operator Control Unit ................................................13 4. Discussion
14
5. References
17
Appendix A. Demographic Questionnaire
21
Appendix B. Attentional Control Survey
23
iii
Appendix C. National Aeronautics and Space Administration – Task Load Index Questionnaire
25
Appendix D. Usability/Trust Survey
27
Appendix E. Situation Awareness Queries
31
List of Symbols, Abbreviations, and Acronyms
33
Distribution List
34
iv
List of Figures Figure 1. RoboLeader operator control unit. ..................................................................................4 Figure 2. Target detection. ..............................................................................................................9 Figure 3. Target detection and spatial ability................................................................................10 Figure 4. Routes edited. ................................................................................................................10 Figure 5. Routes edited and spatial ability. ...................................................................................11 Figure 6. Situation awareness. ......................................................................................................11 Figure 7. Communication task performance. ................................................................................12 Figure 8. Gauge monitoring task performance and PAC. .............................................................13 Figure 9. Perceived workload. ......................................................................................................13 Figure 10. Performance difference between low- and high-PAC individuals in the MP condition. .................................................................................................................................16
v
List of Tables Table 1. Operator task performance and subjective assessments (standard deviations are presented in parentheses) by unreliability type, reliability level, and visual density. ...............9
vi
1. Introduction Unmanned vehicles (UV) are being utilized more frequently in military operations, and the types of tasks they are being used for are evolving in complexity. In the future battlefield, Soldiers may be given multiple tasks to perform concurrently, such as navigating a UV while conducting surveillance, maintaining local security and situation awareness (SA), and communicating with fellow team members. In order to maximize human resources, it is desirable to designate a single operator to supervise multiple UVs simultaneously. However, past research has shown that human operators are often unable to control multiple robots/agents simultaneously in an effective and efficient manner (Chen et al., 2008; Schurr, 2007). Additionally, as the size of the robot team increases, the human operators may fail to maintain adequate SA when their attention has to constantly switch among the robots, and their cognitive resources may be overwhelmed by the intervention requests from the robots (Wang et al., 2008, 2009). Wang et al. (2009) reviewed a number of studies on supervisory control of multiple ground robots for target detection tasks and concluded that the fan-out (the number of robots that a user can effectively operate at once [Olsen and Goodrich, 2003]) plateau lies “somewhere between 4 and 9+ robots depending on the level of robot autonomy and environmental demands” (p. 143). Research shows that autonomous cooperation between robots can aid the performance of the human operators (Wang et al., 2008) and enhance the overall human-robot team performance (Schurr, 2007). However, in the foreseeable future, human operators’ involvement in mixedinitiative teams will always be required, especially for critical decision making. Human operators’ decision making may be influenced by “implicit goals” that the robots are not aware of (i.e., are not programmed into the behaviors of the robots) (Linegang et al., 2006). In addition, the real-time development on the battlefield may require the human operator to change the plan for the robot team and/or for the individual robots. Therefore, effective communication between the human operator and the robots is critical in ensuring mission successes. Research has been conducted on ways to enhance human-robot communication (Stubbs et al., 2008). For example, researchers at Carnegie Mellon University demonstrated the effectiveness of a robot proxy to enhance shared understanding between the human operator and the robot in an exploration task (Stubbs et al., 2008). The communication mechanism was based on a common ground collaboration model and was able to improve the human operator performance in the following areas: more accurate plans, more efficient planning (fewer planning repetitions), more efficient and faster task performance, and better mental model of the capabilities of the robot (Stubbs et al., 2008). To achieve a better balance of enhancing autonomy and capability while simplifying humanrobot interaction, it was proposed to institute the concept of RoboLeader, a robotic surrogate for the human operator (Chen et al., 2010). The RoboLeader is an agent that interprets an operator’s
1
intent and issues detailed command signals to a team of robots of lower capabilities. In other words, instead of directly managing the robot team himself/herself, the human operator only deals with RoboLeader, which should result in a reduction in the operator’s mental workload. Consequently, the operator can better focus on the other tasks that require his/her attention. In Chen et al. (2010), the effectiveness of RoboLeader was investigated in a human-in-the-loop simulation experiment. The results showed that although there were no significance differences between the RoboLeader and baseline (no RoboLeader) conditions for target detection performance, participants in the RoboLeader group reduced their mission completion times by ~13% compared to the baseline group. The participants detected significantly fewer targets when there were eight robots compared to the four-robot condition, although participants with higher spatial ability (SpA) detected more targets than those with lower SpA. Those with lower SpA did not seem to benefit from RoboLeader as much as their higher SpA counterparts. It is likely that the lower SpA participants’ scanning of the streaming videos on the operator control unit (OCU) was more disrupted by their interaction with RoboLeader, whereas the higher SpA participants’ scanning was more effective and less affected by their interaction with RoboLeader. When there were eight robots, participants’ SA was significantly worse than when there were only four robots. On the other hand, the SA of the RoboLeader participants was not significantly degraded compared with the baseline group. In other words, the “out-of-the-loop” phenomenon associated with automation as reported in previous research was not manifested in the RoboLeader condition. Finally, participants experienced significantly higher workload when there were eight robots compared to the four-robot condition, and those with better attentional control reported lower workload than did those with poorer attentional control. Males and those with more video gaming experience also reported significantly lower workload than their counterparts. In the current study, the effects of various reliability levels for RoboLeader on operator performance were investigated. More specifically, the reliability of RoboLeader’s recommendations was manipulated to be either false-alarm prone (FAP) or miss prone (MP), with a reliability level of 60% or 90%. The effects of imperfect automation are examined by Meyer (2001, 2004), who suggests that FAP and MP alerts can have an effect on the use of an automated system. High false alarm (FA) rates reduced the operator’s response to alerts, and high miss rates reduced the operator’s reliance on automated systems. Wickens et al. (2005a) showed that the operator’s automated task performance degraded when the FA rate of the alerts for the automated task was high. In other words, high FA rate reduced operator’s compliance with automation. Conversely, when the miss rate was high, the concurrent task performance was affected more than the automated task because the operator had to allocate more visual attention to monitor the automated task. In other words, high miss rate reduced operator’s reliance on automation. In contrast, Dixon et al. (2006) showed that FA-prone automation hurt “performance more on the automated task than did miss-prone automation, (e.g., the “cry wolf” effect) and hurt performance (both speed and accuracy) at least as much as miss-prone automation on the concurrent task” (p. 11). Similarly, Wickens et al. (2005a) demonstrated 2
a greater cost associated with FA-prone automation (than with miss prone automation), which affected both the automated and concurrent tasks. Additionally, giving higher priority to the FA-prone automated task actually hurt the performance rather than enhancing it. Finally, Wickens and Dixon (2005) demonstrated that when the reliability level is below about 70%, operators will often ignore the alerts. In their meta-analytic study, Wickens and Dixon found that “a reliability of 0.70 was the ‘crossover point’ below which unreliable automation was worse than no automation at all.” The effects of individual differences factors on operator performance were evaluated. More specifically, the effects of individual differences in SpA and perceived attentional control (PAC) on the operators’ robotics control, as well as multitasking performance, were investigated. Lathan and Tracey (2002) demonstrated that people with higher SpA performed better in a teleoperation task through a maze. They finished their tasks faster and had fewer errors. Lathan and Tracey suggested that military missions can benefit from selecting personnel with higher SpA to operate robotic devices. Previous studies also found SpA to be a good predictor of the operator’s robotics performance (Chen et al., 2008, 2010). In Chen et al. (2010), participants with higher SpA scanned the videos significantly faster than those with lower SpA. The relationship between attentional control and multitasking performance was also examined. Several studies show that there are individual differences in multitasking performance, and some people are less prone to performance degradation during multitasking conditions (Rubinstein et al., 2001). There is evidence that people with better attention control can allocate their attention more flexibly and effectively (Derryberry and Reed, 2002), and this was partially confirmed by Chen and Joyner (2009). Finally, Chen and Terrence (2009) found a strong interaction between the type of automation unreliability and participants’ attentional control for almost all the performance measures in their study on multitasking performance of gunnery and robotics tasks. Overall, it appears that for high-PAC participants, FAP alerts were more detrimental than MP alerts. High-PAC participants tended to rely on their own multitasking ability instead of relying on the automated systems. However, for low-PAC participants, MP automation was more harmful than FAP automation. Low-PAC participants relied on the MP automated systems more than they should have; however, their trust in the FAP system resulted in better performance than the high-PAC participants’. The current study sought to examine whether individuals with different attentional control abilities interacted differently with FAP and MP RoboLeader.
2. Method 2.1 Participants Forty individuals (23 males and 17 females; mean age 23.75 years) from the Orlando, FL, area participated in the study. They were compensated $15/h for their time.
3
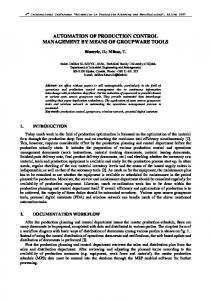
2.2 Apparatus 2.2.1 Simulator A modified version of the Mixed Initiative Experimental (MIX) Testbed was used as the simulator for this experiment. The MIX Testbed is a distributed simulation environment for investigation into how unmanned systems are used and how automation affects human operator performance (Barber et al., 2008). The OCU of the MIX Testbed (figure 1) was modeled after the Tactical Control Unit developed under the U.S. Army Research Laboratory Robotics Collaborative Technology Alliance. This platform includes a camera payload and supports multiple levels of automation. Users can send mission plans or teleoperate the platform with a computer mouse while being provided a video feed from the camera payload. Typical tasks include reconnaissance and surveillance. RoboLeader has the capability of collecting information from subordinate robots with limited autonomy (e.g., with capability of collision avoidance and self-guidance to reach target locations), making tactical decisions, and coordinating the robots by issuing commands, waypoints, or motion trajectories (Chen et al., 2010). More information about the RoboLeader agent can be found in Snyder et al. (2010).
Figure 1. RoboLeader operator control unit.
4
2.2.2 Simulation of Unreliable RoboLeader In Chen et al. (2010), the simulated reliability level of RoboLeader’s recommendations was 100% (i.e., no FAs or misses). In the current study, the reliability of RoboLeader was either FAP or MP, at a level of either 60% or 90%. This created the following four different RoboLeader reliability conditions: FAP60, FAP90, MP60, and MP90 (see section 2.4). 2.3
Surveys and Tests
A demographics questionnaire (appendix A) was administered at the beginning of the training session. An Ishihara Color Vision Test with nine test plates was administered via PowerPoint presentation to ensure that the participants’ color vision was normal. The Attentional Control Survey (appendix B; Derryberry and Reed, 2002) was used to evaluate participants’ perceived attentional control. The Attentional Control Survey consists of 21 items and measures attention focus and shifts. The scale has been shown to have good internal reliability (α = 0.88). The Cube Comparison Test (Ekstrom et al., 1976) was used to assess participants’ spatial ability. The Cube Comparison Test requires participants to compare, in 3 min, 21 pairs of 6-sided cubes and determine if the rotated cubes are the same or different. Participants’ perceived workload was evaluated with the computerized version of the National Aeronautics and Space Administration – Task Load Index (NASA-TLX) questionnaire (appendix C), which uses a pair wise comparison weighting procedure (Hart and Staveland, 1988). The NASA-TLX is a self-reported questionnaire of perceived demands in the following six areas: mental, physical, temporal, effort (mental and physical), frustration, and performance. Participants evaluated their perceived workload level in these areas on 10-point scales, as well as by completing pair wise comparisons for each subscale. A modified version of the Usability/Trust Survey used in Chen and Terrence (2009) was used to assess participants’ perceived usability of the RoboLeader system, as well their trust in the system (appendix D). The items that assess participants’ trust in the system were modified from the “Trust Between People and Automation” survey (Jian et al., 2000). The survey consists of 22 questions on a scale of 1–7. Negative questions, such as “The RoboLeader display can be deceptive,” and “The RoboLeader display was confusing,” were reverse coded (a score of 7 = 1, 6 = 2, etc.). Positive questions, such as “The RoboLeader system is dependable,” and “I can trust the RoboLeader system,” were coded regularly, with the sums of the positive and negative questions combined to create a global score. 2.4 Procedure Participants were randomly assigned to the FAP60, FAP90, MP60, or MP90 group (with 10 participants per group) before their sessions started. After being briefed on the purpose of the study and signing the informed consent form, participants completed the Demographics Questionnaire, the Attentional Control Survey, the Ishihara Color Vision Test, and the Cube
5
Comparison test. Participants then received training and practice on the tasks they were about to conduct during the experimental session. Training was self-paced and delivered by PowerPoint* slides showing the elements of the OCU, steps for completing various tasks, several miniexercises for practicing the steps, and exercises for performing the robotic control tasks. The type and reliability level of RoboLeader (i.e., FAP60, FAP90, MP60, or MP90) in the training scenarios matched each participant’s reliability assignment. The participants were told that RoboLeader was “fairly but not always reliable” (for the 90% reliability level conditions) or “not always reliable” (for the 60% reliability level conditions), and it was either FAP or MP. Before proceeding to the experimental session, participants had to demonstrate that they could recall all the steps for performing the tasks without any help. The training session lasted ~1 h. The experimental session lasted about 1 h and began immediately after the training session. Each experimental session had two scenarios (one with high visual density and one with low visual density), which both lasted ~30 min. The order of scenarios was counterbalanced across participants. During the scenarios, participants used their four robotic assets to locate 10 targets (10 insurgents carrying weapons) while rerouting their robots around events (described hereafter) in the remote environment. When each scenario started, the robots began to follow preplanned routes, and the operators began to monitor the environment to detect targets and events. The robots did not have Aided Target Recognition capability, and the participants had to detect the 10 insurgents by themselves. To identify targets, participants used a mouse to click the “Insurgent” button on the interface and then clicked directly on the insurgent to “laze” (i.e., using laser) them as soon as they were detected. The “lazed” insurgent was then displayed on the map by a white, diamond-shaped “THREAT” icon (see figure 1). Civilians were present in the simulated environment for both scenarios and friendly dismounted soldiers for one of the scenarios to increase the visual density present in the target detection tasks. In the low density scenario, there were about 600 civilians throughout the scenario; in the high density scenario, there were about 600 civilians and 600 friendly soldiers visible in the environment. During the scenarios, there were several “top-down” events (e.g., intelligence that the human operator receives from the intel network) that required revisions to the robots’ routes. RoboLeader and the participants needed to avoid rerouting robotic assets through Hostile Areas, create new routes toward High Priority Areas, and avoid areas already traversed. Once an event transpired (indicated by appearance of an icon on the map), the participants needed to notice and acknowledge that the event had occurred. RoboLeader then recommended route revisions for the events that the operator either accepted or rejected and modified as deemed necessary. In the MP scenarios, participants were required to notice and manually edit several routes without the help of RoboLeader. RoboLeader’s messages were displayed in the upper left corner (the blue area) of the OCU (see figure 1). The participants were told that their objective was to finish
*
PowerPoint is a trademark of Microsoft.
6
reconnoitering the area using their robotic assets in the least amount of time possible while keeping all route edits as close as possible to the original routes. Therefore, when re-planning a route, the participant and RoboLeader needed to consider both the effectiveness and efficiency of a new route. For example, situations where a robot completes its route fast but does not cover much ground or when the robot covers a lot of ground but is slow to finish would be suboptimal to planning a route that efficiently (less time) covers a lot of ground. In the FAP60 scenario, there were five true events that required revisions to a robot’s route and four FAs that RoboLeader attempted to edit around. Participants could verify the validity of the RoboLeader recommendations by reviewing the map. A true event was associated with an icon (a red square for a Hostile Area and a blue square for a High Priority Area; see figure 1), but FAs were not. In the FAP90 scenario, there were five true events that required revisions to a robot’s route and one FA that RoboLeader attempted to edit the robotic assets around. In the MP60 scenario, 10 true events occurred that required revisions to a robot’s route, though RoboLeader only provided solutions for two of them. In the MP90 scenario, 10 true events occurred that required revisions to a robot’s route, and RoboLeader provided solutions for eight of them. Each scenario also contained five SA queries (appendix D), which were triggered based on time progression (e.g., 3 min into the scenario). The SA queries included prompts such as “Use the provided paper to identify the name of the last route edited,” and “Use the provided paper to identify which route or routes have encountered the most Insurgents.” When an SA query was triggered, the OCU screen went blank with the simulation paused, and the SA query was displayed on the screen. Participants then wrote their response to the query on an answer sheet. After the participants responded to the SA query, they clicked a “Resume” button located beneath the query to remove it from the OCU screen and continue the simulation. In addition to the robotics tasks described previously, the participants simultaneously performed a gauge monitoring task and an auditory communications task. The gauge monitoring task displayed four gauges constantly in motion that, based upon pre-specified times, entered an upper or lower limit at various times throughout the scenarios. The gauges were displayed in the upper left corner of the OCU below the RoboLeader area (figure 1). The participants were required to monitor the gauges and press a “Reset” button when any gauge entered the upper or lower limit to put the gauges back to their normal levels. The auditory communications task presented prerecorded questions at 30-s intervals during the scenarios. The questions included simple military-related reasoning and memory tests (e.g., call-sign recognition task). For the reasoning tests, questions such as “If the enemy is to our left and our UGV (unmanned ground vehicle) is to our right, what direction is the enemy to the UGV?” were asked. For the call-sign recognition task, the participants were asked to keep track of three radio call signs (Alpha 27, Bravo 45, and Bravo 83) and to determine whether each call sign they heard was one of the three specified. Participants used a keyboard to enter their responses for the questions into the communications panel on the OCU, located underneath the RoboLeader area and adjacent to the gauges (see figure 1). 7
A 2-min break was given between the experimental scenarios. Participants assessed their perceived workload using an electronic NASA-TLX immediately after each experimental scenario. Following completion of both scenarios, participants were asked to evaluate the usability of the RoboLeader system by filling out the Usability and Trust Questionnaire. Participants were also given an opportunity to provide comments to support or clarify their numeric responses. Participants were then debriefed by the experimenter and all questions answered in depth. 2.5
Experimental Design
The study is a mixed design, with Unreliability Type (FAP vs. MP) and Reliability Level (60% [Low] vs. 90% [High]) as the between-subject factors and Visual Density of scenario (High [with dismounted friendly soldiers in the scenarios] vs. Low [without dismounted friendly soldiers in the scenarios]) as the within-subject variable. 2.6
Measures and Data Analysis
Dependent measures include the number of targets located and identified, the number of routes successfully edited, the operators’ SA of the mission environment, their concurrent task performance (gauge monitoring and auditory communications), and their perceived workload. A mixed design Analysis of Covariance (ANCOVA) with Unreliability Type (FAP vs. MP) and Reliability Level (60% [Low] vs. 90% [High]) as the between-subject factors and Visual Density (High vs. Low) as the within-subject factor is used to evaluate the operators’ performance differences among the four conditions. Participants’ spatial ability (Cube Comparison Test score) and their PAC (Attentional Control Survey score) are used as covariates.
3. Results 3.1 Target Detection Performance Table 1 lists several measures relating to operator target detection performance, route editing task performance, SA, secondary task performance (gauge monitoring and auditory communication), and subjective workload assessment. The analysis revealed that the Visual Density of the target environment significantly affected the percentage of targets detected, F(1,35) = 12.193, p < 0.001 (figure 2). Participants detected significantly fewer insurgents in the High Density environment than in the Low Density environment. There was also a main effect of Unreliability Type, F(1,35) = 45.714, p < 0.0001; participants detected significantly fewer insurgents in the MP condition than in the FAP condition (figure 2). The difference between those with a higher SpA ability and a lower SpA ability was also significant, F(1,35) = 4.055, p < 0.05 (figure 3).
8
Table 1. Operator task performance and subjective assessments (standard deviations are presented in parentheses) by unreliability type, reliability level, and visual density.
Measures Target detection (% correct) Route editing (% correct) SA (max. = 5) Gauge monitoring – RT (s) Communication (% correct) Workload (NASA TLX score)
FAP 60% 90% High Low High Low 0.80 0.96 0.72 0.86 (0.115) (0.052) (0.312) (0.143) 0.956 0.978 0.950 0.983 (0.077) (0.046) (0.112) (0.054) 0.80 0.90 1.30 1.00 (0.632) (0.994) (0.483) (1.15) 3.91 4.27 4.48 4.16 (1.49) (1.87) (2.22) (3.14) 0.877 0.807 0.820 0.867 (0.047) (0.060) (0.085) (0.083) 79.37 70.67 67.07 60.03 (10.50) (7.32) (13.63) (17.37)
Figure 2. Target detection.
9
MP 60% 90% High Low High Low 0.53 0.57 0.52 0.73 (0.142) (0.157) (0.162) (0.106) 0.650 0.670 0.760 0.760 (0.135) (0.116) (0.117) (0.097) 1.60 2.00 1.50 1.80 (0.966) (0.817) (0.972) (1.48) 3.99 4.49 3.13 2.94 (2.27) (1.91) (1.53) (1.28) 0.823 0.823 0.877 0.867 (0.065) (0.074) (0.055) (0.059) 79.83 78.47 75.10 71.03 (14.41) (14.00) (14.70) (17.77)
Figure 3. Target detection and spatial ability.
3.2 Route Editing The analysis showed that the Unreliability Type of RoboLeader significantly affected the percentage of routes successfully edited, F(1,35) = 161.706, p < 0.0001 (figure 4). Participants edited significantly more routes in the FAP condition than in the MP condition. There was also a main effect of Reliability Level, F(1,35) = 7.416, p < 0.01; participants successfully edited more routes in the High Reliability (90%) condition than in the Low Reliability (60%) condition (figure 4). There was a significant difference between those with a higher SpA ability and a lower SpA ability, F(1,35) = 7.523, p < 0.01 (figure 5).
Figure 4. Routes edited.
10
Figure 5. Routes edited and spatial ability.
3.3
Situation Awareness
The analysis showed that the Unreliability Type of RoboLeader significantly affected the participants’ SA of the mission environment (i.e., the number of SA queries answered correctly), F(1,35) = 10.295, p < 0.005 (figure 6). Participants’ SA was significantly better in the MP condition than in the FAP condition. No other factors or interactions were significant.
Figure 6. Situation awareness.
11
3.4
Communication Task Performance
The analysis showed that Visual Density of the target environment significantly affected participants’ communication task performance, F(1,35) = 5.808, p < 0.05 (figure 7). Participants’ communication task performance was slightly better in the High Visual Density condition than in the Low Density environment. There was a significant three-way interaction among Visual Density, Type of RoboLeader Unreliability, and Reliability Level, F(1,35) = 10.266, p < 0.005 (figure 7). There was also a significant interaction between Visual Density and participants’ PAC, F(1,35) = 5.421, p < 0.05.
Figure 7. Communication task performance.
3.5
Gauge Monitoring Performance
The analysis showed that there was a significant interaction between Visual Density and Reliability Level of RoboLeader, F(1,35) = 4.246, p < 0.05. Participants’ gauge monitoring task performance (response times) tended to be better (faster) in the Low Visual Density when the Reliability Level of RoboLeader was high; however, when the RoboLeader was not reliable, they tended to respond faster in the High Visual Density condition. There was a significant difference between participants with low PAC and high PAC (figure 8). High-PAC participants responded significantly faster than those with low PAC. 3.6
Perceived Workload
The analysis showed that both Visual Density of the target environment and the Reliability Level of RoboLeader contributed significantly to the participants’ perceived workload, F(1,36) = 76.52, p < 0.01 and F(1,36) = 4.76, p < 0.05, respectively (figure 9). Participants experienced higher workload in the High Density condition, as well as when the Reliability Level was lower.
12
Figure 8. Gauge monitoring task performance and PAC.
Figure 9. Perceived workload.
3.7
Operators’ Interaction With the Operator Control Unit
Participants’ interaction with the OCU (i.e., clicks on the graphical user interface) was analyzed. Participants made significantly more thumbnail clicks in the Low Visual Density condition than in the High Density condition, F(1,35) = 6.482, p < 0.05. Participants’ spatial ability (Cube Comparison Test score) was also significantly correlated with the number of thumbnail clicks, r = 0.330, p < 0.05. The participants’ self-assessed trust (aggregate scores of the Usability/Trust survey) in the RoboLeader system was also evaluated, and those with higher and lower PAC
13
were compared. There was no significant difference between these two groups in the aggregate scores of the Usability/Trust survey, p > 0.05. However, participants’ responses on some items did show differences among the groups. For the item “I can trust the RoboLeader system,” the FAP group (M = 5.25, sd = 1.25) rated it significantly higher than the MP group (M = 4.32, sd = 1.38), F(1,37) = 4.927, p < 0.05. For the item “The RoboLeader display can be deceptive,” the FAP group (M = 3.85, sd = 1.87) also rated it significantly higher than the MP group (M = 2.6, sd = 1.27), F(1,38) = 6.099, p < 0.05. Finally, for the item “I relied heavily on the RoboLeader for the task,” participants in the High Reliability (M = 5.9, sd = 1.37) group rated it significantly higher than did those in the Low Reliability (M = 4.45, sd = 2.06) group, F(1,38) = 6.843, p < 0.05.
4. Discussion Overall, there was a consistent effect of Type of Unreliability (FAP vs. MP) for tasks involving visual scanning (target detection, route editing, and SA). However, there was a distinct pattern of tradeoff among the measures. Specifically, participants performed more poorly with the MP RoboLeader for the target detection task and the route editing tasks, but they had better SA with the MP RoboLeader. This suggests that the participants scanned the map more frequently in the MP condition than in the FAP condition. This is consistent with the findings of Wickens et al. (2005a) that MP systems drew operators’ visual attention away from the concurrent tasks to focus more on the automated tasking environment. Participants in the MP group also reported that they trusted the RoboLeader significantly less than those in the FAP group. However, interestingly, the FAP participants thought the RoboLeader was more “deceptive” than the MP participants. The Reliability Level of RoboLeader was found to have an effect on route editing and operators’ perceived workload. The first finding was not surprising—participants successfully edited more routes in the Highly Reliable (90% accuracy) condition than in the Low Reliability (60% accuracy) condition. Participants also experienced higher workload and reported significantly less reliance on the RoboLeader with the Low Reliability condition, indicating that participants could discriminate between these two Reliability conditions and act accordingly. There was a consistent effect of Visual Density for the following multiple performance measures: target detection, communication, numbers of thumbnail clicks, and perceived workload. As expected, participants made more thumbnail clicks and detected more targets in the Low Density condition. More interestingly, participants performed slightly better on the Communication task in the High Density condition as well, although the effect was not straightforward, and there was a complex interaction among Visual Density, Type of RoboLeader Unreliability, and Reliability Level. Finally, participants’ perceived workload was significantly higher when the Visual Density was higher. 14
Participants with higher spatial ability performed better on the two tasks that required most visual scanning, target detection, and route editing. They also made more thumbnail clicks, consistent with what was found in the previous experiment on RoboLeader (Chen et al., 2010). These findings suggest that those with higher spatial ability were able to scan the tasking environment faster than those with lower spatial ability. Endsley and Bolstad (1994) found that pilots with higher spatial ability were significantly better able to acquire and maintain SA than their lower spatial ability counterparts. While a similar correlation was not found in the SA measure in the current study, the findings were consistent with Endsley and Bolstad’s, since target detection and route editing (i.e., change detection) can be considered as Level 1 (perception) and Level 2 (comprehension) SA of the mission environment (Endsley, 1995). The findings also support the recommendations by Lathan and Tracey (2002) and two recent U.S. Air Force studies (Chappelle et al., 2010a, 2010b) that military missions can benefit from selecting personnel with higher SpA to operate robotic devices. Additionally, training interventions that could enhance the spatial interpretations required to successfully perform a mission task might be of benefit (Rodes et al., 2005). Participants’ PAC was found to impact their secondary tasks (communication and gauge monitoring) more than their primary tasks (target detection and route editing). This finding is consistent with Chen and Joyner (2009) in that participants performed at a similar level on the primary tasks (gunnery and robotics), but those with higher PAC performed better on the secondary communication task than did those with lower PAC. These results suggest that participants with higher PAC were more able to allocate their attentional resources in the multitasking environment than did those with lower PAC. It was also found that participants with higher PAC consistently performed better in the MP condition across different tasks than those with lower PAC (figure 10). This is consistent with Chen and Terrence (2009), who found that MP automated systems tended to be more detrimental to lower-PAC individuals than to higher-PAC individuals. An interesting difference between the current results and those of Chen and Terrence (2009) was that in the current study, participants with higher PAC did not exhibit as much under-trust (i.e., disuse) of the FAP system as those high-PAC participants did in the Chen and Terrence study. In the current study, high-PAC participants performed at similar levels as low-PAC participants in the FAP conditions (but they outperformed low-PAC individuals in the MP conditions). The discrepancy between these results and those of Chen and Terrence may be due to the different “costs” of scanning in the two simulated environments. In Chen and Terrence, the gunner station and the robotics OCU were displayed on two separate monitors; however, in the current study, all the tasks were performed on one single monitor. In other words, the cost of scanning in Chen and Terrence was greater (compared to the current study), and those of higher PAC clearly demonstrated reduced compliance with the FAP automated system. In the current study, on the other hand, high-PAC participants did not show this decrement, likely due to the relative ease of verifying the RoboLeader recommendations on the map (by checking the icons).
15
Figure 10. Performance difference between low- and high-PAC individuals in the MP condition.
It is interesting to note that while it was considerably easier to verify the validity of the alerts in the current study, participants with low PAC performed more poorly in the MP conditions than those with high PAC, just as the results of Chen and Terrence (2009) showed. A likely reason for this phenomenon was that MP scenarios required continuous scanning of the map to find new icons. This task, therefore, was similar to a “change detection” task, but it had to be performed in a multitasking environment. The current results suggest that low-PAC individuals cannot detect changes as effectively as their high-PAC counterparts. In fact, the way the low-PAC participants interacted with the automated system in the current experiment was consistent with the “cognitive miser” phenomenon described in Feldman Barrett et al. (2004). In other words, low-PAC individuals, due to their limited attentional resources, tend to reduce their information processing demands by simplifying their task(s) (e.g., relying on RoboLeader to help them with their plan revision tasks). Depending on the context, this over-simplification (i.e., over-reliance on automation) may have very undesirable consequences (e.g., MP condition) when the aids fail to provide anticipated assistance.
16
5. References Barber, D.; Davis, L.; Nicholson, D.; Finkelstein, N.; Chen, J. Y. C. The Mixed Initiative Experimental (MIX) Testbed for Human Robot Interactions With Varied Levels of Automation. Proceedings of the 26th Army Science Conference, Orlando, FL, 1–4 December 2008. Chappelle, W. L.; McMillan, K. K.; Novy, P. L.; McDonald, K. Psychological Profile of USAF Unmanned Aerial Systems Predator & Reaper Pilots. Aviation, Space, and Envir. Med. 2010a, 81, 339. Chappelle, W. L.; Novy, P. L.; Randall, B.; McDonald, K. Critical Psychological Attributes of U.S. Air Force (USAF) Predator & Reaper Sensor Operators According to Subject Matter Experts. Aviation, Space, and Envir. Med. 2010b, 81, 253. Chen, J. Y. C.; Joyner, C. T. Concurrent Performance of Gunner’s and Robotic Operator’s Tasks in a Multi-Tasking Environment. Mil. Psych. 2009, 21 (1), 98–113. Chen, J. Y. C.; Terrence, P. I. Effects of Imperfect Automation and Individual Differences on Concurrent Performance of Military and Robotics Tasks in a Simulated Multitasking Environment. Ergonomics 2009, 52 (8), 907–920. Chen, J. Y. C.; Barnes, M. J.; Qu, Z. RoboLeader: A Surrogate for Enhancing the Human Control of a Team of Robots; ARL-MR-0735; U.S. Army Research Laboratory: Aberdeen Proving Ground, MD, 2010. Chen, J. Y. C.; Durlach, P. J.; Sloan, J. A.; Bowens, L. D. Human Robot Interaction in the Context of Simulated Route Reconnaissance Missions. Mil. Psych. 2008, 20 (3), 135–149. Derryberry, D.; Reed, M. A. Anxiety-Related Attentional Biases and Their Regulation by Attentional Control. J. of Abnormal Psych. 2002, 111 (2), 225–236. Dixon, S. R.; Wickens, C. D.; McCarley, J. S. On the Independence of Compliance and Reliance: Are Automation False Alarms Worse Than Misses? http://www.humanfactors .uiuc.edu/Reports&PapersPDFs/TechReport/05-16.pdf (accessed 15 May 2006), AHFD-05-16/MAAD-05-04, University of Illinois, Institute of Aviation, Aviation Human Factors Division, Urbana-Champaign, IL. Ekstrom, R. B.; French, J. W.; Harman, H. H. Kit of Factor-Referenced Cognitive Tests; Educational Testing Service: Princeton, NJ, 1976.
17
Endsley, M. R. Toward a Theory of Situation Awareness in Dynamic Systems. Human Factors 1995, 37, 32–64. Endsley, M. R.; Bolstad, C. A. Individual Differences in Pilot Situation Awareness. The Int. J. of Aviation Psych. 1994, 4 (3), 241–264. Feldman Barrett, L.; Tugade, M. M.; Engle, R. W. Individual Differences in Working Memory Capacity and Dual-Process Theories of the Mind. Psychological Bulletin 2004, 130, 553– 573. Hart, S.; Staveland, L. Development of NASA TLX (Task Load Index): Results of Empirical and Theoretical Research; In Human Mental Workload; Hancock, P., Meshkati, N., Eds.; North Holland Press: Amsterdam, Netherlands, 1988; pp 139–183. Jian, J.; Bisantz, A. M.; Drury, C. G. Foundations for an Empirically Determined Scale of Trust in Automated Systems. Int. J. of Cognitive Ergonomics 2000, 4 (1), 53–71. Lathan, C.; Tracey, M. The Effects of Operator Spatial Perception and Sensory Feedback on Human-Robot Teleoperation Performance. Presence 2002, 11, 368–377. Linegang, M.; Stoner, H. A.; Patterson, M. J.; Seppelt, B. D.; Hoffman, J. D.; Crittendon, Z. B.; Lee, J. D. Human-Automation Collaboration in Dynamic Mission Planning: A Challenge Requiring an Ecological Approach. Proceedings of the 50th Human Factors & Ergonomics Society Annual Meeting, 2006, 2482–2486. Meyer, J. Effects of Warning Validity and Proximity on Responses to Warning. Human Factors 2001, 43, 563–572. Meyer, J. Conceptual Issues in the Study of Dynamic Hazard Warnings. Human Factors 2004, 46, 196–204. Olsen, D. R.; Goodrich, M. A. Metrics for Evaluating Human-Robot Interactions. http://faculty .cs.byu.edu/~mike/mikeg/papers/OlsenGoodrichPERMIS2003.pdf (accessed 25 May 2004), in Proceedings of PERMIS 2003. Rodes, W.; Brooks, J.; Gugerty, L. Using Verbal Protocol Analysis and Cognitive Modeling to Understand Strategies Used for Cardinal Direction Judgments. Poster presented at the Human Factors of UAVs Workshop, Mesa, AZ, 2005. Rubinstein, J.; Meyer, D.; Evans, J. Executive Control of Cognitive Processes in Task Switching. J. of Exp. Psych.: Human Perception and Performance 2001, 27, 763–797. Schurr, N. Toward Human-Multiagent Teams. Unpublished doctoral dissertation, University of Southern California, Los Angeles, CA, 2007.
18
Snyder, M. G.; Qu, Z.; Chen, J. Y. C.; Barnes, M. J. RoboLeader for Reconnaissance by a Team of Robotic Vehicles. Proceedings of the 2010 International Symposium on Collaborative Technologies and Systems, Chicago, IL, 17–21 May 2010. Stubbs, K.; Wettergreen, D.; Nourbakhsh, I. Using a Robot Proxy to Create Common Ground in Exploration Tasks. Proceedings of the 3rd ACM/IEEE International Conference on HumanRobot Interaction, New York, NY, 2008, pp 375–382. Wang, J.; Wang, H.; Lewis, M. Assessing Cooperation in Human Control of Heterogeneous Robots. Proceedings of the 3rd ACM/IEEE International Conference on Human-Robot Interaction, New York, NY, 2008, pp 9–15. Wang, H.; Lewis, M.; Velagapudi, P.; Scerri, P.; Sycara, K. How Search and Its Subtasks Scale in N Robots. Proceedings of the 4th ACM/IEEE International Conference on Human-Robot Interaction, New York, NY, 2009, pp 141–147. Wickens, C. D.; Dixon, S. R. Is There a Magic Number 7 (to the minus 1)? The Benefits of Imperfect Diagnostic Automation: A Synthesis of the Literature. http://www.humanfactors .uiuc.edu/Reports&PapersPDFs/TechReport/05-01.pdf (accessed 15 May 2006), AHFD-0501/MAAD-05-01, University of Illinois, Institute of Aviation, Aviation Human Factors Division, Urbana-Champaign, IL, 2005. Wickens, C. D.; Dixon, S. R.; Johnson, N. R. UAV Automation: Influence of Task Priorities and Automation Imperfection in a Difficult Surveillance Task. http://www.humanfactors.uiuc.edu /Reports&PapersPDFs/TechReport/05-20.pdf (accessed 15 May 2006), AHFD-05-20/MAAD05-6, University of Illinois, Institute of Aviation, Aviation Human Factors Division, UrbanaChampaign, IL, 2005a. Wickens, C. D.; Dixon, S. R.; Goh, J.; Hammer, B. Pilot Dependence on Imperfect Diagnostic Automation in Simulated UAV Flights: An Attentional Visual Scanning Analysis. http:// www.humanfactors.uiuc.edu /Reports&PapersPDFs/TechReport/05-02.pdf (accessed 15 May 2006), AHFD-05-02/MAAD-05-02, University of Illinois, Institute of Aviation, UrbanaChampaign, IL, 2005b.
19
INTENTIONALLY LEFT BLANK.
20
Appendix A. Demographic Questionnaire
This appendix appears in its original form, without editorial change.
21
Participant # _______ Age ______
Major ________________ Date ___________ Gender ___
1. What is the highest level of education you have had? Less than 4 yrs of college ____ Completed 4 yrs of college ____
Other ____
2. When did you use computers in your education? (Circle all that apply) Grade School Technical School
Jr. High College
High School Did Not Use
3. Where do you currently use a computer? (Circle all that apply) Home
Work
Library
Other________
Do Not Use
4. For each of the following questions, circle the response that best describes you. How often do you: Use a mouse? Daily, Weekly, Monthly, Once every few months, Rarely, Never Use a joystick? Daily, Weekly, Monthly, Once every few months, Rarely, Never Use a touch screen? Daily, Weekly, Monthly, Once every few months, Rarely, Never Use icon-based programs/software? Daily, Weekly, Monthly, Once every few months, Rarely, Never Use programs/software with pull-down menus? Daily, Weekly, Monthly, Once every few months, Rarely, Never Use graphics/drawing features in software packages? Daily, Weekly, Monthly, Once every few months, Rarely, Never Use E-mail? Daily, Weekly, Monthly, Once every few months, Rarely, Never Operate a radio controlled vehicle (car, boat, or plane)? Daily, Weekly, Monthly, Once every few months, Rarely, Never Play computer/video games? Daily, Weekly, Monthly, Once every few months, Rarely, Never 5. Which type(s) of computer/video games do you most often play if you play at least once every few months? 6. Which of the following best describes your expertise with computer? (check √ one) _____ Novice _____ Good with one type of software package (such as word processing or slides) _____ Good with several software packages _____ Can program in one language and use several software packages _____ Can program in several languages and use several software packages 7. Are you in your usual state of health physically? YES If NO, please briefly explain:
NO
8. How many hours of sleep did you get last night? ______ hours 9. Do you have normal color vision? YES 10. Do you have prior military service? YES
NO NO
If Yes, how long __________
22
Appendix B. Attentional Control Survey
This appendix appears in its original form, without editorial change.
23
For each of the following questions, circle the response that best describes you. It is very hard for me to concentrate on a difficult task when there are noises around. Almost never, Sometimes, Often, Always When I need to concentrate and solve a problem, I have trouble focusing my attention. Almost never, Sometimes, Often, Always
When I am working hard on something, I still get distracted by events around me. Almost never, Sometimes, Often, Always My concentration is good even if there is music in the room around me. Almost never, Sometimes, Often, Always When concentrating, I can focus my attention so that I become unaware of what’s going on in the room around me. Almost never, Sometimes, Often, Always When I am reading or studying, I am easily distracted if there are people talking in the same room. Almost never, Sometimes, Often, Always When trying to focus my attention on something, I have difficulty blocking out distracting thoughts. Almost never, Sometimes, Often, Always I have a hard time concentrating when I’m excited about something. Almost never, Sometimes, Often, Always When concentrating, I ignore feelings of hunger or thirst. Almost never, Sometimes, Often, Always I can quickly switch from one task to another.
Almost never, Sometimes, Often, Always
It takes me a while to get really involved in a new task.
Almost never, Sometimes, Often, Always
It is difficult for me to coordinate my attention between the listening and writing required when taking notes during lectures. Almost never, Sometimes, Often, Always I can become interested in a new topic very quickly when I need to. Almost never, Sometimes, Often, Always It is easy for me to read or write while I’m also talking on the phone. Almost never, Sometimes, Often, Always I have trouble carrying on two conversations at once.
Almost never, Sometimes, Often, Always
I have a hard time coming up with new ideas quickly.
Almost never, Sometimes, Often, Always
After being interrupted or distracted, I can easily shift my attention back to what I was doing before. Almost never, Sometimes, Often, Always When a distracting thought comes to mind, it is easy for me to shift my attention away from it. Almost never, Sometimes, Often, Always It is easy for me to alternate between two different tasks. Almost never, Sometimes, Often, Always It is hard for me to break from one way of thinking about something and look at it from another point of view. Almost never, Sometimes, Often, Always
24
Appendix C. National Aeronautics and Space Administration – Task Load Index Questionnaire
This appendix appears in its original form, without editorial change.
25
Please rate your overall impression of demands imposed on you during the exercise. 1. Mental Demand: How much mental and perceptual activity was required (e.g., thinking, looking, searching, etc.)? Was the task easy or demanding, simple or complex, exacting or forgiving? LOW |---|---|---|---|---|---|---|---|---| HIGH 1 2 3 4 5 6 7 8 9 10 2. Physical Demand: How much physical activity was required (e.g., pushing, pulling, turning, controlling, activating, etc.)? Was the task easy or demanding, slow or brisk, slack or strenuous, restful or laborious? LOW |---|---|---|---|---|---|---|---|---| HIGH 1 2 3 4 5 6 7 8 9 10 3. Temporal Demand: How much time pressure did you feel due to the rate or pace at which the task or task elements occurred? Was the pace slow and leisurely or rapid and frantic? LOW |---|---|---|---|---|---|---|---|---| HIGH 1 2 3 4 5 6 7 8 9 10 4. Level of Effort: How hard did you have to work (mentally and physically) to accomplish your level of performance? LOW |---|---|---|---|---|---|---|---|---| HIGH 1 2 3 4 5 6 7 8 9 10 5. Level of Frustration: How insecure, discouraged, irritated, stressed and annoyed versus secure, gratified, content, relaxed and complacent did you feel during the task? LOW |---|---|---|---|---|---|---|---|---| HIGH 1 2 3 4 5 6 7 8 9 10 6. Performance: How successful do you think you were in accomplishing the goals of the task set by the experimenter (or yourself)? How satisfied were you with your performance in accomplishing these goals? LOW |---|---|---|---|---|---|---|---|---| HIGH 1 2 3 4 5 6 7 8 9 10
26
Appendix D. Usability/Trust Survey
This appendix appears in its original form, without editorial change.
27
1. The Operator Control Unit should have the RoboLeader display. Strongly DISAGREE |----|----|----|----|----|----| Strongly AGREE N/A 1 2 3 4 5 6 7 2. I made use of the RoboLeader’s recommendations. Strongly DISAGREE |----|----|----|----|----|----| Strongly AGREE 1 2 3 4 5 6 7
N/A
3. I sometimes felt ‘lost’ using the RoboLeader display. Strongly DISAGREE |----|----|----|----|----|----| Strongly AGREE 1 2 3 4 5 6 7
N/A
Comments
4. The RoboLeader display was intuitive and made it easy to determine how to edit routes. Strongly DISAGREE |----|----|----|----|----|----| Strongly AGREE N/A 1 2 3 4 5 6 7 5. I do not feel the RoboLeader display was helpful in the task. Strongly DISAGREE |----|----|----|----|----|----| Strongly AGREE 1 2 3 4 5 6 7
N/A
6. I relied heavily on the RoboLeader for the task. Strongly DISAGREE |----|----|----|----|----|----| Strongly AGREE 1 2 3 4 5 6 7
N/A
7. The Operator Control Unit should not have a RoboLeader display. Strongly DISAGREE |----|----|----|----|----|----| Strongly AGREE N/A 1 2 3 4 5 6 7 8. The RoboLeader display was confusing. Strongly DISAGREE |----|----|----|----|----|----| Strongly AGREE 1 2 3 4 5 6 7
N/A
9. The RoboLeader display was annoying. Strongly DISAGREE |----|----|----|----|----|----| Strongly AGREE 1 2 3 4 5 6 7
N/A
10. The RoboLeader display improved my performance on the task. Strongly DISAGREE |----|----|----|----|----|----| Strongly AGREE N/A 1 2 3 4 5 6 7 11. The RoboLeader display can be deceptive. Strongly DISAGREE |----|----|----|----|----|----| Strongly AGREE 1 2 3 4 5 6 7
N/A
12. The RoboLeader display sometimes behaves in an unpredictable manner. Strongly DISAGREE |----|----|----|----|----|----| Strongly AGREE N/A 1 2 3 4 5 6 7
28
13. I am often suspicious of the RoboLeader system’s intent, action
or outputs. Strongly DISAGREE |----|----|----|----|----|----| Strongly AGREE 1 2 3 4 5 6 7 14. I am sometimes unsure of the RoboLeader system. Strongly DISAGREE |----|----|----|----|----|----| Strongly AGREE 1 2 3 4 5 6 7
N/A
N/A
15. The RoboLeader system may have harmful effects on the task. Strongly DISAGREE |----|----|----|----|----|----| Strongly AGREE N/A 1 2 3 4 5 6 7 16. I am confident in the RoboLeader system. Strongly DISAGREE |----|----|----|----|----|----| Strongly AGREE 1 2 3 4 5 6 7
N/A
17. The RoboLeader system can provide security. Strongly DISAGREE |----|----|----|----|----|----| Strongly AGREE 1 2 3 4 5 6 7
N/A
18. The RoboLeader system has integrity. Strongly DISAGREE |----|----|----|----|----|----| Strongly AGREE 1 2 3 4 5 6 7
N/A
19. The RoboLeader system is dependable. Strongly DISAGREE |----|----|----|----|----|----| Strongly AGREE 1 2 3 4 5 6 7
N/A
20. The RoboLeader system is consistent. Strongly DISAGREE |----|----|----|----|----|----| Strongly AGREE 1 2 3 4 5 6 7
N/A
21. I can trust the RoboLeader system. Strongly DISAGREE |----|----|----|----|----|----| Strongly AGREE 1 2 3 4 5 6 7
N/A
22. I am familiar with the RoboLeader display. Strongly DISAGREE |----|----|----|----|----|----| Strongly AGREE 1 2 3 4 5 6 7
N/A
29
INTENTIONALLY LEFT BLANK.
30
Appendix E. Situation Awareness Queries •
Use the provided map to identify where your robots are currently located.
•
Use the provided map to identify which robot has searched the highlighted area.
•
Which robot has encountered the most improvised explosive devices (IEDs)?
•
Which robot has encountered the most insurgents?
•
What was the name of the last route you edited?
•
Which route was edited to perform reconnaissance in a High Priority Area?
•
Which route has been edited to avoid a Hostile Area?
•
Which robot is closest to finishing their route?
•
Which route has encountered an IED explosion?
31
INTENTIONALLY LEFT BLANK.
32
List of Symbols, Abbreviations, and Acronyms ANCOVA
Analysis of Covariance
FAP
false-alarm prone
IED
improvised explosive device
MIX
Mixed Initiative Experimental
MP
miss prone
NASA-TLX
National Aeronautics and Space Administration – Task Load Index
OCU
operator control unit
PAC
perceived attentional control
SA
situation awareness
SpA
spatial ability
TLX
Task Load Index
UV
unmanned vehicle
UGV
unmanned ground vehicle
33
NO. OF COPIES ORGANIZATION 1 (PDF only)
DEFENSE TECHNICAL INFORMATION CTR DTIC OCA 8725 JOHN J KINGMAN RD STE 0944 FORT BELVOIR VA 22060-6218
1
DIRECTOR US ARMY RESEARCH LAB IMNE ALC HRR 2800 POWDER MILL RD ADELPHI MD 20783-1197
1
DIRECTOR US ARMY RESEARCH LAB RDRL CIO LL 2800 POWDER MILL RD ADELPHI MD 20783-1197
1
DIRECTOR US ARMY RESEARCH LAB RDRL CIO MT 2800 POWDER MILL RD ADELPHI MD 20783-1197
1
DIRECTOR US ARMY RESEARCH LAB RDRL D 2800 POWDER MILL RD ADELPHI MD 20783-1197
34
NO. OF COPIES ORGANIZATION 1
ARMY RSCH LABORATORY – HRED RDRL HRM A J MARTIN MYER CENTER BLDG 2700 RM 2D311 FORT MONMOUTH NJ 07703-5601
1
ARMY RSCH LABORATORY – HRED RDRL HRM C A DAVISON 320 MANSCEN LOOP STE 115 FORT LEONARD WOOD MO 65473
2
NO. OF COPIES ORGANIZATION
ARMY RSCH LABORATORY – HRED RDRL HRM DI T DAVIS J HANSBERGER BLDG 5400 RM C242 REDSTONE ARSENAL AL 35898-7290
1
ARMY RSCH LABORATORY – HRED RDRL HR MP D UNGVARSKY POPE HALL BLDG 470 BCBL 806 HARRISON DR FORT LEAVENWORTH KS 66027-2302
1
ARMY RSCH LABORATORY – HRED RDRL HRM DQ M R FLETCHER NATICK SOLDIER CTR AMSRD NSC WS E BLDG 3 RM 343 NATICK MA 01760-5020
1
ARMY RSCH LABORATORY – HRED RDRL HRM AT J CHEN 12350 RESEARCH PKWY ORLANDO FL 32826-3276
1
ARMY RSCH LABORATORY – HRED RDRL HRM AT C KORTENHAUS 12350 RESEARCH PKWY ORLANDO FL 32826
1
ARMY RSCH LABORATORY – HRED RDRL HRM AS C MANASCO SIGNAL TOWERS BLDG 29808A RM 303A FORT GORDON GA 30905-5233
1
ARMY RSCH LABORATORY – HRED RDRL HRS EA DR V J RICE BLDG 4011 RM 217 1750 GREELEY RD FORT SAM HOUSTON TX 78234-5002
1
ARMY RSCH LABORATORY – HRED RDRL HRM DG K GUNN BLDG 333 PICATINNY ARSENAL NJ 07806-5000
1
ARMY RSCH LABORATORY – HRED ARMC FIELD ELEMENT RDRL HRM CH C BURNS THIRD AVE BLDG 1467B RM 336 FORT KNOX KY 40121
1
ARMY RSCH LABORATORY – HRED RDRL HRM CU 6501 E 11 MILE RD MS 284 BLDG 200A 2ND FL RM 2104 WARREN MI 48397-5000
1
ARMY RSCH LABORATORY – HRED AWC FIELD ELEMENT RDRL HRM DJ D DURBIN BLDG 4506 (DCD) RM 107 FORT RUCKER AL 36362-5000
1
ARMY RSCH LABORATORY – HRED FIRES CTR OF EXCELLENCE FIELD ELEMENT RDRL HRM AF C HERNANDEZ 3040 NW AUSTIN RD RM 221 FORT SILL OK 73503-9043
1
ARMY RSCH LABORATORY – HRED RDRL HRM CK J REINHART 10125 KINGMAN RD BLDG 317 FORT BELVOIR VA 22060-5828
1
ARMY RSCH LABORATORY – HRED RDRL HRM AV S MIDDLEBROOKS 91012 STATION AVE RM 348 FORT HOOD TX 76544-5073
1
ARMY RSCH LABORATORY – HRED RDRL HRM CN R SPENCER DCSFDI HF HQ USASOC BLDG E2929 FORT BRAGG NC 28310-5000
1
ARMY RSCH LABORATORY – HRED RDRL HRM AY M BARNES 2520 HEALY AVE STE 1172 BLDG 51005 FORT HUACHUCA AZ 85613-7069
35
NO. OF COPIES ORGANIZATION 1
1 (CD only)
ARMY RSCH LABORATORY – HRED RDRL HRM DW E REDDEN BLDG 4 CL 60 FORT BENNING GA 31905-5400 ARMY G1 DAPE MR B KNAPP 300 ARMY PENTAGON RM 2C489 WASHINGTON DC 20310-0300
ABERDEEN PROVING GROUND 4
DIR USARL RDRL HR L ALLENDER T LETOWSKI RDRL HRM P SAVAGE-KNEPSHIELD RDRL HRS D B AMREIN
36