Solid SolidFreeform FreeformFabrication Fabrication2016: 2016:Proceedings Proceedingsof ofthe the27th 27thAnnual AnnualInternational International Solid Freeform Fabrication Symposium – An Additive Manufacturing Conference Reviewed Paper
Effects of Inter-Layer Time Interval on Temperature Gradients in Direct Laser Deposited Ti-6Al-4V Mohammad Masoomi1, Scott M. Thompson2,†, Nima Shamsaei2, Linkan Bian3 1
Center for Advanced Vehicular Systems (CAVS), Mississippi State University, MS 39762 2
2
Department of Mechanical Engineering, Auburn University, AL 36849
Department of Industrial and Systems Engineering, Mississippi State University, Mississippi State, MS 39762
†
Corresponding author: Email:
[email protected] Phone: (334) 844 4820 Abstract Parts fabricated via additive manufacturing (AM) methods are prone to experiencing high temperature gradients during manufacture resulting in internal residual stress formation. In the current study, a numerical model for predicting the temperature distribution and residual stress in Directed Energy Deposited (DED) Ti–6Al–4V parts is utilized for determining a relationship between local part temperature gradients with generated residual stress. Effects of time-interval between successive layer deposits, as well as layer deposition itself, on the temperature gradient vector for the first and each layer is investigated. The numerical model is validated using thermographic measurements of Ti-6Al-4V specimens fabricated via Laser Engineered Net Shaping® (LENS), a blown-powder/laser-based DED method. Results demonstrate the heterogeneity in the part’s spatiotemporal temperature field, and support the fact that as the part number, or single part size or geometry, vary, the resultant residual stress due to temperature gradients will be impacted. As the time inter-layer time interval increases from 0 to 10 second, the temperature gradient magnitude in vicinity of the melt pool will increase slightly. Introduction Directed energy deposition (DED) is an additive manufacturing (AM) technique for building parts via the layer-wise addition of material [1]. Material, in the form of wire or powder, is fed into the directed energy source, which may be either an electron beam or laser. For laserbased DED, or direct laser deposition (DLD), a common system for use is Laser Engineered Net ShapingTM (LENS). During a typical LENS process, metallic powder is injected into a relatively high power laser (typically Nd:YAG) via multiple nozzles (typically four); all occurring in an inert, argon atmosphere. Due to the small laser spot size and high laser power, injected metallic powder melts forming a molten pool, or melt pool. The melt pool solidifies near-instantaneously upon removal of laser irradiation, and extremely high initial cooling rates then occur. A CNC stage below the laser, which is mounted with a substrate, moves in a pre-defined path along one plane, allowing for the creation of a single layer. The stage is then incrementally dropped until a final part is generated. The localized heating and extreme cooling rates experienced during LENS will
175
influence the microstructure, mechanical properties and residual stress of final metallic parts [2]– [5]. To investigate the influence of DED process parameters on the properties of metallic parts, many have resorted to experimental or numerical means. Since the heat transfer and temperature fields are relatable to observed microstructures and residual stresses in as-built LENS parts, thermal characterization of the process is highly pertinent. For experimental characterization, some have employed substrate-embedded thermocouples [6], [7] or infrared thermography [8], [9]. Numerical characterization of the LENS process has been performed using finite element analysis (FEA) [10], [11]. Griffith et al. [6] experimentally demonstrated that dimensional accuracy in the horizontal build plane is better compared to accuracy in the vertical fabrication direction for LENS. Hofmeister et al. [8] used thermography and FEA to measure and calculate the temperature gradient in the part. Costa et al. [10] studied the effects of idle time and substrate size on properties of deposited material. If the idle were eliminated or the substrate size was chosen to be very small, the chance of remelting previous layers was found to increase, thus causing process instability and dimension inaccuracy. Residual stress in DED parts can be detrimental to their mechanical performance during application and manufacture (e.g. part breaks during fabrication) [12], [13]. In addition, it can impact the net shape of DED parts via bowing and bending [14]. Residual stress, although important for mechanical integrity of DED parts, is difficult to measure. However, one can predict residual stress formation in DED parts through thermo-mechanical FEA; by coupling the part temperature field (and heat transfer) with its mechanical strain [14]–[16]. Heigel et al [14] has shown that to predict the residual stress accurately, modeling forced convection is necessary. One can make inferences on residual stress locations/magnitude within the part by quantifying the temperature gradient [15], [17]. The temperature gradient is important as it indicates (1) magnitude/direction of local conduction heat transfer (i.e. Fourier’s law) and (2) possible regions of solid expansion/contraction in vicinity of melt pool. Thermal cycling of a particular solid region occurs while new, neighboring layers are deposited and/or thermally agitated, and such cycling can cause repetitious expansion/contraction of the material. Temperature gradients are dependent on the employed laser scan strategy during DED, as the relative laser scan direction will influence heat flux directionality. Therefore, one can strategically select DED process parameters to better minimize residual stress formation in produced parts. The study herein provides insights into the relationship between the user-defined laser scan strategy and resultant temperature field/gradients in rectangular parts fabricated via DED. Additionally, effects of deposition of multiple layers on thermal response on the first layer has been studied. Finally, effects of adding time interval after the fabrication of each layer on thermal response in each layer has been investigated. Physical Model The laser-based/blown-powder DED, e.g. LENS, process is physically modeled herein. For numerical modeling, material deposition has been modeled using either the quiet or inactive methods [18].In quiet methods, elements are present. The thermal conductivity and heat
176
capacitance assigned to such elements are chosen to be near zero. In this case, conduction in these regions is very limited. The advantage of this method is that it is very easy to implement. On the other hand, for the inactive method, elements are included as they are added to the part. This method increases the accuracy of the model, although it is harder to implement. In this study the inactive method is chosen in order to increase the accuracy of the model. In order to simulate the LENS process and subsequent temperature, Ti, of the as-processed part, the three-dimensional transient heat equation shown in Eq. (1) was solved numerically for each ith continua (melt pool, solid part, substrate, deposited powder) comprising the part during manufacture over the time window t0 - 1, i.e.: 𝐶i (Ti )|𝑡o−1
𝜕Ti (𝑥, 𝑦, 𝑧, 𝑡) | = ∇𝑘i (Ti )|𝑡o−1 ∇Ti (𝑥, 𝑦, 𝑧, 𝑡)| 𝑡o ∂𝑡 𝑡
(1)
o
where Ci is the heat capacity (J/kg∙°C) and ki is the thermal conductivity (W/m∙°C). The continua distribution/phase is coupled with the unknown temperature field; therefore, it is evaluated at previous time and updated based on local temperature. In this study, laser power is assumed to be Gaussian. The Gaussian distribution is formulated as [19]: 𝑄𝑟 =
(2)
2𝑃𝛼λ 𝑧 𝑟 2 (1 − ) exp (1 − ( ) ) 𝜋𝑟0 2 𝐻 𝐻 𝑟0
where Qr is the input energy density (W/mm3), P the laser beam power (W), αλ is the the hemispherical, spectral absorptance of the powder and melt pool, r0 is the radius of the laser beam, H is the maximum depth, r is the current radius and z is the current depth. The incident laser power is compensated by absorption coefficient of the powder, heat loss due to convection and radiation, as well as any loses due to scattering in the powder cloud [20]. The remainder of energy is absorbed by the powder for melting, and is also utilized for sensibly heating the melt pool and previously deposited layers. During LENS, powder is injected into a region within and preceding the melt pool for subsequent melting. During this relatively fast heat transfer process, the powder is assumed to be packed flush with the deposited layer thickness. The effective thermal conductivity of the powder, kpb, was then calculated for a given temperature using [21]: 𝑘pb 𝜙𝑘r 2 1 𝑘s 𝑘r = (1 − √1 − 𝜙) (1 + ) + √1 − 𝜙 { ln ( ) − 1] + } [ 𝑘g 𝑘g 𝑘g 𝑘g 𝑘g 𝑘g 1− 1− 𝑘s 𝑘s
(3)
where kg is the thermal conductivity of the entrapped gas, which is only argon in most cases, and ϕ is the porosity of the powder, i.e.: 𝜌s − 𝜌p (4) 𝜙= 𝜌s
177
where ρs and ρp are the density of parts and powder (kg/m3). The effective thermal conductivity of the irradiated powder, kr, which depends on thermal radiation exchange between neighboring particles and the particle-to-particle distribution/size [21], was found using: 3 (5) 4𝜀𝜎T𝑖,𝑜 𝑑p 𝑘r |T𝑖,𝑜 = = 1 − 0.132𝜀 where Fo is the radiation view factor, σ is the Stefan-Boltzmann constant, dp is the mean powder diameter and ε is the constant emissivity for a typical, spherical powder arrangement [21]. The effective thermal conductivity of the melt pool, kmp, was estimated using: 3 4𝐹0 𝜎T𝑖,𝑜 𝑑p
𝑘mp |
T𝑖,𝑜
(6)
= (1 − 𝜃)𝑘l,eff + 𝜃𝑘s |T𝑖,𝑜
where θ is the solid-phase volume fraction during melt pool formation; varying between 0 and 1, i.e.: Vs Vs (7) θ= = Vs + Vl Vmp Heat transfer due to Marangoni and natural convection within the superheated melt pool [22], [23] was accounted for by using an effective, temperature-independent liquid thermal conductivity, kl,eff [24]. Effective thermal conductivity used for melt pool in this is 20 W/m∙°C [25]. Evaporation heat transfer within the melt pool was neglected. Heat transfer via convection and thermal radiation, between continua and surroundings, was estimated by assuming the shielding gas and chamber walls were at a uniform, constant temperature, T∞, i.e.: 𝑞𝑐𝑜𝑛𝑣,𝑛𝑒𝑡 = ∬ ℎ̅(Ti − 𝑇∞ )𝑑𝐴
(8)
𝑞rad,net = 𝜎𝜀(Ti4 (𝑥, 𝑦, −𝑚∆𝑙, 𝑡) − 𝑇∞4 )
(9)
where ℎ̅ is the heat transfer coefficient (W/m2∙°C), σ the Stefan-Boltzmann constant (W/m2∙°C4) and ε, the emissivity of the part. Heat transfer between the parts and chamber gas was idealized as forced convection describable via an average heat transfer coefficient, ℎ̅. Based on Heigel et al., the heat transfer coefficient was selected as 10 W/m2∙°C [14]. Table 1. Temperature dependent thermal properties of solid Ti–6Al–4V [14] T (°C)
20
93
205
250
315
425
500
540
650
760
800
870
k (W/m∙°C)
6.6
7.3
9.1
9.7
10.6
12.6
13.9
14.6
17.5
17.5
17.5
17.5
Cp (J/kg∙°C)
565
565
574
586
603
649
682
699
770
858
895
959
Since the LENS process consists of mass and energy transport occurring at relatively fine spatial and temporal scales, e.g. micrometers and microseconds, respectively, highly resolved
178
discretization of governing energy equations is required. This can be a challenge due to computational resource availability and time restrictions. A 3072 core cluster setup was utilized to expedite the simulation process while maintaining a fair level of accuracy. Simulations were performed using the commercially available software, COMSOL Multiphysics® 5.1 in conjunction with custom coding scripts. A tetrahedral meshing scheme was employed for spatial discretization of the part. Meshes consisted of cells with length approximately ~33% that of the laser diameter and a volume of approximately 1,000,000 μm3. Time was discretized into equal time steps of Δt = 1 ms. The solution was verified as mesh independent and independent of time by doing a sensitivity study. The magnitude of the temperature gradient between neighboring nodes separated by x, y, z was estimated using a second-order central difference. Verification The accuracy of the developed numerical model was assessed by simulating the LENS processing of Ti-6Al-4V performed by Marshall et al. [26]; parameters are summarized in Table 2. In this experiment, temperature measurements of the melt pool were conducted using a dual wavelength (DW) pyrometer. The DW pyrometer possessed a 6.45-micron/pixel resolution and a 4-mm field of view and was set to capture images with an acquisition frequency of 6.4 Hz. The asreceived DW pyrometer was calibrated using a high-temperature tungsten filament at known temperature [26]. An OPTOMEC LENSTM 750 machine with 1 kW Nd:YAG laser was utilized. The substrate was made from Ti–6Al–4V and its size was 153 × 153 × 3.3 mm3. During the experiment, a multi-layer, single track wall was fabricated. The length, height and thickness of the wall is provided as 47.81 mm, 27.56 mm and 1.78 mm, respectively. The temperature was measured at multiple locations along the wall at each layer. Note that the numerical model employed herein uses temperature dependent material parameters and accounts for phase change. Table 2. LENS process parameters [26] used to validate current numerical model Material Ti–6Al–4V
Laser power 290 W
Scan speed 12.7 mm/s
Laser spot size 2 mm
Powder feed rate 0.32 g/s
The predicted and experimentally-measured temperature at the middle of a layer, for the first five layers, is presented in Table 3. It is observed that the temperature prediction from the employed simulation is ≈ 50 °C higher relative to results from experiments. Several reasons could explain these differences. In the model, effects of heat transfer inside the melt pool, such as Marangoni effects, were neglected. In addition, local convection heat transfer effects were neglected. Table 3. Peak temperature of middle point on the thin wall from simulation and experiment conducted by Marshall et al. [26] Layer Simulation Experimental
1 1730 °C 1707 °C
2 1745 °C 1708 °C
179
3 1740 °C 1748 °C
4 1760 °C 1705 °C
5 1770 °C 1717 °C
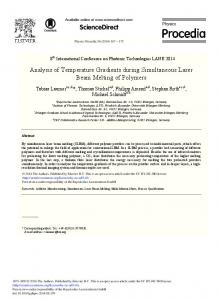
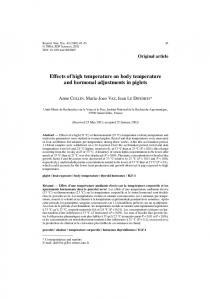
Numerical results and discussion Rectangular parts with 6 × 6 mm2 cross-sectional dimensions were simulated while employing a ‘unidirectional’ scan strategy is shown in Fig. 1. As shown, the scan direction rotates 90° clockwise for each new layer compared to previous layer. After extensive experiments, the set of process parameters chosen that shown to produce dense parts. The laser power is set to 350 W and travel speed is set at 16.9 mm/s. The feed rate is 133 mg/s. The hatching space and thickness of each layer are 0.508 mm. The measurement location is chosen to be at the middle of the part’s first layer. In Fig. 2, the temperature response during the fabrication of the second and third layer is shown. It can be seen that peak temperature is located at deposition point.
Figure 1. Scan strategy for (a) first layer, (b) second layer, (c) third layer, (d) fourth layer.
Figure 2. Temperature response during deposition of (a) second layer and (b) third layer. In Fig. 3, temperature response and temperature gradient of measurement location (middle of first layer) is shown. It is observed that temperature oscillation will decrease at measurement
180
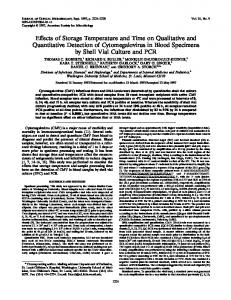
location during deposition of top layers. The reason is that distance between heat source and measurement location increases. In addition, due to heat accumulation, at the beginning of deposition of each new layer, temperature of the measurement location is higher compared to beginning of deposition of previous layer. Finally, temperature gradient during deposition of first layer is highest.
Figure 3. (a) Temperature response and (b) temperature gradient magnitude of measurement location during fabrication of first five layers while employing a time interval of ~ 0 s. In Fig. 4, the temperature response and temperature gradient during deposition of first three layer is shown. Measurement location is located at the center of each layer during the deposition. It can be seen that peak temperature is nearly the same in all three layers, despite the fact that the temperature of the part is rising. However, temperature gradient magnitude of Layer 3 is lower than Layer 1.
Figure 4. (a) Temperature response and (b) temperature gradient of measurement locations during fabrication of first three layers while employing a time interval of ~ 0 s.
181
In Fig. 5, temperature gradient during the deposition of first layer along x, y and z direction at measurement location is shown. It concluded that peak temperature gradient is highest along z direction. In addition, temperature gradient along the laser direction is higher compared to temperature gradient along the direction perpendicular to the laser direction.
Figure 5. Temperature gradient along (a) x direction, (b) y direction, and (c) z direction. during deposition of first layer at measurement location. Finally, in Fig. 6, temperature response and temperature gradient during deposition of the first five layers of measurement location is shown. In this simulation between deposition of each layer, the laser was idle for 10 s. It could be seen that although the initial temperature at the beginning of deposition of each layer decreased, peak temperature has not changed. On the other hand, the temperature gradient has decreased.
Figure 6. Temperature response and temperature gradient of measurement location during fabrication of first five layers while employing a time interval of 10 s. Conclusions The temperature response during fabrication of parts produced by the DED, and specifically the Laser Engineered Net Shaping (LENS), method has been investigated. The proposed
182
continuum model for DED heat transfer assumes that the powder possesses an effective thermal conductivity that accounts for convection and radiation effects between particles and entrapped gas. The model is essentially conduction-based. Effects of fluid motion inside the melt pool have not been considered, and pore formation was neglected. The absolute temperature field has been used to allow inference on residual stress formation in DED parts. Based on the numerical simulation, the below conclusions can be made: 1) Temperature of the part will rise during the deposition of each layer. 2) The magnitude of the temperature gradient at the center of each layer decreases as the layer number increases; away from the substrate. 3) As the inter-layer time interval increases, the temperature gradient in vicinity of the melt pool will increase. These findings further show that the geometry/size/number of parts can impact their temperature response, i.e. thermal history, as well as their temperature gradients, during DED. Acknowledgements This material is based upon work supported by the National Science Foundation under Grant No. 1563423. Authors acknowledge the support of Mississippi State University’s Center for Advanced Vehicular Systems (CAVS) and High Performance Computing Collaboratory (HPC²). This manuscript was prepared while Scott Thompson and Nima Shamsaei were Assistant Professors at Mississippi State University. References [1] [2] [3] [4] [5] [6] [7] [8] [9] [10]
J. Mazumder and H. Qi, “Fabrication of 3D components by laser-aided direct metal deposition,” in Proceedings of the SPIE., 2005, vol. 5706, pp. 38–59. M. . Griffith, M. . Schlienger, L. . Harwell, M. . Oliver, M. . Baldwin, M. . Ensz, M. Essien, J. Brooks, C. . Robino, J. . Smugeresky, W. . Hofmeister, M. . Wert, and D. . Nelson, “Understanding thermal behavior in the LENS process,” Mater. Des., vol. 20, no. 2–3, pp. 107–113, 1999. F.-J. Kahlen and A. Kar, “Residual stresses in laser-deposited metal parts,” J. Laser Appl., vol. 13, no. 2, p. 60, 2001. M. Labudovic, D. Hu, and R. Kovacevic, “A three dimensional model for direct laser metal powder deposition and rapid prototyping,” J. Mater. Sci., vol. 38, no. 1, pp. 35–49, 2003. S. Zekovic, R. Dwivedi, and R. Kovacevic, “Thermo-structural finite element analysis of direct laser metal deposited thin-walled structures,” in Proceedings of the Solid Freeform Fabrication Symposium, 2005, pp. 338–355. M. L. Griffith, D. M. Keicher, C. L. Atwood, J. A. Romero, J. E. Smugeresky, L. D. Harwell, and D. L. Greene, “Free form fabrication of metallic components using laser engineered net shaping (LENS),” in Proceedings of the Solid Freeform Fabrication Symposium, 1996, pp. 125–131. P. Peyre, P. Aubry, R. Fabbro, R. Neveu, and A. Longuet, “Analytical and numerical modelling of the direct metal deposition laser process,” J. Phys. D Appl. Phys, vol. 41, no. 2, p. 25403, 2008. W. Hofmeister, M. Wert, J. Smugeresky, J. A. Philliber, M. Griffith, and M. Ensz, “Investigating solidification with the laser-engineered net shaping (LENSTM) process,” JOM, vol. 51, no. 7, pp. 1–6, 1999. L. Wang, S. D. Felicelli, and J. E. Craig, “Experimental and Numerical Study of the LENS Rapid Fabrication Process,” J. Manuf. Sci. Eng., vol. 131, no. 4, p. 041019, 2009. L. Costa, R. Vilar, T. Reti, and A. M. Deus, “Rapid tooling by laser powder deposition: Process
183
[11] [12] [13] [14] [15] [16] [17] [18] [19] [20] [21] [22] [23] [24] [25] [26]
simulation using finite element analysis,” Acta Mater., vol. 53, no. 14, pp. 3987–3999, 2005. R. Ye, J. E. Smugeresky, B. Zheng, Y. Zhou, and E. J. Lavernia, “Numerical modeling of the thermal behavior during the LENS process,” Mater. Sci. Eng. A, vol. 428, pp. 47–53, 2006. K. Dai and L. Shaw, “Distortion minimization of laser-processed components through control of laser scanning patterns,” Rapid Prototyp. J., vol. 8, no. 5, pp. 270–276, 2002. P. Rangaswamy, M. L. Griffith, M. B. Prime, T. M. Holden, R. B. Rogge, J. M. Edwards, and R. J. Sebring, “Residual stresses in LENS ® components using neutron diffraction and contour method,” Mater. Sci. Eng. A, vol. 399, pp. 72–83, 2005. J. C. Heigel, P. Michaleris, and E. W. Reutzel, “Thermo-mechanical model development and validation of directed energy deposition additive manufacturing of Ti–6Al–4V,” Addit. Manuf., vol. 5, pp. 9–19, 2015. A. H. Nickel, D. M. Barnett, and F. B. Prinz, “Thermal stresses and deposition patterns in layered manufacturing,” Mater. Sci. Eng. A, vol. 317, no. 1, pp. 59–64, 2001. B. Cheng, S. Shrestha, and K. Chou, “Stress and deformation evaluations of scanning strategy effect in selective laser melting,” Addit. Manuf., 2016. M. F. Zaeh and G. Branner, “Investigations on residual stresses and deformations in selective laser melting,” Prod. Eng., vol. 4, no. 1, pp. 35–45, 2010. A. Uriondo, M. Esperon-Miguez, and S. Perinpanayagam, “The present and future of additive manufacturing in the aerospace sector: A review of important aspects,” Proc. Inst. Mech. Eng. Part G J. Aerosp. Eng., vol. 229, no. 11, pp. 2132–2147, Sep. 2015. S. . Tsirkas, P. Papanikos, and T. Kermanidis, “Numerical simulation of the laser welding process in butt-joint specimens,” J. Mater. Process. Technol., vol. 134, no. 1, pp. 59–69, 2003. A. J. Pinkerton and L. Li, “An analytical model of energy distribution in laser direct metal deposition,” Proc. Inst. Mech. Eng. Part B J. Eng. Manuf., vol. 218, no. 4, pp. 363–374, 2004. S. S. Sih and J. W. Barlow, “The Prediction of the Emissivity and Thermal Conductivity of Powder Beds,” Part. Sci. Technol., vol. 22, no. 3, pp. 291–304, 2004. Y. P. Lei, H. Murakawa, Y. W. Shi, and X. Y. Li, “Numerical analysis of the competitive influence of Marangoni flow and evaporation on heat surface temperature and molten pool shape in laser surface remelting,” Comput. Mater. Sci., vol. 21, no. 3, pp. 276–290, 2001. H. Yin, S. D. Felicelli, and L. Wang, “Fluid flow, heat and mass transfer in the molten pool of the LENS process,” in TMS Annual Meeting, 2008, pp. 261–270. W. Zhang, “Heat and fluid flow in complex joints during gas metal arc welding—Part II: Application to fillet welding of mild steel,” J. Appl. Phys., vol. 95, no. 9, p. 5220, 2004. K. Zeng, D. Pal, and B. Stucker, “A review of thermal analysis methods in laser sintering and selective laser melting,” in Proceedings of Solid Freeform Fabrication Symposium Austin, TX, 2012. G. J. Marshall, S. M. Thompson, and N. Shamsaei, “Data indicating temperature response of Ti– 6Al–4V thin-walled structure during its additive manufacture via Laser Engineered Net Shaping,” Data in Brief, vol. 7. pp. 697–703, 2016.
184