Proceedings of the 6th JFPS International Symposium on Fluid Power, TSUKUBA 2005 November 7-10, 2005
2C3-5
EFFECT OF TANK DESIGN AND TWO-PHASED FILTRATION ON CLEANLINESS LEVEL OF WATER HYDRAULIC SYSTEM Hannu RIIPINEN*, Sari SOINI**, Jaakko A. PUHAKKA**, Kari T. KOSKINEN* and Matti VILENIUS* *Department of Mechanical Engineering, Institute of Hydraulics and Automation Tampere University of Technology P.O. Box 589, FIN-33101, Tampere, Finland (E-mail:
[email protected]) **Department of Environmental Engineering, Environmental Engineering and Biotechnology Tampere University of Technology P.O. Box 541, FIN – 33101, Tampere, Finland
ABSTRACT Filtration in water hydraulic system may be problematic, due to chemical, physical and biological contamination. This contamination may cause quick increase in the pressure difference over the filter element. The aim of this research was to test different kinds of tank sizes and filter combinations and to determine their effects on water quality in a water hydraulic system. In this paper the results of these experiments are presented. Experiments were made with pilot-scale water hydraulic systems. The systems induced no biological contamination and only a minimum amount of physical and chemical contamination. Filtered tap water was used as a pressure medium. The tested filter ratings (β>5000) were from 10 to 90 µm depth type elements and the three different tank sizes 62, 105 and 148 litres. Experiments were made with water without amendments, and water with nutrient and particle contamination. The test periods were up to four weeks. Pressure difference over the filter, fluid flow and temperature are monitored. Microbiological analyses consisted of total number of cells, heterotrophic viable plate counts and the determination of biofilm formation. In addition, dissolved organic carbon concentration and particle counts were determined. Solving the microbiological problems of water hydraulics requires new approach to tank design methods that support the long-term working of the water hydraulic system. It is possible to (1) reduce microbial growth in water and on surfaces with a proper tank design, (2) keep microbial growth under control and (3) considerably extend the filter lifetimes by using twophased filtration in water hydraulic systems.
KEYWORDS Water hydraulics, filtration, microbial growth, particle contamination
DOC: Dissolved organic carbon [mg/l] EPS: Extra cellular polymer substance ISO 4406 –glass: particle sizes >5 µm / >15 µm ISOMTD: ISO Medium Test Dust
NOMENCLATURE Bar: 105 Pascal CFU: Colony forming unit [cfu/ml]
479
Copyright © 2005 by JFPS, ISBN 4-931070-06-X
R2A: Medium used to culture bacteria in low-nutrient environments β(x): (Number of particles > (x) upstream) / (Number of particles > (x) downstream) INTRODUCTION Microbial growth and particle contamination in water hydraulic systems have to be controlled. Filtration is a potential method to control the numbers of microorganisms and particles in water hydraulic systems and to secure the proper functioning of the system. Microorganisms retained on the filters grow in the filter element as biofilms and increase the pressure difference over the filter element. It has been shown that approximately 80 % of the micro-organisms of a water hydraulic system are on the filter element [1]. The aim of this research was to test different kinds of tank sizes and filter combinations and to determine their effects on water quality in a water hydraulic system. In this paper the results of these experiments are presented. In addition to tap water experiments, contamination simulation experiments were performed in order to illustrate the combined effect of organic contamination (R2A) and particle contamination on the filter elements in water hydraulic systems.
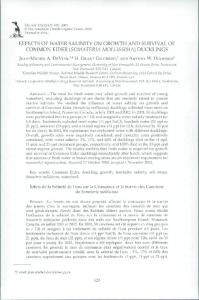
Figure 1 Pilot-system 1
MATERIALS AND METHODS The pilot-systems and the tested filters Two pilot-scale water hydraulic systems were used to simulate the operation of a full-scale system (Figure 1 and 2). The flows produced by the pumps were 34 and 43 l/min. The temperatures of the systems were 35±0.2 °C, which were set to maximize microbial growth in this kind of water hydraulic systems. The systems were made of acid proof stainless steel (AISI 316), only in suction line was used the rubber hose. The sampling ports were before, after or middle of the filter housings. In the system 1 the fluid flow was monitored with ABB COPA-XE flow meter and in the system 2, with a Kytölä VLK-4FA rotameter. The temperature was measured with Pt100-sensor with Nokeval monitor. Pressure differences over the filters were measured with Huba Control pressure difference transmitter DTP 4-420 (0-4 bar, system 1) and Trafag pressure transmitter (0-40 bar, system 2). Measuring data was stored with GlobalLabsoftware. Particle counting was made using Pamas 3216 SBSS bottle sample analyser.
Figure 2 Pilot-system 2 The tested filters were 10 µm and 90 µm (absolute removal ratings β(x)>5000) polypropylene cartridge filters produced by Pall Inc. The filter types were R1F100 and R1F900. The length of these filters was 254 mm and the diameters were 70 mm. These filters are disposable and can be used only once. [2] Experimental set-up and processing of filters Tap water was used as pressure medium in the experiments. Tap water was filtrated through 1.2 µm filter (Opticap 4” Capsule with Durapore Membrane and Milligard Media, Millipore) when filling the tank. P3 Clint CA was used as cleaning agent. The concentration of the cleaning agent in the system was 3 % during the 60 minutes cleaning period. After the cleaning the system was rinsed three times with filtered tap water. During the cleaning process, 10 µm polypropylene cartridge filter was used for the protection of the components from the harmful effects of potential particulate matter. The test filters were installed after the rinsing periods.
480
Copyright © 2005 by JFPS, ISBN 4-931070-06-X
Water samples from the lines of the systems were aseptically taken into autoclaved bottles. Before the sampling the water was allowed to run for 2 to 3 minutes. Samples of polypropylene filter were prepared for scanning electron microscopy (SEM). The pieces were fixed in solution of 1 % glutaraldehyde in 0,1 cacodylate buffer at pH 7. After washing with distilled water, the pieces were dehydrated in ethanol series (70, 85, 95 and 99.5 %). The pieces were prepared in hexamethyldisilazine (HMDS) and air-dried at room temperature. They were stored in exhicator. Before the actual investigation with SEM, the pieces were mounted on to SEM stubs and coated with gold. The coated pieces were investigated with a scanning electron microscope (Philips XL-30). The heterotrophic viable plate counts were determined on R2A medium [3] and the total number of bacteria was determined by DAPI-staining. Also, pH and dissolved organic carbon (DOC) [4] were determined. Contamination substances on the experiments R2A was used as a biological contamination to induce microbial growth. ISOMTD was used to simulate particle contamination in the water hydraulic systems. Depiction of the experiments First three experiments were made to determine the effects of tank size in pure tap water system (experiment 1 105 litres, experiment 2 148 litres and experiment 3 62 litres), and these experiments were made with filtrated pure water. Pre-filtration experiments 4 and 5 were made with filtrated pure water. The experiments 6 and 7 were made with filtrated tap water with additions of R2A on days 7 and 14. Experiments 8 and 9 were re-runs of experiments 6 and 7. Experiment 10 was made to produce 90 µm filter elements which were loaded with different amount of biological contamination. Experiment procedure was as follows: experiment was started with four identical filters connected as shown in figure 1. After one week, when system was operated with pure water, the first of three pre-filters was taken out and it was put in particle test into pilot system 2 (Experiment 11). Experiment 10 continued with two pre-filters and R2A was also added into the system and after one week (two weeks of total running time) the second filter element was put in particle test (Experiment 12). The final phase of experiment 10 was the as previous. After this filter the last of the three pre-filters was put in particle test (Experiment 13).
RESULTS Effect of the tank size In experiments 1, 2 and 3, the pressure difference over the filter elements increased because of slight microbial growth and minimal particle contamination (Figure 3). Experiments showed that when using pure tap water tank size was not important, taken that the tank is made of AISI316 and it has not dead flow areas. It can be seen from figure 3, that the system had more contamination in experiment 1, because cleaning was not efficient enough for new system.
Effect of reservoir size 0.4
Pressure difference [bar]
0.35 0.3 0.25 0.2 0.15 0.1 0.05 0 0
5
10
15
20
25
Running time [d]
Reservoir 105
Reservoir 148
Reservoir 62
Figure 3 Development of pressure difference over R1F100 filter element (Experiments 1, 2 and 3) It has been shown earlier that organic contamination can block the filter element quite fast causing system malfunction [5]. Thus, experiments with organic contamination alone were not necessary in this research.
Capability of pre-filtration system to reduce load of the main filter Experiments 4, 5, 6 and 7 were done to study effects of pre-filtration (Figure 4). In the first two experiments the pressure difference over the filter element increased due to the slight biological and particle contamination. In the last two experiments the pressure difference over the filter element increased due to the slight particle and intense biological contamination.
481
Copyright © 2005 by JFPS, ISBN 4-931070-06-X
Effect of reservoir size 2.2
0.8
2.0
0.7
1.8
0.6
1.6
Pressure difference [bar]
Pressure difference [bar]
Effect of reservoir size 0.9
0.5 0.4 0.3 0.2 0.1
1.4 1.2 1.0 0.8 0.6 0.4
0 0
5
10
15
20
0.2
25
0.0
Running time [d] Reservoir 105
Reservoir 148
Reservoir 62
Reservoir 62+prefil 90
Reservoir 148+prefil 90
Reservoir 148+prefil 90 R2A
0
5
10
15
Reservoir 62+prefil 90 R2A Effect of R2A (reference) Reservoir 148+prefil 90 R2A re-run
Reservoir 62+prefil 90 R2A
20
25
30
Running time [d] Reservoir 148+prefil 90 R2A Reservoir 62+prefil 90 R2A re-run
Figure 4 Development of pressure difference over R1F100 filter element (Experiments 1 to 7)
Figure 5 Development of pressure difference over R1F100 filter element (Experiments 6 to 9 and reference)
Pre-filtration was not necessary in case of pure water, but the advantage was clearly seen, when water was biologically contaminated. Absolute amount of biological contamination had a significant effect on the pressure difference over the 10µm filter element. The determination of this effect is really difficult, because microbial growth can not be precisely predicted in complex water hydraulic systems. In figure 5, the development of pressure difference in the experiments 6 and 7, the re-runs of them (experiments 8 and 9) and also a reference experiment [5] are shown. The relative addition of R2A and temperature were the same in all experiments, in order to keep the environment as equal as possible. Only things which were changing were the quality of the tap water and the volume of the water in the system. In point of view microbiology the cell numbers were almost the same, when thinking the accuracy of the measuring and analysing methods and the nature of the microbial growth. Even in the laboratory conditions the effect of the microbial growth was not constant, which was seen when comparing experiments 6 and 8 and experiments 7 and 9. When R2A was added the first time there no significant differences between the experiments, but the second additions change the situation and give a clear indication that pre-filtration reduces a load of the main filter when absolute amount of the biological contamination is considerable. This is mostly due the larger surface areas of the filters in the system.
Effect of organic contamination on 90 µm filter element Figure 6 shows how pressure difference over 90 µm filter element changes during experiments with pure water or biologically contaminated water.
Change of the pressure difference of the pre-filters
Pressure difference [bar]
0.15
0.1
0.05
0 0
5
10
15
20
25
-0.05
Pre-fil 62
Pre-fil 148
Pre-fil 62 R2A
Pre-fil 148 R2A
Pre-fil 62 R2A re-run
Pre-fil 148 R2A re-run
Running time [d]
Figure 6 Development of pressure difference over R1F900 filter element (Experiments 4 to 9)
482
Copyright © 2005 by JFPS, ISBN 4-931070-06-X
Biological contamination does not have significant effect on R1F900 filter. Average change of pressure difference was about 0.04 bar, which very low when compared with that of the 10 µm filters (Figure 5). Low flow volumes (43 l/min@3 parallel filters) through filters partly explained the difference. It has been observed that microbial attachment likely occurs in areas of low flow velocities [6]. In this case, the low flow velocity was not the problem. Utilization of microbial growth to improve filtration ratio of 90 µm filter element 90 µm filter element is not capable of keeping particle contamination under control, because of its large bore size. On the other hand the 90 µm filter element has no pressure loses even then when it is loaded by organic contamination.
Pressure difference [bar]
Change of the pressure difference 0.55 0.45 0.35 0.25 0.15 0.05 -0.05 0
5
10
Over 90 element
15
20
Before 3+1 90 elements
25
Running time [d]
Figure 8 Development of pressure difference over R1F900 and R1F100 filter elements (Experiment 10) In figure 9 experiment 11 was aborted because R1F900element was not capable of filtering ISOMTD. Particle counts stayed in absolutely to high level and experiment was stopped to protect test equipment.
Pressure difference [bar]
Effect of ISOMTD 1 0.95 0.9 0.85 0.8 0.75 0.7 0
5
Clean
Figure 7 Biologically contaminated R1F900 filter element
10
15
1 week R2A
20
25
2 weeks R2A
30
35
40
ISOMTD sum[g]
Figure 9 Development of pressure difference over R1F900 filter elements (Experiments 11, 12 and 13)
In figure 8 is shown the changes in pressure differences over pre-filters and main filter (Experiment 10) are shown. The most interesting outcome was that the main filter (90 µm) did not get clogged at all. The changes in pressure difference over pre-filters were mainly caused by flow restriction in the parallel line where the pre-filter number three was connected. During experiment 10 the flow tripled in that line.
In experiments 12 and 13, there were not significant changes in pressure differences, but in experiment 12 ISO 4406 –glass was about 15/12 and in experiment 13 it was 11/8. This showed that 90 µm filter significantly improved its filtering grade, when biological contamination was introduced into the filter. At the same time the pressure difference was equal to clean filter element, when accuracy and resolution of measuring devices were taking into account. The combined effect of biological and particle contamination in case of 10µm filter has been reported very problematic [7]. Figures 10, 11 and 12 show how quick 10 µm filters have got clogged due to combined effect of biological and particle contamination. In these
483
Copyright © 2005 by JFPS, ISBN 4-931070-06-X
experiments, R2A and ISOMTD were added in three different ways into the system.
acceptable way (low pressure losses and low ISOglasses), when organic contamination was present. In full-scale industrial applications the organic contamination is often present. This fact gives a possibility to consider using filter elements, which have larger bore sizes, because biological contamination improves the filtration ratio quite fast.
Effect of R2A and ISOMTD on pressure difference over R1F100 filter element 25
5
R2A-addition on the 8th day
ISOMTD sum
4
15
3
10
2
5
1
0
Pressure difference [bar]
ISOMTD sum [g]
Pressure difference
20
CONCLUSION Experiments showed that when using pure water tank size is not important, but it is also known that microbial attachment likely occurs in areas where low flow velocities are, resulting in conclusion that unnecessary big tank construction may increase microbial problems. Pre-filtration is not necessary in case of pure water, but the advantage is clear, when water is biologically contaminated. Combined effect of particles and biofilm can be reduced by using R1F900 –elements, which are working in acceptable way (low pressure losses and low ISOglasses), when organic contamination is present.
0 0
3
6
9 12 15 Running time [d]
18
21
Figure 10 Development of pressure difference over R1F100 filter element (R2A addition on the 8th day) [7]
Effect of R2A and ISOMTD on pressure difference over R1F100 filter element 25
10
ISOMTD sum
R2A-addition on the 6th day 8
15
6
10
4
5
2
0
Pressure diff. [bar]
ISOMTD sum [g]
Pressure difference 20
REFERENCES [1] Varjus, S.H., Growth and Filtration of Microbes in Water Hydraulic Systems, Master of Science Thesis, Tampere University of Technology, 2001. [2] Pall Inc, Profile II polypropylene filters, USD1328b, 1997. [3] Reasoner, D.J. and Geldreich, E.E., Applied and Environmental Microbiology, 1985. [4] SFS-EN 1484, Water analysis. Guidelines for the determination of total organic carbon (TOC) and dissolved organic carbon (DOC), Suomen Standardoimisliitto SFS, Standard, 1997. [5] Riipinen, H., Varjus, S., Soini, S., Puhakka, J.A., Koskinen, K.T. & Vilenius, M. 2002. Effects of Microbial Growth on Filtration in Water Hydraulic System. Proceedings of the 49th National Conference on Fluid Power, March 19-21, 2002, Las Vegas, USA. USA. pp. 235-240. [6] Soini, S. M. Microbial ecology and control in water hydraulic systems. DrTech Dissertation. Department of Environmental Technology, Tampere University of Technology. Tampere University of Technology Publications 361. ISBN 952-15-0802-7. 161p. 2002 [7] Riipinen, H., Varjus, S., Soini, S., Puhakka, J. A., Koskinen, K. T., Vilenius, M. (2002) Effects of Microbial Growth and Particles on Filtration in Water Hydraulic System, 5th JFPS International Symposium on Fluid Power, Nara, Japan, pp. 173-176.
0 0
3
6
9
12 15 18 Running time [d]
21
Figure 11 Development of pressure difference over R1F100 filter element (R2A addition on the 6th day) [7]
Effect of R2A and ISOMTD on pressure difference over R1F100 filter element 4
ISOMTD sum
18
3.6
Pressure difference
16
3.2
14
2.8
12
2.4
10
2
R2A-addition on the 1st day
8
1.6
6
1.2
4
0.8
2
0.4
0
Pressure difference [bar]
ISOMTD sum [g]
20
0 0
1
2
3
4
5
6
7
8
9
Running time [d]
Figure 12 Development of pressure difference over R1F100 filter element (R2A addition on the 1st day) [7] This kind of combined effect of particles and biofilm was not seen in experiments 11, 12 and 13 (Figure 9). This indicated that R1F900 –elements were working in
484
Copyright © 2005 by JFPS, ISBN 4-931070-06-X