cle, whose inner diameter was 98.5 cm and width was 1.3 cm. The frame, rod, and circle were all set to the same subjective luminance of about. I0 cd/m2 and ...
Perception & Psychophysics 1989, 45 (4), 307-314
Effects of peripheral circular contours on dynamic spatial orientation TIMOTHY G. BABLER University of Wisconsin, Madison, Wisconsin and SHELDON M. EBENHOLTZ State University of New York, New York, New York The rod-and-frame effect (RFE) was investigated with the use of a frame that oscillated about an axis at its center at five different frequencies, ranging from .013 to .213 I-Iz. The resultant RFE shifted continuously with the roll motion of the frame, and it was significantly larger at the lowest frequency (.013 Hz) than under comparable static conditions. The dynamic RFE was lowest at the higher oscillation frequencies. Oscillatory roll vection--apparent self-motion--was reported by 3 of the 9 subjects when the frame was oscillating at its highest frequency (.213 Hz). The subjects yielded large increases in the RFE during the sessions with reports of vection. Surrounding the kinetic frame with a circular contour eliminated all reports of vection and significantly interacted with frequency to reduce the RFE--but only at low frequencies. The reduction amounted to 21.2% averaged over all 9 subjects at the three lowest frequencies. A surrounding contour, therefore, suppressed low-frequency kinetic visual orientation information that might otherwise have produced larger changes in apparent self-orientation and perceived vertical. Vection-sensitive subjects differed from nonvection subjects by exhibiting (1) a high-frequency fall-off in real-motion gain, (2) a high-frequency enhancement in illusory-motion gain, and (3) only a small and nonsignificant increase in illusory-movement phase lag with increases in frequency.
An upright line enclosed within a tilted square frame volves lower-order automatic processes, and is capable will appear to be tilted in the direction opposite that of of regulating the perception of self-motion and body orienthe frame. When attempting to set the line to an apparent tation. vertical orientation, an upright observer will tend to err The RFE does, indeed, respond to stimulation in the in the direction of the frame tilt. This illusory shift in ver- visual periphery. An increase in the eccentricity of the ticality, known as the rod-and-frame effect (RFE), has sides of the tilted frame produces an increase in the RFE been studied extensively since it was first described by (Ebenholtz, 1977; Ebenholtz & Callan, 1980). In fact, Witkin and Asch (1948). changes in the visual angle of the display yield correspondRecent evidence lends support to the interpretation of ing changes in the magnitude of the RFE. Since a frame the RFE as an automatic noncognitive phenomenon, a type producing a large retinal angle necessarily covers a greater of visual-vestibular interaction that aids in self-orientation retinal area in the periphery than does a smaller less ec(Ebenholtz, 1977, 1985a; Ebenholtz & Callan, 1980). In centric image, the increase in the RFE may seem to be other words, the RFE is essentially an example of the attributable to increased stimulus size or area, rather than work of the ambient visual system. According to the con- to eccentricity as such. There is, in fact, evidence to supcept of two visual systems (Leibowitz & Post, 1982), the port the role of image area or contour length, since a parfocal system responds primarily to stimulation of the cen- tial frame consisting either of comers only or of sides only tral visual fields, entails cognitive processing, and is (Ebenholtz, 1985a; Streibel, Barnes, Julness, & Ebenresponsible for the discrimination and identification of holtz, 1980) produces a significantly lower RFE than the visual features. The ambient system, on the other hand, comparable full-frame configuration does. On the other responds both to peripheral and central stimulation, in- hand, although comers represented only about 23% of the linear extent of the sides in these experiments, there were no significant differences between the two partialThis research was presented by Timothy G. Babler in partial fulfillframe configurations. This might have occurred because ment of the requirements for the MS degree in the Department of Psychology, University of Wisconsin-Madison. The research was supported the comers of a square frame are necessarily more ecin part by Research Grant BNS-8201441 from the National Science Foun- centric than the sides, and hence the comers may have dation, to Sheldon M. Ebenholtz. The authors thank Robert Post for his illuminating comments on a draft of the manuscript. Reprint requests had the advantage of eccentricity to balance the loss due should be directed to Sheldon M. Ebenholtz, Schnurmacher Institute to area. Thus both eccentricity and contour length or area for Vision Research, College of Optometry, State University of New may be significant parameters of the RFE. It also is imYork, 100 East 24th Street, New York, NY 10010. portant to note that the RFE is sheltered from many of 307
Copyright 1989 Psychonomic Society, Inc.
308
BABLER AND EBENHOLTZ
the cognitive processes associated with the focal system. METHOD Perceived size (Ebenholtz, 1977; Ebenholtz & Callan, 1980), form (Streibel et al., 1980), and depth perception Subjects (Ebenholtz & Glaser, 1982) do not influence the magni- The subjects were 6 female and 3 male students from the University of Wisconsin-Madison. Their ages ranged from 18 to 22. Three tude of the RFE. additional subjects were eliminated, 1 because of motion-sickness The image of the tilted frame can be assumed to stimu- symptoms (headache and nausea), and 2 others for failing to follate receptive fields in the visual periphery, which act later low instructions. Since eyeglasses constitute a possible frame of upon detectors that signal self-orientation. The end result reference for vertical orientation, the subjects were limited to peoof viewing the tilted frame is an illusory self-tilt in the ple wearing contact lenses or with normal uncorrected vision. direction opposite to the frame tilt. If the observer does feel tilted and the rod is aligned with the body, then the Apparatus Both the rod and the frame were made of electroluminescent rod too should appear tilted away from vertical. When panels. The square frame was 59.5 cm on each side, with a width asked to adjust the rod to apparent vertical, the observer of 3.8 cm. Square pieces of black tape were placed on the frame should then place the rod in the direction opposite to per- panels to create a checkerboard-like pattern. The rod was 7.5 × ceived self-tilt, which is toward the frame tilt. 0.3 cm. The rod and frame were positioned within a luminous cirA number of studies have demonstrated sensations of cle, whose inner diameter was 98.5 cm and width was 1.3 cm. The were all set to the same subjective luminance self-tilt that result from viewing a tilted frame. Ebenholtz frame, rod, and circle 2 and shared the same axis around the line of sight. of about. I0 cd/m and Benzschawel (1977) found errors of a few degrees The subjects viewed the display in the frontal plane from a distance in the direction of a tilted frame when subjects attempted of about 50.76 cm, which provided, for the length of the rod and to set their head to gravitational vertical. Later studies, one side of the frame, retinal angles of 8.45° and 60.75°, respecusing a similar procedure (Sigman, Goodenough, & Flan- tively, and for the diameter of the inner edge of the circle, a retinal nagan, 1979) and a magnitude-estimation procedure (Sig- angle of 88.27°. man, Goodenough, & Flannagan, 1978) have yielded The rod and frame could be sinusmdally oscillated about their similar self-tilt results. Since apparent self-tilt, however, centers at various frequencies and amplitudes. The frequencies ranged from 0 (static) to .213 Hz, while the peak to peak amphhas been shown to be systematically lower in magnitude tudes ranged from -15° (ccw) to +15° (cw), symmetrically with than the corresponding RFE is, it would appear that the respect to vertical. The motion of the rod could be controlled by tilted frame represents a stimulus for both effects, but that the subject with a 30-cm diameter steering wheel, calibrated with induced self-tilt is not the singular cause of the RFE. a gain of 1.0, such that a 1° wheel rotation produced a 1 ° rod roIn recent years, a rather compelling means of dramati- tation. The subjects sat in a modified dental chair. The chair’s footrest cally altering the size of the RFE has been found. Merely was covered with foam rubber to minimize somatosensory cues. surrounding the tilted frame with a circular contour Attached to the chair was a helmet connected to a strain gauge, reduces the tilt effect to only 25 % of its original magni- which was used to monitor any tilt of the head. tude (Ebenholtz & Utrie, 1982, 1983). If, instead, a necesThe position of the steering wheel, the frame position, the line sarily smaller circle is inscribed within the frame, no RFE orientation, and the subject’s head position~ were all recorded on reduction occurs. However, with the outer circle and both a pen recorder and an analog signal recorder. frame removed, a frame within the latter circle again will be inhibited from yielding a full RFEo Here the peripheral Design Each subject was exposed to all 12 conditions. These included nature of the visual stimulus has become strictly relative, the five frame oscillation frequencies of .013, .027, .053, . 107, since the relative locations of the circle and frame, rather and .213 Hz, plus a static frame, all with the circle illuminated, than eccentricity as such, have been shown to be crucial and the same 6 conditions with the circle absent. The sequence of for the control of spatial orientation. If there is a separa- conditions was determined by a balanced six-item Latin square. tion in depth between the frame and circle, the inhibition Within subjects, the circle and no-circle conditions were completed of the RFE remains intact (Ebenholtz, 1985b). The cause in successive sessions counterbalanced across subjects, so that each subject completed both circle and no-circle conditions at a given of this inhibition effect has yet to be explained. In the study described here, we examined the RFE un- frequency before a different frequency was presented. The sessions approximately 1 to 2 days apart, and only one frequency was der dynamic conditions. This was achieved by oscillat- were examined per session. ing the frame at various frequencies. A kinetic rod-andframe device allows for a comparison between static and Procedure dynamic tilt effects. If the RFE is, indeed, an example The subjects viewed the rod-and-frame display in complete darkof a static analog of visually induced self-motion (Eben- ness, so that only the line, frame, and circle were visible. With holtz, 1977), then a kinetic frame may be capable of in- the subject seated, the steering-wheel box was placed across the ducing vection. In the case of a sinusoidally moving arms of the chair in a horizontal plane. A black cloth was then draped the subject’s shoulders, arms, and hands, as well as across frame, oscillatory roll vection may result, similar to that across the steering-wheel box. This precaution was taken to minimize any induced by other rotating visual stimuli (see, e.g., Dich- possible visual orientation cues that the hands or box might have gans, Mauritz, Allum, & Brandt, 1976). A second goal provided. was to examine the inhibition effect of the surrounding The subjects were instructed to keep the line looking vertical at all times. Vertical was defined for the subjects as parallel to the circular contour under dynamic conditions.
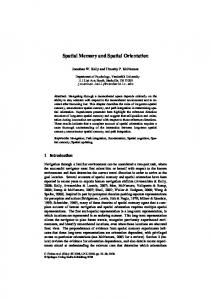
KINETIC ROD-AND-FRAME EFFECT 309 unseen walls and in the direchon of gravity. Such a task required Oscillatory Roll Vection the subjects to make prompt and continuous steering adjustments Three different subjects reported periods of oscillatory throughout the entire session. In addition, the subjects were inroll vection during the frame oscillation. During complete structed to report immediately any detection of the frame’s ceasing oscillatory roll vection, the moving visual stimulus (the to oscillate or any sensation of self-motion. These were prime inoscillating frame) appeared stationary, while the subjects dicators that oscillatory roll vection was occurring. The sessions were divided into two parts: first, a line-alone por- perceived themselves to be rolling from side to side in tion in which a truly oscillating line had to be nulled by proper a cartwheel fashion around their line of sight. The induced steering-wheel movements; and second, a line-and-frame portion, vection sensation, which was opposite to the direction of in which only the frame oscillated at a 15° amplitude, but in which visual stimulus motion, lasted only about four to five cythe subject had to continuously null the illusory line oscillation. The line-alone or real-movement portion was divided into three 3.75- cles. Of potential significance is the fact that no reports min segments, each at a different peak line amplitude: the first was of vection occurred when the circle circumscribed the oscillating frame. All three sessions with vection occurred at 3.75°, the second at 7.5°, and the third at 15°. All three segments of the line-alone session were completed at the same frequency at the highest frequency (.213 Hz) without the circle as the frame in the subsequent line-and-frame portion of the ex- present. periment. To maintain consistency, when a subject was tested in a circle condition, the line-alone portion as well as the line-and- Kinetic Rod-and-Frame Effect frame portion was completed with the circle illuminated. The lineFigure 1 shows the RFE measured in degrees, for conand-frame portion lasted 25 min. The static frame sessions entailed eight line-alone and eight line-and-frame settings, in which the frame ditions with and without a circular contour. A positive was tilted 15° cw for half of the sessions and 15° ccw for the re-RFE value represents an error in line setting in the direcmaining ones. tion of frame tilt. For the entire sample of 9 subjects, the Dependent Measures For the analysis of the data taken during the sessions with oscillatory motion of the frame, the amplitude of the steering response was sampled at nine equally spaced points per oscillation cycle and averaged over the final 10 complete cycles of each condition. A best-fitting sinusoid was then calculated for these nine data points. The peak amplitude of this best-fitting sinusoid was the measure of illusory tilt. These response amplitudes were then converted into gains, the ratio of output to input amplitudes. A steering response equal in amplitude to that of the tilting frame would represent a perfect gain of 1.0. The ratio of an illusory line tilt of 3° to a peak frame tilt of 15° would correspond to a gain of 0.2. Phase shift averaged over the beginning and midpoint of each cycle was also calculated for these final 10 cycles. The phase shift was defined as the average number of degrees by which the steering response lagged behind the stimulus motion. For example, a phase shift of -90° would mean that the steering response was, on the average, a quarter cycle behind the movement of the frame. In a similar fashion, gains and phase shifts were also calculated for the final 10 cycles in the control conditions, where only an oscillating line was present. The peak amplitude of these best-fitting sinusoids measured the ability of each subject to keep an actually oscillating line in an upright position.
RFE of the kinetic frame tended to be larger than the RFE of the static frame condition. This was especially apparent at the lowest frame frequency (.013 Hz), where the kinetic RFE was 40% greater than the static RFE in the no-circle condition, yielding means of 3.96° and 2.84°, respectively It(8) = 2.29, p < .05]. Corresponding values in the circle-present condition, where the mean static and slowest kinetic RFEs were 2.25° and 3.03°, showed an increase of 35 % in the kinetic condition It(8) = 3.18, p < .05]. A pattern similar to that of the nonvection subjects occurred in the data of the 3 vection-sensitive subjects, in that the latter also exhibited an increased effect at the
7. 6. 5-
CIRCLE NO CIRCLE NON-VECTION: n = 6
4. 3. 2.
RESULTS O.
The subjects who viewed the vertical line within the 7. oscillating frame perceived the line itself to oscillate in 6" opposition to the motion of the frame. For example, as 5. the frame rotated clockwise, the enclosed line would ap4" pear to be rotating in a counterclockwise direction. For 3. some individuals, the illusory line motion was quite dra2" matic, often 5° to 10° in peak amplitude during portions of the experimental session. However, as is often the case 0 in rod-and-frame tasks, there were extreme individual 0 .013 .027 .053 .107 .213 FREQUENCY (Hz) differences. While all of the subjects did experience a kinetic RFE, a few perceived only a slight movement of Figure 1. Mean illusion amplitude for static and sinusoidally osthe line, sometimes less than 1 o of peak tilt during par- cillating frames: top, nonvection subjects; bottom, vection-sensitive ticular frame cycles. subjects. Bar represents 1 SEM (standard error of the mean).
310
BABLER AND EBENHOLTZ
lowest frequency over the static condition. The vectionsensitive subjects showed a higher RFE than the nonvection subjects at all but the static and lowest kinetic frequency, and they also exhibited an extraordinarily large RFE at the highest frequency, in the absence of the circle. This pattern produced a significant vection × circle × frequency interaction [F(5,35) = 5.64, p < .001].
0 -10.
iLLUSORY MOVEMENT. ¯ CIRCLE ~RCLE
-20-30-40-50-
Orientation Inhibition -601 Over all 9 subjects, the circle was effective in reducNON-VECTION: n = 6 ~ VECTION" n = 3 ing the line-tilt illusion caused by the tilted frame IF(1,7) = 17.95, p < .01]. Averaged across all kinetic condi01.3 027.053 .107 .213 01.3 027 05.3 107 .21‘3 tions, this reduction in tilt measured approximately 18 %. FREQUENCY (Hz) A similar inhibition of the RFE by the circle (20% decrease) occurred for the static frame. The inhibitory Figure 3. Phase lag as a function of frequency: illusory-movement effect of the circle was similar for both vection-sensitive conditions for nonvection subjects (left) and vection-sensitive suband nonvection subjects, and, as Figure 2 suggests, it was jects (right). Bar represents 1 SEM (standard error of the mean). limited to the three lowest frequencies. Further analyses of the orientation-inhibition effect will be presented below. The top two functions to the right in Figure 2 represent the gain data from the control sessions with actual line motion. Only the real-motion condition with peak line amGain plitude of 3.75° was analyzed fully, since this corVection-sensitive subjects. The 3 subjects reporting vection had very similar patterns of results. Figure 2 responded most closely to the obtained illusory ampli(right) shows their combined data. The gain data from tudes. Furthermore, visual analysis of all three real-motion the remaining 6 subjects are shown to the left in Figure 2. amplitudes of 4 subjects at the highest and lowest frequenA number of features distinguish these plots. One differ- cies showed an excellent linear relation between output ence in the illusory-motion data is the sharp increase in (that is, the subjects’ responses) and stimulus input amthe RFE gain at the highest frame frequency without the plitudes. Thus, the system was linear with respect to incircle, for the subjects reporting vection. Note that this put amplitude and it may be concluded that the gain was condition was the only circumstance in which self-motion identical, regardless of the stimulus amplitude chosen for was reported. In other words, the sessions with reports analysis. With a peak line amplitude of 3.75°, the steerof vection yielded dramatic increases in the RFE-- ing response during the control sessions was often nearly approximately a 77% increase in amplitude over the perfect, especially at the low line frequencies. It is potennearest frequency It(2) -- 6.58, p < .05]. There was no tially significant, however, that among the subjects reportoverall effect of frame frequency on the response gains ing vection, the accuracy of the steering response of the vection subjects, although a significant circle × decreased significantly as the line frequency increased frequency interaction was present [F(4,8) = 6.16, |F(4,8) = 9.36, p < .01]. A decrease in gain was most apparent above .05 Hz. p < .01]. Nonvection subjects. The illusory-motion data for the nonvection subjects, shown to the left at the bottom of REAL MOVEMENT: Figure 2, indicate a circle × frequency interaction, o CIRCLE reflecting a greater inhibitory effect of the circle at the ~ NO CIRCLE 0 lower frame frequencies [F(4,20) = 3.08, p < .05], and, equivalently, a decrease in gain along with an increase ILLUSORY MOVEMENT: ¯ CIRCLE in frequency--but mainly in the absence of the circle. ¯ NO CIRCLE Under real line-movement conditions, represented at -1 2 the top left of Figure 2, there was no significant change -16 in the response gains across line frequencies. There was, -20 furthermore, no difference in the steering response beNON-VECTION n = 6 VECTION" n = 3 tween circle and no-circle conditions during the control -24 sessions for either the vection or the nonvection subjects. .013 .027 .053 .107 .213
.013 .027 053 107 213
FREQUENCY (Hz)
Figure 2. Gain as a function of frequency for real- (top) and illusory- (bottom) movement conditions, for nonvection subjects (left) and vection-sensitive subjects (right). Bar represents 1 SEM (standard error of the mean).
Phase Lag Nonvection subjects. To the left of Figures 3 and 4 are illustrated the phase-shift data for the 6 nonvection subjects with respect to illusory line motion and real line motion. The phase lag associated with the steering
KINETIC ROD-AND-FRAME EFFECT 311
-10
REAL MOVEMENT: o CIRCLE
was also obtained, reflecting a significant increase in phase lag as frequency increased, but only under real-movement conditions.
~ -20
Static versus Kinetic RFE It has already been shown that the lowest-frequency kiT: -40"netic RFE yields an RFE significantly higher than that ~, -50of the static display. The question presently evaluated con.,< cerns the degree to which the static and kinetic conditions ~-T __601 are correlated. A Pearson R-correlation matrix, shown --701 NON-VECTION: n = 6 VECTION. n = 3 in Table 1, was prepared for the 6 nonvection subjects, -8O eliminating the vection-sensitive subjects because of their .013 027 053 107 .213 013 .027.053 107 213 anomalously enhanced performance at the highest freFREQUENCY (Hz) quency. None of the correlations reached statistical sigFigure 4. Phase lag as a function of frequency: real-movement nificance at p = .05, but the data suggest a clear trend conditions for nonvection subjects (left) and vection-sensitive subtoward a diminished degree of association as frame frejects (right). Bar represents 1 SEM (standard error of the mean). quency (and peak velocity) increased. The data for all 9 subjects also show a great loss of association at the highest response for the nonvection subjects showed a steady in- frequency. Although the correlation between the static patcrease as frequency increased, during both frame mo- tern and the lowest-frequency kinetic condition this time tion [F(4,20) = 7.14, p < .01] and actual line motion achieved statistical significance at p < .02, none of the [F(4,20) = 21.87, p < .01]. In other words, the steer- remaining correlation coefficients did likewise. This trend, ing response of the subjects lagged behind the movement because of the small sample size, is not conclusive, but of the visual stimulus. The phase shifts were the same with it suggests a radical change in process as one responds and without the circle. However, there was a greater phase first to a static frame and then to a high-speed kinetic verlag during illusory line motion than during actual line mo- sion of the same pattern. tion IF(l,5) = 7.50, p < .05]. The phase lag slowly increased from about 15° at .013 Hz to about 45° at DISCUSSION .213 Hz during actual line motion. During illusory line motion, the phase lag increased from about 15° to ap- It has previously been suggested that the RFE represents proximately 60° at the highest frame frequency. The 60° a type of visual-vestibular interaction (Ebenholtz & phase shift represents a steering response that trails the Glaser, 1982; Ebenholtz & Utrie, 1983) similar to that visual stimulus motion by one sixth of a cycle. witnessed during circular (Brandt, Dichgans, & Koenig, Vection-sensitive subjects. To the right of Figures 3 1973) and linear vection (Lestienne, Soechting, & and 4 are shown the phase shift of the steering response Berthoz, 1977), and most closely associated with roll vecduring frame and actual line motion, for the subjects who tion (Held, Dichgans, & Bauer, 1975). In fact, the RFE reported vection. Under illusory-movement conditions, may be regarded as a static form of roll vection (Dichthe shallow change in phase lag across frequencies, shown gans & Brandt, 1978; Ebenholtz, 1977). These proposals in Figure 3, was not statistically significant. In other are supported by the fact that oscillatory roll vection has words, the vection-sensitive subjects did not yield an in- actually been induced in some subjects during the oscilcreased phase lag, unlike the nonvection subjects, when lation of the frame. It has been concluded that while a the frame oscillated at high frequencies. The phase-shift stationary tilted framework may displace postural vertidata during the real-motion sessions, however, was quite cal (Ebenholtz & Benzschawel, 1977), an oscillating flame similar for the vection-sensitive and the nonvection sub- may actually induce a continuously changing displacejects, in that the former also yielded a significant increase ment, in both direction and degree, of apparent body in phase lag as frequency increased [F(4,8) = 15.75, orientation. Although a functional similarity thus has been p < .01]. A marginally significant interaction between identified between static and kinetic frame displays, the type of motion and frequency [F(4,8) = 3.82, p = .05] correlational analysis shown in Table 1 suggests that individual differences among observers are not maintained Table 1 under the two conditions. The kinetic version seems to Correlation Matrix Between Static Frame and Various add an independent dimension, that of peripheral frame Frequencies (Hz) of the Kinetic Conditions motion, so that performance on the two tasks becomes Frequency disassociated, especially at high frequencies or peak ven .013 .027 .053 .107 .213 locities. This result may help to explain the failure to adeNonvection subjects 6 ¯770 ¯718 .666 ,633 .399 quately predict the incidence of motion sickness on flight All subjects 9 .755 .579 ¯629 .545 ¯ 175 simulators from performance on static red-and-frame dis~ -~o
312
BABLER AND EBENHOLTZ
plays (Frank & Casali, 1986). It is also worth noting that accordingly. For example, motion-sickness symptoms although there is evidence for an enhanced dependence often accompany visual-vestibular conflicts (Lackner & on visual stimulation for spatial orientation in microgravity Graybiel, 1979), especially during moments of visually environments (Oman, 1984; Young, Oman, Watt, induced self-motion. Reports of dizziness and other disMoney, & Lichtenberg, 1984), the capability to predict comforts were very frequent during the kinetic frame conperformance from earth to zero G may depend on the use ditions, especially at the highest frame frequency, which of kinetic rather than static rod-and-frame tests. was the condition in which vection sometimes occurred. It should be noted that only 3 of the 9 subjects ex- Six of the 9 subjects reported dizziness during the highest perienced vection. Thus, perhaps because of the varying frame frequency (.213 Hz). One potential subject was velocity and acceleration profile, a sinusoidally oscillat- dropped from this study because of complaints of very ing frame may be somewhat less effective in producing severe motion-sickness symptoms (headache, nausea) roll vection than other visual motion stimuli, such as con- while viewing the oscillating frame. No subject reported tinuously rotating constant-velocity random dot displays, any discomfort during any of the control sessions in which are (Held et al., 1975). On the other hand, since vection the frame was absent. As a group, the nonvection subjects with the circle abwas achieved only at the highest peak velocity (20°/sec) employed in this study, higher velocities of frame oscil- sent exhibited a small but significant decrease in the RFE lation may produce more frequent occurrences of oscil- as the frame frequency increased. This small effect was not unexpected. For sinusoidal visual roll motion latory roll vection. Why only certain individuals experienced sensations of produced by oscillating random dot displays, the illusory self-motion during the frame movement remains of course tilt in verticality depends mainly on the oscillation angle a mystery. A clue may be provided by the high-frequency of the visual stimulus (Mauritz, Dichgans, & Hufschmidt, gain drop in the real line-movement condition (see 1977). For random dot displays devoid of orientation inFigure 2, right), for the individuals who reported vection. formation except that signaled via visual image motion, They apparently possess an increased sensitivity to mo- the oscillation angle or amplitude, as shown by Mauritz tion in the central visual field, since they saturate early-- et al., is the product of the peak velocity and the oscillatheir ability to process motion signals deteriorates at lower tion period. The rod-and-frame apparatus, on the other rotational velocities, relative to the ability of nonvection hand, does have linear elements that in themselves signal subjects. In contrast, the nonvection subjects showed a tilt angle. Using a random dot display, Mauritz et al. high and stable gain at all frequencies (see Figure 2, left). found the amplitude of subjective vertical tilt to be directly Thus sensitivity to optokinetic stimulation may be a proportional to the logarithm of the oscillation angle of predictor of vection proclivity and perhaps motion- roll motion. Certainly a roll motion stimulus of an oscilsickness sensitivity as well. It also may be significant that lating frame may be expected to produce a similar relathe phase-lag frequency functions differed for the vection tionship. Since, in the present study, the oscillation anand nonvection subjects, the former failing to show a sig- gle was maintained at a constant peak amplitude of 15°, nificant phase-lag increase with increasing frequency un- an unchanging response gain should be expected on this der illusory-movement conditions. This suggests that basis. On the other hand, high frequencies tend to diminvection-sensitive subjects have higher cutoff frequencies ish response gains (Mauritz et al., 1977), whereas increasin peripheral vision: they tolerate higher velocities and ing peak velocities (correlated with frequency) tend to enhave shorter time constants for the processing of motion hance the amplitude of the tilt illusion (Dichgans, Held, stimuli in the retinal periphery than do nonvection Young, & Brandt, 1972; Held et al., 1975). As a result, any drop in gain that may be encouraged by a frequency subjects. An interesting finding was the abrupt increase in the increase would be nullified to some degree by the accomRFE during the sessions with reports of vectionz (see panying increase in the peak velocity of the visual stimuFigures 1 and 2). During conditions when one is most lus. The absence of large gain loss with increasing fresusceptible to visually induced self-motion, one may quency, therefore, is consistent with the conclusion that demonstrate a distinct increase in amplitude of an other- the oscillation angle of the roll motion stimulus is an imwise quite stable rod-and-frame effect. This suggests the portant variable in the determination of the amplitude of operation of an orientation-constancy process (Ebenholtz, illusory tilt in kinetic displays. The nearly perfect response gains during the real1970), in which observers compensate for registered body movement control sessions demonstrate the capability of tilt by rotating the line in the opposite direction. This process may combine with the effect of the frame tilt to the subjects in making steering movements that corproduce an enhanced RFE. A relative increase in one’s responded to the amplitude of actual line motion. The measured kinetic RFE, therefore, may provide a valuable steering response during frame oscillation, therefore, may indicator, which shows that conditions are especially con- be considered a fairly precise measure of the amplitude of the illusory line movement. Nevertheless, a number ducive for vection. If the RFE is, indeed, an instance of visual-vestibular of critical differences exist between the actual and apparinteraction, then one would expect the kinetic RFE to act ent line movement. The actual line tilt during the control
KINETIC ROD-AND-FRAME EFFECT sessions stimulated receptors within about 8° of the fovea, whereas illusory line movement during frame oscillation was a result of stimulation of receptors at about 30° of eccentricity in the retinal periphery.3 Any illusory line movement caused by the oscillating frame would be localized in the area of the retina primarily reserved for the focal system (Leibowitz & Post, 1982). Yet this apparent movement registered by the focal system was actually driven by peripheral stimulation. The need to develop an adequate physiological model for these events remains. The inhibition effect of the surrounding circular contour on the rod-and-frame effect was extended to kinetic conditions. The circle around the oscillating frame was effective in reducing the rod-and-frame effect by about 21%, averaged across the three lowest frame frequencies. This reduction, however, is considerably less than that found in a number of earlier studies (Ebenholtz, 1985b; Ebenholtz & Utrie, 1983). All previous studies dealing with the inhibition of the RFE have tested the illusion only under static frame conditions. In this study, we also examined the inhibition effect of the circle with a stationary frame, but found only a 20% reduction of the RFE, compared to the average reduction of over 75 % found by Ebenholtz and Utrie (1983). The fact that the RFE inhibition was relatively small under both static and kinetic conditions suggests that the dynamic nature of the oscillating frame was not the primary reason for the small inhibition under kinetic conditions. One possible explanation for the relatively small inhibition effect is the extreme eccentricity of the frame and circle in the present experiment. In the present study, the diameter of the circle produced a retinal angle of 88°, which exceeded the retinal angle of 55 ° used by Ebenholtz and Utrie (1983), or of 71° in a more recent study (Ebenholtz, 1985b). It is generally the case that the RFE is enhanced as the frame moves toward the visual periphery (Ebenholtz, 1977; Ebenholtz & Callan, 1980). For this reason, the apparatus was set at a distance that would produce an exceptionally large retinal angle. However, the circle may thereby have been placed too far into the periphery. In other word~, the inhibition effect of the circle may depend nonmonotonically on its eccentricity. In the extreme periphery, the circle may be somewhat less effective than in less eccentric positions. In addition to reducing the amplitude of the RFE, the circular contour also diminished the number of physical complaints reported by the subjects. For example, the number of sessions with reports of dizziness decreased by 38%, from 13 to 8, when the circle was present. Also, any occurrence of vection was totally eliminated by the presence of the circle. Consequently, a circular contour placed in the visual periphery may provide a means of suppressing motion-sickness symptoms that may arise from certain visual-vestibular conflicts (Ebenholtz & Utrie, 1983). At the very least, a surrounding circle will suppress both static and low-velocity kinetic visual often-
313
tation information, which may otherwise produce changes in apparent self-orientation and perceived verticality. REFERENCES BRANDT, Try., DICHGANS, J., & KOENIG,
E. (1973). Differential effects
of central vs peripheral vision on egocentric and exocentric motion perception. Experimental Brain Research, 16, 476-491. DICHGANS, J., & BRANDa’, TH. (1978). Visual-vestibular
interactions: Effects on self-motion perception and postural control. In R. Held, H. Leibowitz, & H.-L. Teuber (Eds.), Handbook of sensory physiology: Vol. VIIL Perception (FP. 755-807). New York: Springer-Verlag. DtCHGAr~S, J., HELD, R., YOUr~G, L. R., & BRAUOT, TH. (1972). Moving visual scenes influence the apparent direction of gravtty. Sctence, 138, 1217-1219. DICHGANS, J., MAURITZ, K. H., ALLUM, J. H. J., & BRANDT, TH. (1976). Postural sway in normals and atactic patients: Analysts of the
stabilizing effects of vision. Agressologie, 17, 15-24. EBENHOLTZ, S. M. (1970). Perception of the vertical with body tilt in the median plane. Journal of Experimental Psychology, 83, 1-8. EBENr~OLTZ, S. M. (1977). Determinants of the rod and frame effect: The role of retinal size. Perception & Psychophysics, 22, 531-538. EBENHOLTZ, S. M. (1985a). Absence of relational determination in the
rod-and-frame effect. Perception & Psychophysics, 37, 303-306, EBENHOLTZ, S. M. (1985b). Depth separation fails to modulate the orientation-inhibition effect. Perception & Psychophysics, 37, 533-535. EBENHOLTZ, S. M., & BENZSCHAWEL, T. L. (1977). The rod and frame
effect and induced head tilt as a function of observation dtstance. Perception & Psychophysics, 22, 491-496. EBEU~OLTZ, S. M., & CALLAN, J. W. (1980). Modulation of the rod-
and-frame effect: Retinal angle vs apparent size. Psychological Research, 42, 327-334.
EBEm~OLTZ, S. M., & GL~SER, G. W. (1982). Absence of depth processing in large-frame red-and-frame effect. Perception & Psychophysics, 32, 134-140.
EBEm~OLTZ, S. M., & UTmE, J. W., JR. (1982). Inhibition of the rodand-frame effect by circular contours. Perceptton & Psychophysics,
32, 199-200. EI~EmtOLTZ, S. M., a, UTmE, J. W., JR. (1983). Peripheral ctrcular
contours inhibit the visual orientation control system. Avian’on, Space, & Environmental Medicine, 54, 343-346. FRANK, L. H., & CASALI, J. G. (1986). Simulator sickness: A review of its costs, countermeasures, and prediction (Tech. Paper
No. 861782). Warrendale, PA: Society of Automotive Engineers. HELD, R., DICHGANS, J., & BAUER, J. 0975). Characteristics of moving visual scenes influencing spatial orientation. Visual Research, 15,
357-365. L~,CKNER, J. R., & GRAYmEL, A. (1979). Some influences of vision
on susceptibi/ity to motion sickness. Aviation, Space, & Environmental Medicine, 50, 1122-1125. LEIBOW~TZ, R. W., & POST, R. B. (1982). The two modes of processing concept and some implications. In J. J. Beck (Ed.), Organization and representation in perception (pp. 343-363). Hillsdale, NJ: Eribaum. LESTmNUE, F., SOECrIT~G, J., & BERTHOZ, A. (1977). Postural readjustments induced by linear motion of visual scenes. Experimental Brain Research, 28, 363-384. M^vmxz, K. H., D~cn~^us, J., & HuvscnmOT, A. (1977). The an-
gle of visual roll motion determines displacement of subjective visual vertical. Perception & Psychophysics, 22, 557-562. O~tnn, C. (1984). Why do astronauts suffer space sickness? New Scientist~ 8, 10-13. S~iAr~, E., GOOOEnou~n, D, R., & FL~,~Nn~,U, M. (1978). Subjective estimates of body tilt and the rod-and-frame test. Perceptual & Motor Skills, 47, 1051-1056. Stfmns, E., GoooEr~ooGr~, D. R., & FLAr~rCAGnr~, M. (1979). Instructions, illusory self-tilt, and the rod-and-frame test. Quarterly Journal of Experimental Psychology, 31, 155-165.
314
BABLER AND EBENHOLTZ
STREIBEL, M. J , BARNES, R, D, JULNESS,
G. D., ,~ EBENHOLTZ, S. M. 2. It may be sigmficant that the data, wfuch were always taken on (1980). Determinants of the rod-and-frame effect: Role of orgamza- the last 10 cycles, happened not to be taken dunng the cycles an which uon and subjectwe contour Perception & Psychophysics, 27, 136-140. vection actually was experienced, although the illusion amplitudes for WITKIN, H A., ~ ASCH, S. E. (1948). Studies an space onentaUon: vection and nonvecuon cycles appear not to differ. IV Further experiments on perceptions of the upright wath displaced 3 The greater phase lag found for illusory conditions over that asvtsual fields. Journal of Experimental Psychology, 38, 762-782. socaated wath real line movement may simply reflect the larger number YOUNG, L G , OMAN, C. M., WATT, D. G. D., MONEY, K. E., & of syt~apses entailed in orientat~ou control via the periphery relative to L~Cr~TENBER~, B. K. (1984) Spatial orientation in weaghtlessness and the foveal and parafoveal retina. readaptatton to Earth’s gravity. Science, 225, 205-208. NOTES 1 Several subjects showed evidence of reflexave head-righting, in that head movements were made in phase with the frame. These data awaat further analysis.
(Manuscript received December 14, 1987, revision accepted for publication October 3, 1988.)