APPLIED AND ENVIRONMENTAL MICROBIOLOGY, Mar. 1999, p. 1117–1126 0099-2240/99/$04.0010 Copyright © 1999, American Society for Microbiology. All Rights Reserved.
Vol. 65, No. 3
Effects of Salinity and Temperature on Long-Term Survival of the Eel Pathogen Vibrio vulnificus Biotype 2 (Serovar E) ESTER MARCO-NOALES, ELENA G. BIOSCA,
AND
CARMEN AMARO*
Departamento de Microbiologı´a, Universidad de Valencia, E-46100 Burjassot, Valencia, Spain Received 7 October 1998/Accepted 22 December 1998
Vibrio vulnificus biotype 2 (serovar E) is a primary eel pathogen. In this study, we performed long-term survival experiments to investigate whether the aquatic ecosystem can be a reservoir for this bacterium. We have used microcosms containing water of different salinities (ranging from 0.3 to 3.8%) maintained at three temperatures (12, 25, and 30°C). Temperature and salinity significantly affected long-term survival: (i) the optimal salinity for survival was 1.5%; (ii) lower salinities reduced survival, although they were nonlethal; and (ii) the optimal temperature for survival was dependent on the salinity (25°C for microcosms at 0.3 and 0.5% and 12°C for microcosms at 1.5 to 3.8%). In the absence of salts, culturability dropped to zero in a few days, without evidence of cellular lysis. Under optimal conditions of salinity and temperature, the bacterium was able to survive in the free-living form for at least 3 years. The presence of a capsule on the bacterial cell seemed to confer an advantage, since the long-term survival rate of opaque variants was significantly higher than that of translucent ones. Long-term-starved cells maintained their infectivity for eels (as determined by both intraperitoneal and immersion challenges) and mice. Examination under the microscope showed that (i) the capsule was maintained, (ii) the cell size decreased, (iii) the rod shape changed to coccuslike along the time of starvation, and (iv) membrane vesicles and extracellular material were occasionally produced. In conclusion, V. vulnificus biotype 2 follows a survival strategy similar to that of biotype 1 of this species in response to starvation conditions in water. Moreover, the aquatic ecosystem is one of its reservoirs. Vibrio vulnificus is a bacterial species that includes strains which are virulent for humans and aquatic animals (35, 43, 44). Classically, the strains have been grouped into two biotypes (44): biotype 1, an autochthonous member of the aquatic ecosystem with environmental (mainly from marine waters and oysters) and clinical isolates (35, 41), and biotype 2, an obligate eel pathogen rarely found away from its natural host (7, 19, 44). The latter biotype produces in the eel a hemorrhagic septicemia called vibriosis (7). Our studies on biotype 2 strains suggest that they have a common clonal origin and that they constitute a homogeneous serological group, serovar E (9, 13). This serovar is defined by the possession of a heterogeneous lipopolysaccharide which has an essential role in establishing infection, as evidenced by its conferring resistance to eel serum (3, 13). In addition, we have recently reported that serovar E V. vulnificus is heterogeneous, being composed of one eel-pathogenic group (biotype 2 strains) and one nonpathogenic group formed by environmental isolates that are avirulent because they lack the portion of lipopolysaccharide with the highest molecular weight (4). Studies carried out by our research team have demonstrated that strains virulent for eels (i) can also be virulent for humans (1), (ii) can survive in artificial seawater at 25°C for at least 50 days (10, 27), (iii) are able to infect eels through water (2), and (iv) have an infective capability that depends on salinity, temperature, and the presence of a capsule on the bacterial cell (2). All of these findings suggest that this biotype is an opportunistic pathogen (primary for eels and secondary for humans) whose main reservoir could be the marine and estuarine ecosystem, as is the case for biotype 1. Biotype 2 strains have been isolated mainly from diseased
eels (8, 44) and occasionally from clinical samples (1, 4, 9). Clinical cases have been correlated with infection after handling of contaminated eels (45). In fact, the only case in which this biotype was isolated from water samples was at a site commonly used for eel fishing in Denmark (19). It is obvious that eels can act as carriers. Nevertheless, its characterization as a highly virulent primary pathogen (50% lethal dose for eels, ca. 101 to 103 CFU/fish) suggests that V. vulnificus biotype 2 is a new pathogen that has not yet established a balanced relationship with its host. Our hypothesis is that these strains inhabit aquatic environments as free-living cells or in association with organisms and inanimate surfaces. From these locations, cells could eventually pass to eels, in which they would multiply following the development of vibriosis, and would then return to water. Survivors and immunized eels could act as carriers. In fact, by using enzyme-linked immunoabsorbent assays (ELISAs), we have confirmed the presence of this biotype/serovar in healthy eels from a fish farm that had previously registered several epizootic outbreaks (12). One of the experimental approaches used to demonstrate that the natural niche of a bacterium is the aquatic ecosystem is to perform a long-term survival study in water microcosms. Oligotrophic conditions are normal in aquatic environments (29, 30), and native bacteria need to develop adaptation strategies that allow them to survive (e.g., no growth, no reproduction, low metabolic rate, reduction in size, morphological changes, or synthesis of specific proteins) (14, 21, 24, 31, 33, 39, 42). Further, some species develop the so-called viable-butnonculturable (VBNC) state in response to certain conditions, such as low temperatures (below 4°C) (10, 21, 38–40). This state was demonstrated first in V. vulnificus biotype 1 (39) and subsequently in strains virulent for eels (10). According to our hypothesis, V. vulnificus biotype 2 should be adapted to and survive for a long time under starvation conditions. To this end, we have performed survival experiments at salinities and temperatures that reproduce the natural conditions of our
* Corresponding author. Mailing address: Dpto. de Microbiologı´a, Universidad de Valencia, Av. Dr. Moliner, 50, E-46100 Burjassot, Valencia, Spain. Phone: (6) 398 31 04. Fax: (6) 386 43 72. E-mail:
[email protected]. 1117
1118
MARCO-NOALES ET AL.
geographical area (including the ones adopted by fish farms), we have analyzed the survival data, and we have studied the cell morphological changes by scanning electron microscopy. Finally, since V. vulnificus biotype 2 is a pathogenic bacterium, we have studied the ability of long-term-starved cells to infect eels and mice (an animal model used to test virulence potential for humans) to assess the environmental health hazard posed by this bacterium. MATERIALS AND METHODS Bacterial strains and growth conditions. Three strains of V. vulnificus biotype 2, representative of different epizootic events, were used in this study. All of them were recovered from internal organs of diseased European eels in Spain. These strains were isolated during epizootic processes that affected eels maintained at 25°C in water of 1.7% salinity (strains E22 and E86) or 0.3% salinity (strain E105). Opaque (encapsulated) and translucent (noncapsulated) variants of strain E22 (11) were used to study the role of the capsule in long-term survival. This was determined by inoculating the opaque variant of strain E22 (E22O) and the translucent one (E22T) into different microcosms. In these experiments, the colonial morphology on agar plates was monitored. Strains were maintained as lyophilized stocks at room temperature. Cells were grown to stationary phase in modified salt water-yeast extract (MSWYE) broth (37) at room temperature (25°C) with shaking. The size of the inoculum was determined by both the optical density at 610 nm (0.4 to 0.6) and the CFU per milliliter on MSWYE agar. The minimum salinity for growth was determined in triplicate tubes of MSWYE broth adjusted to 0, 0.1, 0.2, 0.3, and 0.5% (wt/vol). The tubes were incubated with agitation at room temperature and were examined for turbidity after 48 to 72 h. Preparation of microcosms. Loosely capped Erlenmeyer flasks (250 ml) and screw-cap glass bottles (500 ml), previously cleaned with acid dichromate and rinsed with distilled water, were half-filled with distilled water (for microcosms of 0% salinity), artificial seawater (ASW) (46) (for microcosms of 3.8% salinity), or diluted ASW (for microcosms of 0.3, 0.5, 1.5, or 3% salinity) and sterilized. Microcosms were directly inoculated with stationary-phase MSWYE broth cultures to a final concentration of 0.5% (vol/vol). To control the effect of salt transferred with the inoculum on survival in microcosms of 0% salinity, some of them were inoculated with cells washed by centrifugation and resuspended in distilled water. All microcosms were incubated in a static state at three temperatures: 30 and 12°C, the extreme temperatures close to those registered in summer and winter, respectively, in our coastal area, and 25°C, the temperature at which eels are cultured at the fish farm at which the epizootic outbreaks took place. The experiments were performed in duplicate or triplicate, and some of them were prolonged for a total period of 3 years. Enumeration techniques. Microcosms were sampled daily during the first week, weekly during the first 3 months, and then once a month. Time zero (inoculation time) and subsequent samples were taken for plate counts, most-probable-number (MPN) determinations, total direct cell counts, and direct viable counts (DVCs). Plate counts of culturable cells were determined by the drop plate method (17), using MSWYE agar and MSWYE agar adjusted to the salinity of the sampled flask (MSWYEA agar). The plates were incubated at room temperature until the number of colonies was counted (24 to 48 h). To analyze injury to starved cells, some counts were determined in parallel on deoxycholate lactose agar, a medium that does not allow growth of damaged cells (6). The MPN method was used for counting when plate counts were under 1 CFU/ml. MPN determinations were performed by the three-tube series test, with each tube containing 10 ml of tryptic soy broth or MSWYE broth. Volumes of 1, 0.1, or 0.01 ml of microcosm (depending on the series) were placed in MPN tubes, which were examined for turbidity after 24 to 48 h of incubation. Total cell counts were monitored by the acridine orange epifluorescence method (acridine orange direct count [AODC]) as described by Oliver (34). A series of preliminary experiments was undertaken to examine the accuracy of two procedures for determination of cell viability—(i) the direct viable count (DVC) method of Kogure et al. (25), adapted for V. vulnificus biotype 2 by Biosca et al. (10); and (ii) the p-iodonitrotetrazolium violet (INT) method (47)—by assessing two incubation periods, 20 min and 1 h. After fixation with formalin and staining with a 0.1% acridine orange solution (34), a known volume of cells was filtered onto a black 0.2-mm-pore-size polycarbonate filter (Millipore Corp., Bedford, Mass.). Cells were examined at a magnification of 31,250 with a Zeiss epifluorescence microscope, employing blue-light excitation and a 515-nm filter. With the first method, elongated and enlarged cells are counted as viable cells, whereas with the second, viable cells are identified by the formation of a red precipitate on the membrane due to the formation of insoluble INTformazan. The DVC method worked correctly with all samples, although with it we observed a greater degree of elongation at the highest salinities. With the INT method, we could not clearly detect precipitation, even on the biggest cells, which probably led to an underestimation of the viable-cell population. The same problem was found by Oliver and Wanucha (40) in their work with V. vulnificus
APPL. ENVIRON. MICROBIOL. biotype 1. Thus, we selected the DVC method to analyze all samples throughout the study. Experiments to recover nonculturable cells. When the concentration of culturable cells was below the detection limit (1 CFU/ml), “resuscitation” of the nonculturable cells was attempted. The nonculturable state was reached only in the absence of salts. In these cases, a sample of the microcosm was inoculated (final concentration, 1% [vol/vol]) into three new microcosms: one containing distilled water plus nutrients (yeast extract, 0.01% [vol/vol]; peptone, 0.01% [vol/vol]), one consisting of ASW at 0.3% salinity, and one with ASW at 0.3% salinity plus nutrients. Ten samples were taken from each microcosm and were processed for enumeration by plate counting and the MPN method. Serological analysis. A volume of 10 ml of each microcosm was centrifuged (9,000 3 g for 1 h at 4°C), and the cells were resuspended in 1 ml of saline solution (SS; 0.9% NaCl, pH 7.0). Microagglutination and enzyme-linked immunosorbent assay were used as described previously (12) to analyze the antigenicity of starved whole cells. Two antisera were used: one raised against starved cells, and another raised against culturable cells. All sera were obtained by previously described methods (3). Capsule staining. The maintenance of the capsule on the cell surface of long-term-starved cells was analyzed by optical microscopy. Capsules were first stabilized with lysine (50 mM) or with antibodies (1:10 dilution in SS) (a modification of the procedure of Jacques et al. [20]), and then the procedure of Hiss (16) was applied. Scanning electron microscopy. Bacteria from the different microcosms and from a rich laboratory medium (as a control) were harvested by filtration through 0.2-mm-pore-size polycarbonate filters. They were fixed with 2.5% (vol/vol) glutaraldehyde in 0.1 M phosphate buffer (pH 7.5) at room temperature for 2 h and then postfixed in 1% osmium tetroxide for another 2 h. After being washed in distilled water (three times, 10 min each), samples were dehydrated in a graded alcohol series (30, 50, and 70% for 5 min each and then 100% for 20 min) and critical-point dried in CO2 in a Tousimis Autosamdri model 814 critical point dryer. Finally, filters were coated with AuPd in a Bio-Rad model E5600 sputtering apparatus for examination with a Hitachi H-4100 scanning electron FE microscope at 5 to 10 kV of accelerating potential. Micrographs were made with Agfapan ISO100 film. Virulence assays. The virulence potential of starved cells for humans and eels was tested by using BALB/c mice (average weight, 20 g; 5 to 6 weeks old) and juvenile European eels (elvers; average weight, 3 to 10 g). Groups of six animals were used in each experiment. (i) Assays with elvers. Virulence assays with elvers were performed in tanks containing 6 liters of saline water maintained at 25°C. Bacteria were administered both intraperitoneally (i.p.) and by immersion challenge. In the first case, a volume of 0.1 ml of each microcosm was i.p. injected into elvers weighing 8 to 10 g. In the second case, elvers weighing 3 to 4 g were immersed directly into flasks containing 1-liter volumes from each microcosm. Elvers were maintained in the flasks with aeration. Mortality was recorded daily during a 7-day period and was only considered such if the bacterium was reisolated as a pure culture from internal organs. Percent mortality at the end of the experiments was recorded. (ii) Assays with mice. A 0.2-ml volume of each microcosm was inoculated i.p. into Desferal-pretreated and nonpretreated mice. Treatment with deferrioxamine B mesylate (Desferal; Sigma) was performed because the virulence of V. vulnificus is markedly increased when serum contains this substance (a hydroxamate-type siderophore that promotes growth in the serum) (7). For this purpose, mice were injected with Desferal (250 mg/g of body weight) 2 h before the inoculation of the bacterium. Appropriate controls for each experiment were also included (i.e., mice and elvers were inoculated with SS; elvers were immersed in water at the salinity of each microcosm, and elvers were challenged with log-phase cells). Experimental design and statistical analysis. Two or three microcosms per treatment and three samples per microcosm were selected for plate, total cell, and viable-cell counts daily during the first week and then once a week. Culturable-cell counts from duplicate or triplicate experiments were processed for variance analysis by using the procedure of the general lineal model with repeated measures available in the SPSS package.
RESULTS Efficiency of MSWYE and MSWYEA agar media for recovery of culturable cells. Microcosms at salinities of 0.3, 0.5, and 1.5% (all at 25°C) were employed to assess whether differences in salinity between microcosm and plate count medium affected growth. Cell counts performed in parallel on MSWYE and MSWYEA agar media were recorded and statistically analyzed for a medium effect (two replicates at 0.3%, three at 0.5%, and three at 1.5% salinity). The results obtained confirmed that there were no significant differences (Table 1). Thus, MSWYE was selected for performance of culturable-cell counts in the rest of the experiments.
LONG-TERM SURVIVAL OF V. VULNIFICUS BIOTYPE 2
VOL. 65, 1999 TABLE 1. Results of the different variance tests performed Effect
DFa
MSb
F-Snedecorc
Sig. Fd
Medium Strain Salinity Temp Capsule
1 2 1 2 1
1.051 2.19 1.237 3.261 53.541
0.585 2.6 6.817 36.5 16.461
0.457 0.168 0.040 0.008 0.015
a
DF, degrees of freedom. MS, mean square. F-Snedecor, value of the test for each effect. d Sig. F, significance (P value) of F-Snedecor. b c
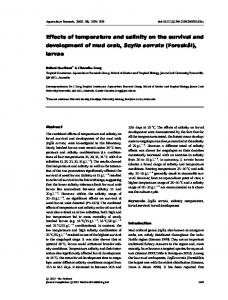
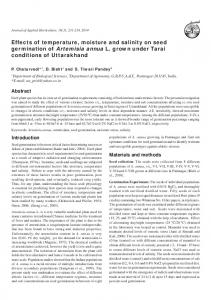
Long-term survival. (i) General comments. Results of longterm survival experiments at 0.3 and 1.5% salinity and 25°C are shown in Fig. 1. The microcosms simulated the physicochemical conditions of temperature and salinity recorded at the fish farm during the epizootic outbreaks. All strains survived in the culturable state for a period of 5 months. It is remarkable that a salinity of 0.3% was nonlethal for V. vulnificus biotype 2. In fact, we had estimated that the lowest salinity value that allowed growth in culture medium was 0.1% (data not shown). In all experiments, the total number of cells remained approximately at the level of the initial inoculum, with a slight decrease over time. There were differences between AODC and DVC counts; this was especially evident for microcosms of 0.3% salinity. Moreover, there were differences between DVC and plate counts in all experiments, particularly in those performed at a low salinity. A trait common to most curves was a decrease in the number of culturable cells from time zero. (ii) Influence of strain, salinity, and temperature. When culturable counts of the different strains (three replicates per strain) were compared and analyzed, there were no significant differences between the strains isolated from microcosms with salinities of 1.5% (E22 and E86) and 0.3% (E105) (Table 1). Since no special adaptation of the strains to moderate- or lowsalinity conditions seemed to exist, we selected one of them (E22) to test other salinities (0.5, 3, and 3.8%) at the same temperature (Fig. 2). As in the previous experiments, (i) total counts remained almost constant throughout; (ii) there were differences between AODC and DVC counts, specially at low salinities; and (iii) there was an appreciable decrease in the number of culturable cells throughout the incubation period. AODC, DVC, and culturable counts from microcosms of 0.5% salinity exhibited a time course similar to that observed in microcosms of 0.3% salinity. The same was found for microcosms of 3 and 3.8% with respect to microcosms of 1.5% salinity. In addition, the time course of culturability was different in moderate-salinity (1.5 to 3.8%) and in low-salinity (0.3 and 0.5%) microcosms. Thus, after 1 year, the percent survival oscillated between 0.2 and 1.2% (2.4 3 104 to 8.8 3 104 CFU/ml) in moderate-salinity microcosms and between 0.001 and 0.007% (6 3 102 to 6.7 3 102 CFU/ml) in low-salinity microcosms. After 2 and 3 years of starvation, the percent survival in moderate-salinity microcosms was 0.01 to 0.1% (4 3 102 to 7.7 3 103 CFU/ml). At that time, no cells were recovered from the microcosms of 0.3 and 0.5% salinity. Therefore, there seemed to be salinity-dependent differences between microcosms which were statistically confirmed (four replicates per case, each case grouping data from low- or moderatesalinity microcosms) (Table 1). The culturable counts at 0% salinity dropped below the detection limits during the first month (Fig. 3). MPN counts performed in parallel confirmed this observation, although they dropped more slowly than plate counts (data not shown).
1119
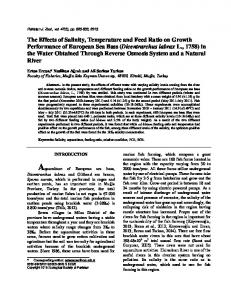
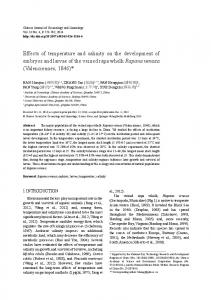
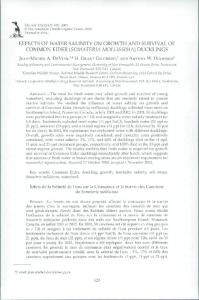
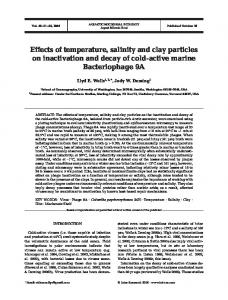
Some variability was found from experiment to experiment regardless of the inoculum used (i.e., directly from an MSWYE broth culture or after being washed and resuspended in distilled water). The results of two experiments are presented in Fig. 3. AODC counts remained fairly constant throughout the study, and DVC counts, despite decreasing over the first 4 days, also remained nearly constant thereafter (Fig. 3). Several attempts to resuscitate nonculturable cells were performed to investigate whether these cells were in a VBNC state. After addition of salts, nutrients, or both salts and nutrients to the medium, no cells were recovered by plating on agar or by seeding in liquid medium. Some evidence of cell damage was obtained by comparing nonselective- and selective-medium plate counts. In the absence of salts, cells were not able to grow on the medium with sodium deoxycholate, even at time zero. This result implies that the cells were in a deeply injured state (6). The survival of V. vulnificus biotype 2 was dependent on temperature (Fig. 4), since there were statistical differences in the responses of the strain at the different temperatures employed (two replicates of each case) (Table 1). Moreover, the optimal temperature for survival was dependent on salinity; it was 25 to 30°C for low-salinity microcosms and 12°C for moderate-salinity microcosms (in this case, with a percent survival of around 1% after 5 months) (Fig. 4). For example, at 3.8% salinity, the survival rate after 10 months at 12°C was between 50 and 25 times higher (1.3%) than that at 25°C (0.02%) or 30°C (0.05%), and at 1.5% salinity, the survival rate was about five times higher (0.7%) than that at 25°C (0.1%) or 30°C (0.2%). At low salinity, culturability at 12°C decreased below detection limits after 60 days (Fig. 4). (iii) Influence of the capsule. The influence of the capsule on starvation-survival at 25°C was studied by comparing survival curves of the opaque and translucent variants of the same strain. For these experiments we used strain E22, whose translucent variant is very stable and lacks appreciable capsular material as determined by electron microscopy (11). Results obtained at 3% salinity are shown in Fig. 5. Both variants survived in water, but the percent survival of the opaque variant was significantly higher than that of the translucent one (three replicates per case) (Table 1). This effect was observed in all assayed microcosms, regardless of the salinity (0.5, 1.5, or 3%). For example, the percent survival after 70 days was 2% for the opaque variant and 0.3% for the translucent one at a salinity of 3%, 14 and 0.6%, respectively, at a salinity of 1.5%, and 2.5 and 0.02%, respectively, at a salinity of 0.5%. Antigenic and morphological changes. (i) Serological analysis. Starved cells were recovered and used in antigenic assays. In microagglutination and ELISAs, all samples gave titers similar to those of nonstressed cells used as controls (Table 2). (ii) Cell morphology. Capsular material was observed in 2-year-starved cells by light-microscopic observation after capsule staining (data not shown). Observations under a scanning electron microscope were as follows. Cells from samples taken at time zero were rod shaped with a relatively smooth surface (Fig. 6A). The dimensions were 1.1 6 0.3 mm in length by 0.37 6 0.03 mm in width (means 6 standard deviations). After a few days (for microcosms at 0.3% salinity) or weeks (for microcosms at 1.5 to 3.8% salinity) of starvation in saline water, cells were predominantly spheroid (diameter, 0.77 6 0.15 mm) (Fig. 6B). There was a general tendency toward size reduction with starvation time, specially evident after 6 months of starvation, that affected both spheroids (0.50 6 0.02 mm) and rods (0.78 6 0.18 mm in length by 0.38 6 0.05 mm in width). After 2 years of starvation, cells from microcosms of 1.5 to 3.8% salinity maintained their integrity, and some of them
1120
MARCO-NOALES ET AL.
APPL. ENVIRON. MICROBIOL.
FIG. 1. Starvation-survival response of strains E22 (A and B), E105 (C and D), and E86 (E and F) in microcosms of 0.3% (A, C, and E) or 1.5% (B, D, and F) salinity maintained at 25°C. Shown are data from plate counts (‚) on MSWYE agar, direct viable counts obtained by the method of Kogure et al. (25) (h), and acridine orange direct counts (E). Each point represents the average of values from two different experiments.
VOL. 65, 1999
LONG-TERM SURVIVAL OF V. VULNIFICUS BIOTYPE 2
1121
FIG. 3. (A) Starvation-survival response of strain E22 in microcosms of 0% salinity maintained at 25°C. Shown are the results, from experiment 1 (——) and experiment 2 (– – –), of plate counts on MSWYE agar (Œ), direct viable counts obtained by the method of Kogure et al. (25) (■), and acridine orange direct counts (F). Each point represents the average of values from two different experiments. (B) Eel and mouse mortalities after the injection of 0.1 and 0.2 ml, respectively, of microcosm. Exp., experiment.
FIG. 2. Starvation-survival response of strain E22 in microcosms of 0.5% (A), 3% (B), or 3.8% (C) salinity maintained at 25°C. Shown are data from plate counts (‚) on MSWYE agar, direct viable counts obtained by the method of Kogure et al. (25) (h), and acridine orange direct counts (E). Each point represents the average of values from two different experiments.
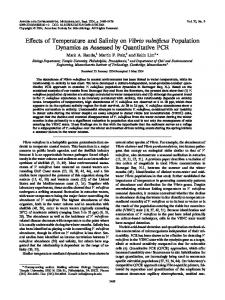
still kept their rod shape (Fig. 6C); however, only a few cells from microcosms of 0.3% salinity maintained their integrity (Fig. 6D). Cells from microcosms of 0% salinity became spheroids after a few days (diameter, 0.75 6 0.15 mm) (Fig. 6E). Most of them, although apparently maintaining their cellular integrity, as determined by light-microscopic observation, showed evidence of damage (Fig. 6F). These cells had a collapsed appearance or showed fissures in their envelopes (Fig. 6E and F). However, some of them maintained their integrity throughout the time of incubation. In all samples we observed blebs adherent to the cell surface, and these increased in number with starvation time (Fig. 6G). Occasionally, we detected an extracellular substance adhering to the cell surface in longterm-starved cells (Fig. 6H). This substance was extended into polymer-like filaments, and it was not observed in short-termstarved cells.
1122
MARCO-NOALES ET AL.
APPL. ENVIRON. MICROBIOL. TABLE 2. ELISA and microagglutination titers of starved and control (stationary-phase) cells Cells
Antigen
Control
Whole cell O antigen Whole cell O antigen
Starved
Titera ELISA
Microagglutination
50,000 50,000 12,000–30,000 17,000–32,000
128 256 256 256
a Two antisera were used: one against stationary-phase cells and another against starved cells.
experiment, performed with stationary-phase-grown cells (culturable count, 6.3 3 103 CFU/ml). Cells from microcosms of 0% salinity maintained their virulence while they were in the culturable state (Fig. 3). DISCUSSION V. vulnificus biotype 2 was able to survive under starvation conditions in ASW adjusted to different salinities and incubated at several temperatures. No significant difference, indicative of salt adaptation, was detected between strains isolated at low and moderate salinities. A trait common to most curves was that the number of culturable cells decreased from time zero. This means that there is not a general initial increase similar to that described by several authors as being the result of cell fragmentation (reductive division) (30). Thus, cell fragmentation would not appear to be a general survival strategy for this pathogen. In all microcosms, the number of culturable cells decreased with starvation time. This fact is in accordance with most long-term starvation-survival studies, in which less than 1% of a culture survives (32). A comparison of our survival curves with the starvation-survival patterns observed by Morita (30) reveals that V. vulnificus biotype 2 seems to follow a pattern intermediate between patterns C and D: there is no initial increase in culturable cell numbers, as occurs in pattern C; the decrease is not as rapid as in pattern D; and an approximately constant level of cells is reached and maintained over time, which happens in both patterns. In contrast, most of the marine bacteria, including marine vibrios, exhibit pattern C. In the microcosms of moderate salinities (1.5 to 3.8%), AODC, DVC, and culturable counts showed a short-term
FIG. 4. Percent survival of strain E22 in microcosms of 0.3% (A), 1.5% (B), or 3.8% (C) salinity maintained at 12°C (‚), 25°C (E), or 30°C (h). Each point represents the average of values from two different experiments.
Virulence. Cells from saline microcosms were able to infect eels by i.p. injection and by bath challenge, even after 2 years of starvation (Table 3). In all cases, starved cells presented a degree of virulence similar to that of the nonstarved cells used as controls (Table 3). Starved cells also retained their virulence for mice; e.g., cells from microcosms of 0.5% salinity with an average age of 10 months (culturable count, 1.5 3 102 to 2.5 3 102 CFU/ml) resulted in ca. 75% percent mortality in Desferalpretreated mice, compared to 100% mortality in the control
FIG. 5. Percent survival of culturable cells of the opaque (‚) and translucent (E) variants of strain E22 from microcosms of 3% salinity maintained at 25°C. Each point represents the average of values from two different experiments.
FIG. 6. Electron micrographs of control and starved cells. (A) Cells at time zero. (B) Cell from a microcosm at 0.3% salinity, after 7 days of starvation. (C) Cell from a microcosm of 3.8% salinity, after 2 years of starvation. (D) Sample from a microcosm of 0.3% salinity, after 2 years of starvation, showing cell debris and a single cell (marked by an arrow). (E) Sample from a microcosm of 0% salinity, after 7 days of starvation, showing collapsed cells. (F) Cell from a microcosm of 0% salinity, after 7 days of starvation, showing external fissures. (G) Sample from a microcosm of 3.8% salinity, after 7 months of starvation, showing one cell with two adherent vesicles and one liberated vesicle (marked by an arrow). (H) Cell from a microcosm of 3.8% salinity, after 1 year of starvation, showing adherent extracellular material. Millipore filters (A, B, E, and F) and Nuclepore filters (Nuclepore Corp., Pleasanton, Calif.) (C, D, G, and H) were used in these studies. Bars, 0.5 mm (A, B, C, F, G, and H) or 5 mm (D and E).
1123
1124
MARCO-NOALES ET AL.
APPL. ENVIRON. MICROBIOL.
TABLE 3. Mortality of elvers inoculated with starved cells and of controls Inoculated cellsa
Dose (CFU/ml)b
% Mortality
From microcosms 0.3%, 25°C (15) 0.5%, 25°C (7) 1.5%, 25°C (7) 1.5%, 25°C (24) 3.8%, 12°C (7) 3.8%, 25°C (7) 3.8%, 30°C (7) 3.8%, 30°C (8) 3.8%, 30°C (7)
1.5 3 103 1.7 3 103 2.6 3 104 1.6 3 104 1.1 3 105 7 3 103 1 3 104 9 3 103 4.3 3 103
100c 80c 100c 100d 80c 33c 33c 100d 50c
6.3 3 104 3.1 3 103 2.6 3 102
100d 80c 50c
Controlse
a Salinity and temperature of microcosms are shown. Values in parentheses are ages of cells (in months). b Culturable counts at the time of inoculation. c Determined by i.p. inoculation (0.1 ml/fish). d Determined by bath challenge. Bath salinity was that of the microcosm; for the controls, it was 1.5%. e Controls were inoculated with stationary-phase cells.
course similar to that described for biotype 1 of this species (22, 46). For example, the differences between DVC and culturable counts were similar to that reported by Wolf and Oliver for V. vulnificus biotype 1 as being representative of nonculturable subpopulations (46). In the aforementioned work, microcosms were maintained for only 1 month and the difference detected at that time was similar to that found in our study (around 1 log unit). However, we cannot compare the results obtained beyond the first month because no long-term survival study has been performed with biotype 1 of this species. The optimal salinity for survival of V. vulnificus biotype 2 was 1.5%, which is in accordance with field data on biotype 1 isolation (35) and with laboratory experiments performed with this biotype (22). It is remarkable that salinities below 0.5% were nonlethal in the short run for V. vulnificus biotype 2. Since experiments at such low salinity have not been performed on biotype 1, we could not compare our results with those obtained for this biotype. In contrast, salinities of 0.5 to 1% are lethal for some marine vibrios, such as V. anguillarum and V. salmonicida (18). We observed that the differences between DVC and culturable counts were greater in the low-salinity microcosms than in moderate-salinity microcosms. This could be indicative of an important subpopulation that lost its culturability upon osmotic shock. The optimal temperature for survival was dependent on salinity; it was 12°C for moderatesalinity microcosms and 25 to 30°C for low-salinity microcosms. We have previously reported that temperatures below 5°C induce the VBNC state in seawater (10). Thus, it seems probable that the sensitivity of V. vulnificus biotype 2 to low temperatures increases at low salinity. With regard to the experiments with moderate-salinity microcosms, similar results have been reported for V. vulnificus biotype 1 maintained under laboratory conditions (22). The combination of low salinity and a temperature of 12°C was not used in the aforementioned study, so our results concerning this topic cannot be compared. The overall data suggest that for the survival of V. vulnificus biotype 2 as a free-living form in water in the absence of nutrients, the optimal conditions are 1.5% salinity and 12°C (Fig. 1, 2, and 4). It is remarkable that the bacterium can survive in large numbers at temperatures which are below the
optimum for growth in culture media and for the spread of infection (ca. 25 to 30°C). However, survival may vary if nutrients or particulate material are added to microcosms. Experiments to study the effects of such additions are currently under way in our laboratory. In any event, our results with biotype 2 under laboratory conditions are similar to those obtained for biotype 1 (22, 36, 39). In this regard, several studies have reported that this biotype is not detectable in seawater at temperatures below 10 to 15°C (38), which apparently contradicts our results. Nevertheless, our experiments do not reproduce the natural environment exactly, given that the ASW microcosms only approximate natural conditions. In nature, other factors, as yet undetermined, may make the bacterium nonrecoverable at 12°C. For example, it has been observed that the survival of V. vulnificus biotype 1 in microcosms of natural seawater varies strongly depending on whether the seawater is sterilized (22). In general, bacterial cell numbers decrease to undetectable levels in nonsterilized water, which suggests that biological factors (such as bacteriophages or protozoa) may control the survival of bacteria in the environment (15). Experiments on survival in natural brackish water and seawater are now being conducted in our laboratory. Light microscopy confirmed that opaque starved cells maintained their capsules. This result is in agreement with that reported by Wolf and Oliver (46) for V. vulnificus biotype 1. In that case, the capsule was maintained even in the VBNC state. On the other hand, the capsule seems to play a role in longterm survival, since we observed that the percent survival of the opaque variant was significantly higher than that of the translucent one. This result is in apparent contradiction to our own previous study on the role of the capsule in the VBNC state (10). The latter study was performed at 4°C and 3.8% salinity for periods of up to 35 days. In the present work, the differences were particularly evident after 130 days (Fig. 5). Thus, it seems reasonable to theorize that these effects are only noticeable in long-term experiments. Since the capsule also increases adhesiveness to eel mucus and its presence favors survival in eel and human serum (2), this external envelope seems advantageous in that it allows the bacteria to withstand stress conditions and to colonize surfaces such as the epidermis of fish (2). Starved cells also maintained recognizable antigens on their surfaces, which means that it should be possible to detect cells by immunological methods in environmental samples even after an extended period of starvation. In fact, we have developed an ELISA capable of detecting cells in the nonculturable state (12), and we are developing an immunostaining method, which is currently being tested for reliability in our laboratory. Electron microscopy revealed that there was a general tendency toward a reduction in size and a shape change from rod to coccus with increased starvation time. These changes occurred faster in the low-salinity microcosms. The decrease in size and the tendency to spheroid forms are common traits of starved bacteria (5, 23, 32, 42). In fact, it has been proposed that size reduction during starvation is a survival strategy used to minimize cell maintenance requirements and enhance substrate uptake due to a high surface-to-volume ratio. This strategy seems to be adopted by V. vulnificus biotype 2. Similar findings have been reported for marine bacteria (32) and for V. vulnificus biotype 1 (39). After 2 years of starvation, cells maintained their integrity in moderate-salinity but not in lowsalinity microcosms, which may explain why we were not able to recover culturable cells at this time. It has been suggested that the process of size reduction can be accompanied by changes in the external surface of the bacterium: the appearance of bridge polymers that enhance
VOL. 65, 1999
adhesion (21), the development of fimbria-like appendices for cell-cell interactions (23, 42), increases in surface roughness (24, 26), and the formation of membrane vesicles (21, 23, 28, 42). It has also been suggested that these vesicles (blebs) can be formed by pieces of cell envelope as a strategy for cell size reduction (21). Since we observed blebs, which were increased in number with increased starvation time, we agree with Jiang and Chai (21) that blebs could be pieces of cell envelope formed to adjust cell volume. In addition, we observed an extracellular substance adherent to the cell surface. Similar findings have been described for V. parahaemolyticus, for which this extracellular matrix has been proposed to act as an adherence mechanism (21). In contrast, other investigators have suggested that these polymers could be dehydrated exopolysaccharides. As already mentioned, V. vulnificus produces a capsule of an exopolysaccharidic nature, so we cannot rule out this possibility. With respect to the experiments performed at 0% salinity, it is remarkable that V. vulnificus biotype 2 maintained cell integrity and viability (according to the criterion of Kogure et al. [25]), whereas it lost culturability in a few days. This result is in apparent contrast to that reported by Kaspar and Tamplin (22) for V. vulnificus biotype 1. In their work, bacterial lysis was suggested as the reason for the nonculturability in the absence of salts, but this hypothesis was not proven. We were unable to resuscitate nonculturable cells, so they apparently were not in the VBNC state. It is not surprising that the absence of salts represents a significant stress for most Vibrio species, given their natural habitat. Some evidence of cell damage was obtained from the studies of growth on selective medium. This was confirmed after the observation of starved cells by electron microscopy: cells from microcosms of 0% salinity appeared to be collapsed or to have fissures in their envelopes. The overall data suggest that although in the absence of salts cells can apparently maintain their cellular integrity and even their viability under controlled conditions (e.g., those of DVC counts by the method of Kogure et al. [25]), they are damaged enough to lose their culturability in a few days. Finally, starved cells maintained their ability to infect eels and humans, irrespective of the salinity-temperature combination and the age of the cells. Cells from microcosms of 0% salinity were virulent while they were in a culturable state. The ability to infect through water is indirect evidence that the cells retained their capsules, because nonencapsulated cells are avirulent (2). We did not find a relationship between the degree of virulence and the salinity-temperature conditions of the microcosm. The retention of virulence under conditions simulating those found in the aquatic environment is additional evidence supporting the hypothesis that water is one of the natural reservoirs of this pathogen. In summary, the overall data suggest that V. vulnificus biotype 2 has developed strategies that allow it to survive in saline water in the absence of nutrients and outside its natural host. Under these conditions, this bacterium can maintain its potential to infect fish and humans. Our results are in accordance with those obtained in similar studies performed with biotype 1 of this species, which is an autochthonous member of aquatic ecosystems. This means that V. vulnificus biotype 2 is an opportunistic pathogen (primary for eels and secondary for humans) whose main reservoir is probably the aquatic environment, where it can survive at different rates depending on salinity and temperature. From these environments, the bacterium could infect susceptible eels, multiply in them following the development of vibriosis, and be liberated in large numbers into the environment, where they would constitute a potential risk to human health. The scarcity of reports on its isolation
LONG-TERM SURVIVAL OF V. VULNIFICUS BIOTYPE 2
1125
from aquatic samples suggests that it is a minor serotype in water from which it can be successfully isolated after an epizootic event. ACKNOWLEDGMENTS This work was partially supported by the Comisio ´n Interministerial de Ciencia y Tecnologı´a (AGF95-1085-CO2-O1). E.M.-N. was awarded a predoctoral fellowship from the Consellerı´a de Cultura, Educacio ´n y Ciencia de la Generalidad Valenciana (Plan Valenciano de Ciencia y Tecnologia). We thank the Servicio de Microscopı´a Electro ´nica (Universidad de Valencia) for expert technical assistance; Rafael Ruano and Jose´ Tornero for supplying eels from the eel farm Polin ˜´a; Paco Montes for helping with the statistical analysis; Enrique Font for allowing the use of an epifluorescence microscope during part of the experimental work and for correcting the text, providing valuable comments; and Barraclough-Donnellan for help with the English language. We are also very grateful to James D. Oliver and Mark L. Tamplin for critical reading of the manuscript. REFERENCES 1. Amaro, C., and E. G. Biosca. 1996. Vibrio vulnificus biotype 2, pathogenic for eels, is also an opportunistic pathogen for humans. Appl. Environ. Microbiol. 62:1454–1457. 2. Amaro, C., E. G. Biosca, B. Fouz, E. Alcaide, and C. Esteve. 1995. Evidence that water transmits Vibrio vulnificus biotype 2 infections to eels. Appl. Environ. Microbiol. 61:1133–1137. 3. Amaro, C., E. G. Biosca, B. Fouz, and E. Garay. 1992. Electrophoretic analysis of heterogeneous lipopolysaccharides from various strains of Vibrio vulnificus biotypes 1 and 2 using silver staining and immunoblotting. Curr. Microbiol. 25:99–104. 4. Amaro, C., L.-I. Hor, E. Marco-Noales, T. Bosque, B. Fouz, and E. Alcaide. 1999. Isolation of Vibrio vulnificus serogroup E from aquatic habitats in Taiwan. Appl. Environ. Microbiol. 65:1356–1359. 5. Baker, R. M., F. L. Singleton, and M. A. Hood. 1983. Effects of nutrient deprivation on Vibrio cholerae. Appl. Environ. Microbiol. 46:930–940. 6. Beuchat, L. R. 1978. Injury and repair of gram-negative bacteria with special consideration of involvement of the cytoplasmic membrane. Adv. Appl. Microbiol. 23:219–243. 7. Biosca, E. G. 1994. Ph.D. thesis. Universidad de Valencia, Valencia, Spain. 8. Biosca, E. G., C. Amaro, C. Esteve, E. Alcaide, and E. Garay. 1991. First record of Vibrio vulnificus biotype 2 from diseased European eel, Anguilla anguilla L. J. Fish Dis. 14:103–109. 9. Biosca, E. G., C. Amaro, J. L. Larsen, and K. Pedersen. 1997. Phenotypic and genotypic characterization of Vibrio vulnificus: proposal for the substitution of the subspecific taxon biotype for serovar. Appl. Environ. Microbiol. 63:1460–1466. 10. Biosca, E. G., C. Amaro, E. Marco-Noales, and J. D. Oliver. 1996. Effect of low temperature on starvation-survival of the eel pathogen Vibrio vulnificus biotype 2. Appl. Environ. Microbiol. 62:450–455. 11. Biosca, E. G., H. Llorens, E. Garay, and C. Amaro. 1993. Presence of a capsule in Vibrio vulnificus biotype 2 and its relationship to virulence for eels. Infect. Immun. 61:1611–1618. 12. Biosca, E. G., E. Marco-Noales, C. Amaro, and E. Alcaide. 1997. An enzymelinked immunosorbent assay for detection of Vibrio vulnificus biotype 2: development and field studies. Appl. Environ. Microbiol. 63:537–542. 13. Biosca, E. G., J. D. Oliver, and C. Amaro. 1996. Phenotypic characterization of Vibrio vulnificus biotype 2, a lipopolysaccharide-based homogeneous O serogroup within Vibrio vulnificus. Appl. Environ. Microbiol. 62:918–927. 14. Colwell, R. R., I. T. Knight, C. Somerville, S. Shults, and C. W. Kaspar. 1989. Viable but nonculturable phenomenon in relationship to starvation/survival, “injury”, and strategies for survival of bacteria in the environment, p. 85–88. In T. Hattori, Y. Ishida, Y. Maruyama, R. Y. Morita, and A. Uchida (ed.), Recent advances in microbial ecology. Proceeding of the 5th International Symposium on Microbial Ecology. Japan Scientific Societies, Kyoto, Japan. 15. Gonza ´lez, J. M., J. Iriberri, L. Egea, and I. Barcina. 1992. Characterization of culturability, protistan grazing, and death of enteric bacteria in aquatic ecosystems. Appl. Environ. Microbiol. 58:998–1004. 16. Hiss, P. H., Jr. 1905. A contribution to the physiological differentiation of Pneumococcus and Streptococcus. J. Exp. Med. 6:317–345. 17. Hoben, H. J., and P. Somasegaran. 1982. Comparison of the pour, spread, and drop plate methods for enumeration of Rhizobium spp. in inoculants made from presterilized peat. Appl. Environ. Microbiol. 44:1246–1247. 18. Hoff, K. A. 1989. Survival of Vibrio anguillarum and Vibrio salmonicida at different salinities. Appl. Environ. Microbiol. 55:1775–1786. 19. Høi, L., A. Dalsgaard, J. L. Larsen, J. M. Warner, and J. D. Oliver. 1997. Comparison of ribotyping and randomly amplified polymorphic DNA PCR for characterization of Vibrio vulnificus. Appl. Environ. Microbiol. 63:1674– 1678.
1126
MARCO-NOALES ET AL.
20. Jacques, M., M. Gottschalk, B. Foiry, and R. Higgins. 1990. Ultrastructural study of surface components of Streptococcus suis. J. Bacteriol. 172:2833– 2838. 21. Jiang, X., and T.-J. Chai. 1996. Survival of Vibrio parahaemolyticus at low temperatures under starvation conditions and subsequent resuscitation of viable, nonculturable cells. Appl. Environ. Microbiol. 62:1300–1305. 22. Kaspar, C. W., and M. L. Tamplin. 1993. Effects of temperature and salinity on the survival of Vibrio vulnificus in seawater and shellfish. Appl. Environ. Microbiol. 59:2425–2429. 23. Kjelleberg, S., M. Hermansson, and P. Mårde´n. 1987. The transient phase between growth and nongrowth of heterotrophic bacteria, with emphasis on the marine environment. Annu. Rev. Microbiol. 41:25–49. ¨ stling, L. Holmquist, K. Fla 24. Kjelleberg, S., J. O ¨rdh, B. Svenblad, A. JouperJaan, D. Weichart, and N. Albertson. 1993. Starvation and recovery of Vibrio, p. 169–174. In R. Guerrero and C. Pedro ´s-Alio ´ (ed.), Trends in microbial ecology. Spanish Society for Microbiology, Barcelona, Spain. 25. Kogure, K., U. Simidu, and N. Taga. 1979. A tentative direct microscopic method for counting living marine bacteria. Can. J. Microbiol. 25:415–420. 26. Kondo, K., A. Takade, and K. Amako. 1994. Morphology of the viable but nonculturable Vibrio cholerae as determined by the freeze fixation technique. FEMS Microbiol. Lett. 123:179–184. 27. Marco-Noales, E., E. G. Biosca, and C. Amaro. 1995. Long-term survival of Vibrio vulnificus biotype 2 at different salinities, p. 75. In Abstracts of the 7th International Conference on Diseases of Fish and Shellfish. European Association of Fish Pathologists, Palma de Mallorca, Spain. 28. Mårde´n, P., A. Tunlid, K. Malmcrona-Friberg, G. Odham, and S. Kjelleberg. 1985. Physiological and morphological changes during short term starvation of marine bacterial isolates. Arch. Microbiol. 142:326–332. 29. Moriarty, D. J. W., and R. T. Bell. 1993. Bacterial growth and starvation in aquatic environments, p. 25–53. In S. Kjelleberg (ed.), Starvation in bacteria. Plenum Press, New York, N.Y. 30. Morita, R. Y. 1985. Starvation and miniaturisation of heterotrophs, with special emphasis on maintenance of the starved viable state, p. 111–130. In M. M. Fletcher and G. D. Floodgate (ed.), Bacteria in their natural environment. Academic Press, Inc., London, United Kingdom. 31. Morita, R. Y. 1990. The starvation-survival state of microorganisms in nature and its relationship to the bioavailable energy. Experientia 46:813–817. 32. Morita, R. Y. 1993. Bioavailability of energy and the starvation state, p. 1–23. In S. Kjelleberg (ed.), Starvation in bacteria. Plenum Press, New York, N.Y. 33. Morton, D. S., and J. D. Oliver. 1994. Induction of carbon starvation-induced
APPL. ENVIRON. MICROBIOL. proteins in Vibrio vulnificus. Appl. Environ. Microbiol. 60:3653–3659. 34. Oliver, J. D. 1987. Heterotrophic bacterial populations of the Black Sea. Biol. Oceanogr. 4:83–97. 35. Oliver, J. D. 1989. Vibrio vulnificus, p. 570–600. In M. P. Doyle (ed.), Foodborne bacterial pathogens. Marcel Dekker, Inc., New York, N.Y. 36. Oliver, J. D. 1993. Formation of viable but nonculturable cells, p. 239–272. In S. Kjellerberg (ed.), Starvation in bacteria. Plenum Press, New York, N.Y. 37. Oliver, J. D., and R. R. Colwell. 1973. Extractable lipids of gram-negative marine bacteria: phospholipid composition. J. Bacteriol. 114:897–908. 38. Oliver, J. D., F. Hite, D. McDougald, N. L. Andon, and L. M. Simpson. 1995. Entry into, and resuscitation from, the viable but nonculturable state by Vibrio vulnificus in an estuarine environment. Appl. Environ. Microbiol. 61: 2624–2630. 39. Oliver, J. D., L. Nilsson, and S. Kjelleberg. 1991. Formation of nonculturable Vibrio vulnificus cells and its relationship to the starvation state. Appl. Environ. Microbiol. 57:2640–2644. 40. Oliver, J. D., and D. Wanucha. 1989. Survival of Vibrio vulnificus at reduced temperatures and elevated nutrient. J. Food Saf. 10:79–86. 41. Oliver, J. D., R. A. Warner, and D. R. Cleland. 1982. Distribution and ecology of Vibrio vulnificus and other lactose-fermenting marine vibrios in coastal waters of the southeastern United States. Appl. Environ. Microbiol. 44:1404–1414. ¨ stling, J., L. Holmquist, K. Fla 42. O ¨rdh, B. Svenblad, A. Jouper-Jaan, and S. Kjelleberg. 1993. Starvation and recovery of Vibrio, p. 103–127. In S. Kjelleberg (ed.), Starvation in bacteria. Plenum Press, New York, N.Y. 43. Song, Y.-L., W. Cheng, C.-H. Shen, Y.-C. Ou, and H.-B. Song. 1990. Occurrence of Vibrio vulnificus in cultured shrimp and eel in Taiwan. NSC Symp. Ser. 16:172–179. 44. Tison, D. L., M. Nishibuchi, J. D. Greenwood, and R. J. Seidler. 1982. Vibrio vulnificus biogroup 2: new biogroup pathogenic for eels. Appl. Environ. Microbiol. 44:640–646. 45. Veenstra, J., J. P. G. M. Rietra, J. M. Coster, C. P. Stoutenbeek, E. A. Ter Laak, O. L. M. Haenen, H. H. W. De Hier, and S. Dirsks-Go. 1993. Human Vibrio vulnificus infections and environmental isolates in The Netherlands. Aquacult. Fish. Manag. 24:119–122. 46. Wolf, P. W., and J. D. Oliver. 1992. Temperature effects on the viable but nonculturable state of Vibrio vulnificus. FEMS Microbiol. Ecol. 101:33–39. 47. Zimmermann, R., R. Iturriaga, and J. Becker-Birck. 1978. Simultaneous determination of the total number of aquatic bacteria and the number thereof involved in respiration. Appl. Environ. Microbiol. 36:926–935.