Effects of sampling methods on web accessibility evaluations Giorgio Brajnik and Andrea Mulas and Claudia Pitton Dipartimento di Matematica e Informatica — Università di Udine Via delle Scienze, 206 — 33100 Udine — Italy
[email protected],
[email protected],
[email protected] ABSTRACT Except for trivial cases, any accessibility evaluation has to be based on some method for selecting pages to be analyzed. But this selection process may bias the evaluation. Up to know, not much is known about available selection methods, and about their effectiveness and efficiency. The paper addresses the following open issues: how to define the quality of the selection process, which processes are better than others, how to measure their difference in quality, which factors may affect quality (type of assessment, size of the page pool, structural features of the web site). These issues are investigated through an experimental evaluation of thirteen sampling methods applied to 32000 web pages. While some of the conclusions are not surprising (for example, that sample size affect accuracy), others were not expected at all (that minimal sampling size obtains a high accuracy level under certain circumstances). Categories and Subject Descriptors: H.1.2 Information systems: Online Information Services, Web-based Services; H.5.2 Information Interfaces and Presentation: User Interfaces, Evaluation/Methodology; K.6.4 Management of Computing and Information Systems: System Management, Quality Assurance, Management Audit. General Terms: Human Factors, Measurement. Keywords: Web Accessibility, Accessibility Metric, Accessibility Evaluation Method, Quality Assessment.
1.
INTRODUCTION
Engineering processes involving web accessibility are based on different activities. Some of the most important ones are: • conformance testing, i.e. determining whether all the requirements specified by given guidelines are satisfied; • quality assurance, i.e. monitoring quality levels of a web site as it changes over time, due to revamping and refactoring or due to frequent contents updates;
Permission to make digital or hard copies of all or part of this work for personal or classroom use is granted without fee provided that copies are not made or distributed for profit or commercial advantage and that copies bear this notice and the full citation on the first page. To copy otherwise, to republish, to post on servers or to redistribute to lists, requires prior specific permission and/or a fee. ASSETS’07, October 15–17, 2007, Tempe, Arizona, USA. Copyright 2007 ACM 978-1-59593-573-1/07/0010 ...$5.00.
• accessibility comparisons, i.e. comparing different web sites, for example to rank them differently within search results pages [8] or to rank them within accessibility observatories [7]. Each of these activities requires measurement of accessibility, i.e. that features of web sites affecting accessibility are mapped to a value representing the accessibility level of the site. Conformance testing is based on an absolute-scale measure defined by the number of checkpoints that are violated. Quality assurance requires at least a relative 1 measure to compare today’s level of accessibility of the web site against a previous or different version of the same site. Accessibility comparisons applied by observatories and search engines require an absolute measure of accessibility that produces levels that can be meaningfully compared with each other. Research on accessibility metrics is currently ongoing [2, 14, 15, 4, 5]. In all practical cases we have to face the problem of selecting only a small portion of the web pages in order to compute the metric value. This is usually due to the sheer size of some web sites (e.g. [11] discusses assessments of a web site comprising 30 million pages), to the highly dynamic content of web sites, especially “Web 2.0” ones, and to the need of applying human judgment in order to decide whether certain web site features impact accessibility. A few sampling methods have been proposed so far. Ad hoc methods specify predefined criteria to choose web pages, such ad the home page, site map, contact page, and a representative page for each subsection of the web site. Other sampling methods are probabilistic in nature (e.g. random walk and uniform random sampling) and other ones are based on error profiles computed by accessibility testing tools. However, no systematic study of sampling methods is available to understand which method works better, and under which circumstances. For example, even though it might seem that uniform random sampling is the statistically soundest method, it might not work well for accessibility evaluation when the site is based on few different templates and most pages use one of these templates which contain some accessibility defect. We believe there are a number of open issues regarding sampling methods applied to web accessibility evaluations: 1. How can one define the quality of a sampling method? 2. Which methods are better than others? 1
Relative to the current web site.
3. What is the efficiency of a method? 4. Is the quality of a method affected by the purpose of the evaluation? Is it related to efficiency? 5. Does the size of the sample affect the accessibility level? Is there any interaction effect with the metric used for the evaluation? 6. Are there any other web site properties that affect quality of sampling methods? The purpose of this paper is to address some of these open issues. It illustrates an experimental research performed in order to compare different sampling methods and to analyze their differences.
2.
ACCESSIBILITY METRICS AND SAMPLING METHODS
As seen in the previous section, all three accessibility evaluation activities (conformance testing, quality assurance, accessibility comparisons) can be reduced to the problem of measuring the accessibility level of the web site through a function that maps web site features to accessibility values.
2.1
Accessibility metrics
Conformance testing is based on a function computing the number of checkpoints that fail on a web page/site. For example, if a page has three images lacking alt text, it does not have skip links, and these are the only failed requirements with respect to Section 508, then the (in-)accessibility value would be 2 (since only checkpoints/paragraphs “a” and “o” have failed). If conformance claims are based on prioritized checkpoints (like WCAG 1.0/2.0 do), then the conformance measure is a combination of the measures obtained by separately considering checkpoints within each priority level. The Web Accessibility Quantitative Metric (WAQM) [2] is based on data produced by an accessibility testing tool2 that automates testing of WCAG 1.0/2.0 checkpoints. Although based on WCAG checkpoints, WAQM computes a value that is different than the one produced with conformance testing. In fact, rather than yielding just the number of failed checkpoints, WAQM computes the failure rate for each tested page, i.e. the ratio of the number of violations of each checkpoint over the number of possible violations, and then uses a piecewise linear function to approximate a hyperbole to compute a value between 0 and 100 representing the accessibility of the page. Checkpoint priorities also affect the accessibility level of a page. Finally, the accessibility value of the entire web site is the average of the accessibility of each page, weighted by the page depth in the site. In the experiment described in Section 3, we used the WAQM metric with most parameters set as in [2], except for the two that determine slopes of the piecewise linear function, that after appropriate tuning were set as a = 45 and b = 0.30. No weights were computed on the basis of the depth-level of pages. The accessibility metric defined by the Unified Web Evaluation Methodology 1.0 (UWEM) [14] computes an accessibility value for each page based on results produced by 2
In [2] authors used their own tool, EvalAccess [1]; see [15] for a study on how WAQM changes when different tools are used.
a testing tool against WCAG 1.0 checkpoints. For each page, UWEM computes the failure rate for each checkpoint, which is then transformed into the accessibility value of the page. Such a value can be interpreted as the probability to hit a checkpoint violation when interacting with the page; the accessibility value of a web site is the average over all pages. Although UWEM prescribes that the accessibility metric should be a function also of the error rate of the tool, and it assumes that automatic evaluations, expert reviews and user testing can all be used and their results can be merged, no practical advice on how to do that is given, nor concrete and realistic examples are illustrated.
2.2
Sampling methods
Whenever human judgment is applied to draw sound assessments, a sampling method is needed to select a subset of the pages to be analyzed and upon which the accessibility value is computed and then generalized to the whole web site. Ad hoc sampling methods are suggested by W3C/WAI and by UWEM [16, 14]. In general these methods can be based on predefined criteria that consider the type of pages (e.g. home page, site map, contact page, representative pages with respect to content, pages featuring purchase forms, etc.), on actual usage patterns (derived from web server logs), or on pages retrieved after querying search engines. Although being often used in practice, such methods may lead to suboptimal results because they produce samples that do not represent all the relevant features shown by the entire web site. In addition, such methods often require human intervention in choosing the pages (e.g. when selecting a “representative page for each sub site” or purchase forms) which is expensive and may be subjective. The uniform random sampling method, which guarantees that each page of the web site has the same probability to be included in the sample, is conceptually simple, but for large and dynamic web sites it is not practical since rarely one has an exhaustive list of all the pages ready to choose from and often the same url may lead to content that changes over time. However, this method can be easily approximated by having a tool download a large set of the pages and then implement a random sampling with no replacement from such a set. The advantage of such a method is that it is statistically sound, therefore allowing to draw valid generalizations. Unfortunately, it can lead to samples that are suboptimal with respect to the goals of the accessibility evaluation. For example, if a checkpoint is violated only on a very small minority of pages, then it is likely that most of the samples produced with this method will not include any of these pages, and hence the conformance value computed on a sample and generalized to the entire web site will be invalid. [9, 13] discuss two methods based on random walks over links between pages. The first method encompasses two phases; a walk phase during which, starting from the home page, with probability d an outgoing link and its destination page is selected, and with probability 1 − d the walk returns to another page selected from the set of alreadyvisited pages. The subsequent sampling phase selects some of the pages visited during the walk phase so that each of the visited pages has the same probability to be included in the final sample.
The second method, developed in the context of the European Internet Accessibility Observatory (EIAO) [7], for each page included in an initial pool, and for each of the links leaving the page, selects the corresponding destination page with probability d. d is recomputed at every cycle so that pages have the same probability to be selected. While random walks can be more easily computed than uniform random sampling (because they don’t need the list of pages beforehand) and they do not require human judgment, they may lead to non representative samples. For example, pages located far from the home page (or any other seeding page for the algorithms) may have a substantially lower probability of being chosen. Sampling methods based on distributions of violations have the advantage of selecting pages on the basis of information relevant to accessibility evaluations. King et al. [11] describe a sampling method based on clustering pages according to similarity of the distribution of checkpoint violations (called error profile) and to urls sharing a prefix. More specifically, the error profile of a page is a vector with n components, each consisting of the number of violations of a list of n checkpoints. Only automatically testable checkpoints are included, and the important assumption is made that automatically testable checkpoints have the same distribution as those that are not automatically testable). Using a clustering algorithm applied to a distance metric defined on error profiles, King et al. produced several clusters of pages. From each cluster they randomly sampled pages until a sample of size proportional to the average distance between error profiles in that cluster was reached. In this way, clusters with more heterogeneous error profiles lead to larger samples, coping therefore with the increased difference between profiles. In our research we developed 9 variations of such an errorprofile based sampling method [12]. In particular, the error profile is based on individual tests implemented by the testing tool we used (LIFT), and test results are used to produce three different error profiles, which are vectors with one element per individual test. The i-th component of the error profile of a page can be: NumIssues: number of times that test Ti failed; PassFail: 1 if Ti failed; 0 otherwise; FailRate: the failure rate of Ti (i.e. number of times Ti failed divided by the maximum number of times Ti could fail on that page). Secondly, three different distance metrics are used, namely: Euclidean, Manhattan and cosine correlation [6]. Two partitive clustering algorithms are used chosen for their applicability and performance: PAM (Partitioning Around Medoids) and CLARA (Clustering LARge Applications). In this way we implemented nine methods to cluster web pages into k clusters, each containing pages that are similar with respect to their error profile. From each of the clusters, pages are chosen randomly with no replacement to yield a sample with size=k.
3.
EXPERIMENTAL PLAN
An experiment has been carried out in order to investigate the open issues discussed in the Introduction. In particular the following independent variables were manipulated to understand their effects on the quality of the methods: three
accessibility metrics described in Section 2 (conformance with respect to WCAG 1.0 “AA”, WAQM and UWEM), thirteen sampling algorithms (9 variations of the error-profile based one, two random walks, the uniform random sampling and an ad hoc method following [14]) and 32 web sites (as discussed below).
3.1
Foundation
The first question is how to define quality of a sampling method S with respect to an accessibility metric M; in our case, M ∈ {WCAG, WAQM, UWEM}. To this end we define the sample error as ∆M (s) = |ΘM − ΘM (s)|, where ΘM is the value of the metric M on the entire web site and ΘM (s) is the value of the same metric on the sample s generated through S. The normalized sample error δM (s) ∈ [0, 1] depends on the adopted metric: δWCAG (s)
=
δWAQM (s)
=
δUWEM (s)
=
|ΘWCAG − ΘWCAG (s)| ΘWCAG |ΘWAQM − ΘWAQM (s)| 100 |ΘUWEM − ΘUWEM (s)|
After collecting several samples s1 , s2 , ..., sk for the same hM, Si, we can compute the mean and standard deviation of {δM (si )}; the mean and standard deviation (µhM,Si , σhM,Si ) are the inaccuracy of the sampling method S with respect to the metric M: µhM,Si gives the systematic error from the true value, and σhM,Si gives the unsystematic variability around that value. Interpretation of inaccuracy of sampling methods depends on the metric but is simple. Inaccuracy for the conformance metric gives the proportion of checkpoints that are not covered by the samples. For example, µ = 0.30 means that 30% of the checkpoints were not used/tested in a given set of n samples. For WAQM, µ gives the percentage error in a 0 − 100 scale; for example, µ = 0.30 means that the sampling method underestimates or overestimates the accessibility level of the site by 30%. Similarly for UWEM. To compare the inaccuracy of two sampling methods (S, S 0 ) we use a two-tailed z-test with α = 0.01. In this way, the z-test provides a significance level (p-value) telling us if the two means (µ, µ0 ) are statistically different (i.e. if the two methods have a different inaccuracy), and the actual value of µ − µ0 gives us the effect size (i.e. the magnitude of the difference between the methods).
3.2
Collected data
Comparison of two sampling methods is based on performing the following steps on a list of web sites. Given a desired sample size k, a metric M and pair of sampling methods (S, S 0 ), for each web site: 1. run an accessibility testing tool on the entire web site and compute the metric value over the entire web site ΘM ; 2. extract h = 30 samples of size = k using S, and h samples using S 0 ; 3. for each sample s, run the tool on it, compute the metric value on the sample ΘM (s) and the normalized error δM (s);
4. compute the inaccuracy for both sets of samples: (µhM,Si , σhM,Si ), (µhM,S 0 i , σhM,S 0 i ); 5. apply the z-test to determine if there is a significant difference at α = 0.01 and, if so, record the effect size. The sample sizes {100, 50, 20, 10, 5, 2, 1} were used to test the methods, except for the ad hoc method where for practical reasons sizes were limited to {10, 5, 2, 1}. In addition, further variables were collected for each web site in order to investigate possible dependencies of accuracy on the genre of the web site and on the structure of the directed graph induced by links in the web site. In particular we considered: 1. web sites belonging to the following genres: newspapers, universities, portals, institutions, local government agencies, operational web sites (see the complete list at the end of the paper); 2. the average degree of the web site which is 2m/n for a site with n pages and m links, since the sum of the degree of all the pages is 2m; 3. the average number of pages per level which is given by (n − 1)/d, if the site has n pages and the minimum number of links to reach any page from the home page is d; P 4. the average clustering index n1 p Cp , computed on all n pages, where the clustering index of page p is 2m Cp = dp (dpp−1) , dp is the degree of p and mp is the sum of the degrees of pages reachable from p. This index is the ratio of actual links with respect to links in a clique that includes p and its direct neighbors.
3.3
Assumptions
Our approach assumes that: 1. applying the metric to 1000 pages downloaded with a typical non-interactive crawler launched on the home page (we used HttpTrack) is equivalent to computing it on the entire web site (see step 1 in section 3.2); 2. the distribution of errors produced by the tool (i.e. false negatives and false positives, [3]) when it is applied to the samples is the same as when the tool is applied to the entire web site; 3. the distribution of violations of checkpoints that cannot be reliably judged by the tool (i.e. manual tests) is the same as the distribution of those that can be automatically tested. The first assumption is needed in order to cope with web sites having different size (we wanted to avoid any unnecessary factor to influence our results), to cope with the fact that web site size can change over time, and to cope with the practical difficulty of dealing, within the experiment, with sizes that may exceed several thousands of pages.
3.4
Execution
Data was collected from 32 web sites (mostly Italian ones), grouped into six genres; 1 claimed a WCAG 1.0 conformance level “A”, 3 claimed “AA”, 1 claimed “AAA”, 3 claimed to be conformant with respect to the Italian web accessibility regulation [10]. For each web site we downloaded 1000 pages
by launching HttpTrack on the home page, configured to follow a breadth-first strategy and download only HTML, CSS, JavaScript and image files. These files were then mirrored on a temporary web server, and analyzed with LIFT, an accessibility testing web-based tool. Thirteen sampling methods were tested against 32 sites, 7 sample sizes and 3 metrics, by generating 30 samples for each combination of these factors. The methods are: Ad-hoc ad hoc selection of pages; Random uniform random sampling; Random-walk-A random walk A (following [13]); Random-walk-B random walk B (following [9]); NumIssues-Eucl stratified sampling with NumIssues error profile, Euclidean distance, clustering with CLARA; PassFail-Eucl stratified with PassFail, Euclidean, CLARA; FailRate-Eucl stratified with FailRate, Euclidean, CLARA; NumIssues-Manh stratified with NumIssues, Manhattan, CLARA; PassFail-Manh stratified with PassFail, Manhattan, CLARA; FailRate-Manh stratified with FailRate, Manhattan, CLARA; NumIssues-cos stratified with NumIssues, cosine, PAM; PassFail-cos stratified with PassFail, cosine, PAM; FailRate-cos stratified with FailRate, cosine, PAM. In terms of efficiency of the methods, from a computational viewpoint, the most efficient one is the ad hoc one, since no computation is needed at all. On the other hand, the most expensive ones are the stratified ones (especially those based on PAM) since a computationally-intensive clustering algorithm needs to be run. However, from a humanproductivity perspective, the ad hoc methods are the least efficient ones since they require human judgment. In addition, methods based on error profile require such profiles to be generated by the testing tool, which means that the tool needs to be run against the entire web site (or large part of it) before the sampling takes place. It is possible that once the error profile of the pages have been generated, subsequent applications of a metric to different samples (for example, as it would happen when measuring accessibility on the same web site over time) would still be accurate enough, despite possible changes in the web site. In such a case, error profiles and clusters can be computed once and reused several times, reducing dramatically the computational requirements of these sampling methods.
4. 4.1
RESULTS Data analysis
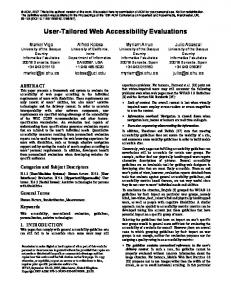
On the 1000 pages of the 32 web sites, LIFT generated sets of errors and warnings whose size ranged site by site from 40559 to 771107, with an average of 247539. According to genres, the category with fewest violations was “local government” that yielded 796601 violated checkpoints, whereas “newspaper” web sites showed the highest number of violated checkpoints, 2138207. Figure 1 shows the frequency of violations of WCAG 1.0 checkpoints over all 32000 pages. The most frequently violated checkpoint is “11.2: Avoid deprecated features of W3C
+ + + + + + + +
0.5 0.3
0.4
+ + + + + + +
+ + + + + + + + +
+ + + + + +
0.2
+ + + + + + +
+ + +
+ + + + + + + +
+ + + + + +
0.0
0.1
Mean of normalized sampling error
+ +
0
20
40
60
80
100
Size
0.04
WAQM
+ +
0.03
+ ++ +
0.02
+ + + + + + + + + + + + + + +
+ + + + + + + + + +
0.01
Mean of normalized sampling error
+ + + + + ++ +
+ + + + + + + + +
+ + + + + +
+ + + + + +
+ +
+
+ +
+
0
20
40
60
80
100
Size
0.08
UWEM
+ + 0.06
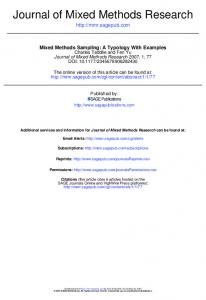
Figure 3 (see also Table 2 at the end of the paper for detailed data on WCAG metric) shows how µhM,Si varies for the three metrics when changing the sample size and sampling methods. In general, inaccuracy is worst (i.e. µ is highest) with smaller sample sizes (in our case k = 1) and then it improves with increasing sizes. Notice however the different scales used for µ: for WCAG µ ranges from 0.01184 to 0.50490, meaning that in the worst case there is an error exceeding 50% (i.e. more than 50% of the checkpoints that show a violation are not detected); for WAQM inaccuracy ranges from 0.005538 to 0.03893; for UWEM it ranges from 0.005878 to 0.07360. Hence, for the latter two metrics, the range is much smaller and restricted to smaller values, meaning that differences between sampling methods are flattened and less dramatic. For WCAG, the minimum inaccuracy of approximately 1.2% means that up to 98.8% of checkpoints violations may be detected; the sampling method achieving this is PassFailcos. For WAQM the best method is Random, with a minimum inaccuracy of 0.55%, and for UWEM it is also Random, with 0.59% inaccuracy. For WCAG, the difference in inaccuracy for each method from the worst-case to the best-case (by letting sample size to vary) ranges from 0.1789 to 0.4895. For WAQM the range is 0.01321 to 0.02791, and for UWEM it is 0.01974 to 0.05767. Viceversa, by letting the method vary, the difference in inaccuracy for each sample size ranges for WCAG from 0.03476 to 0.1669, for WAQM from 0.01031 to 0.01343, and for UWEM from 0.01594 to 0.04553. With WCAG coupled to the best method PassFail-cos, when switching from samples of size 1 to size 50, the error drops by 0.442, from 0.50 to 0.058; therefore 44% more violation types are detected. If we move from size 50 to a size of 100, the error drops further to 0.01184, therefore detecting only additional 4.6% violation types. For UWEM and WAQM the sample size has a much more limited effect. With a sample size of 1 the error is close to 3.1% (UWEM) and 2.7% (WAQM). Moving sample size to 100, the error drops to 0.5% for both metrics. Furthermore, for WCAG in order to obtain an inaccuracy of 10% or less, a sample of size=50 is needed; to get 5% or less, then only a sample of size=100 has to be used. For WAQM an astonishingly small sample size of 1 is sufficient to obtain an inaccuracy of 5% at the most (but with a proper method the maximum error is 3.89%), and a size of at least 5 is needed to obtain 2% of inaccuracy (up to 50 pages are needed to go below 1%). Finally, for UWEM it is basically the same: a sample size of 1 is enough to get 5% error, and to get a 2% error or less a size of at least 10 is needed. For UWEM a sample size of 1 can lead to a maximum error of 5.01%.
+ + + + + ++
0.04
Interpretation of results
Mean of normalized sampling error
4.2
WCAG
+ + + ++ + ++ + + + + + +
0.02
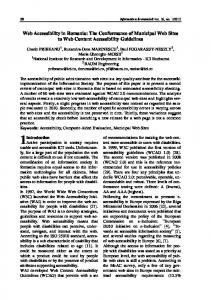
technologies”, followed by “13.1: Clearly identify the target of each link.”, “1.1: Provide a text equivalent for every nontext element”, “2.2: Ensure that foreground and background color ...” and “3.1: ... use markup rather than images to convey information”. The conformance metric (which will be called WCAG in the following) expressed as percentages ranged from 32 to 84, WAQM from 47 to 80 and UWEM from 63 to 89. Figure 2 illustrates the distribution of the three metrics.
+ + + + + + +
+
+
+
+ + + + + + + +
+ + + + + + + + +
+ + + + + + + + +
+
+ + + + + + + + + +
+
0
20
40
60
80
100
Size
Figure 3: Plot of µhM,Si for all sample sizes, all methods and for the three metrics. Notice that scales differ. Table 1 shows which methods are best for each metric (after applying the z-test with α = 0.01 to data collected for each pair of methods with no distinction between sample size). For WCAG the best methods are the FailRate and PassFail error profile combined with cosine distance; these methods yield an average inaccuracy of up to 24.49%. The worst method is by far the ad hoc one, leading to 37.69% of
Figure 1: Frequency of violations of WCAG 1.0 checkpoints detected over 32000 pages.
100
Accessibility values
80
WCAG WAQM UWEM x 100
+
0
20
30
40
20
50
60
40
70
80
60
90
Accessibility value of sites
1
2
3
4
5
6
7
8
9
10
11
12
13
14
15
16
17
18
19
20
21
22
23
24
25
26
27
28
29
30
31
32
WCAG
WAQM
UWEM x 100
Figure 2: Barplot and boxplot showing the distribution of the values of the three metrics over the complete 32 web sites. inaccuracy, a large difference (13.2%). Unfortunately this is the method most often used in practice. Although there are statistically significant differences, for WAQM and UWEM the magnitude of the difference is not large, as we have already discussed above: 1.14% difference for WAQM and 2.53% for UWEM. Therefore choosing a method on the basis of its accuracy might be irrelevant if one can cope with those differences in accuracy. A more effective choice criterion might focus on efficiency, for example. Overall, among all sizes and metrics, the method that shows the best accuracy is FailRate error profile combined with cosine distance (0.0994). Quality of methods correlates weakly with structural variables of the web sites. The highest correlation is between WCAG and the average degree, where Pearson’s coefficient gets close to 0.5, indicating a weak correlation. In other cases correlation is much lower or absent. This suggests that accuracy of sampling methods is not affected by the graph-structure of the web site; therefore the choice of the sampling method is independent from the structure of the web-graph of the site.
5.
CONCLUSION
The exhaustive tests we performed on the thirteen sampling methods combined with 7 sample sizes and 3 metrics support the following conclusions. 1. Quality of the sampling methods can be defined in terms of inaccuracy with respect to the values obtained by applying the metric on a much larger pool of pages. Inaccuracy can be defined in terms of systematic and non systematic error. 2. Accuracy of methods depends heavily on the metric, i.e. on the purpose for which sampling is performed.
This means that the choice of the sampling method should be made after careful analysis, since the method will dramatically affect the outcome. The conformance metric is by far the most sensible one with respect to method changes and sample size. In the worst case, inaccuracy can be so high that more than 50% of the checkpoints showing a violation are not detected; in the best case it can be 1.2%. For WCAG conformance the best methods are stratified ones, using error profiles and a cosine distance between profiles. The worst method is the ad hoc one, with an inaccuracy close to 38%. For UWEM and WAQM, inaccuracy of methods change very little from its lowest levels. 3. Accuracy also depends on sample size. Sample size accounts, with conformance metric, for more than 11% difference in accuracy. In order to reach 5% or less of inaccuracy, with conformance we need a sample of at least 50. For the other two metrics sample size is not so important: with just one page we can get an error as low as 3.9% for WAQM and 5% for UWEM. 4. We did not find any correlation of accuracy with respect to structure of the web site. Further work is planned to better understand the interaction between metric, method and size, in order to provide even more focused recommendations. In addition, sensitivity analysis is needed to assess dependency of these results on the tool being used and the number of pages that were used to approximate the value of the metrics on the whole site.
1 2
WCAG FailRate-cos 0.2449 PassFail-cos 0.2529 NumIssues-cos 0.2640
3
FailRate-Manh 0.2770 PassFail-Manh 0.2779 FailRate-Eucl 0.2818 PassFail-Eucl 0.2849
4
NumIssues-Manh 0.2963 Random-walk-B 0.3018 NumIssues-Eucl 0.3049
5 6 7
Random-walk-A 0.3136 Random 0.3349 Ad-hoc 0.3769
WAQM
UWEM
Random 0.0152
Random 0.0178
PassFail-cos 0.0192
Random-walk-B 0.0248
PassFail-Eucl 0.0202 FailRate-cos 0.0202 FailRate-Eucl 0.0204 PassFail-Manh 0.0211 FailRate-Manh 0.0211 Random-walk-B 0.0217 NumIssues-Manh 0.0226 NumIssues-cos 0.0226 NumIssues-Eucl 0.0226 Random-walk-A 0.0258 Ad-hoc 0.0289
PassFail-Eucl 0.0272 Random-walk-A 0.0278 FailRate-Eucl 0.0280 NumIssues-Eucl 0.0309 Ad-hoc 0.0320 NumIssues-Manh 0.0325 FailRate-Manh 0.0330 FailRate-cos 0.0331 PassFail-Manh 0.0345 PassFail-cos 0.0354 NumIssues-cos 0.0431
Table 1: Rankings of methods (and their µ) with respect to metrics: methods close to the top show a higher accuracy; methods that are grouped have accuracies that are not significantly different (pairwise z-test at α = 0.01).
6.
REFERENCES
[1] J. Abascal, M. Arrue, I. Fajardo, N. Garay, and J. Tom´ as. The use of guidelines to automatically verify web accessibility. Univers. Access Inf. Soc., 3(1):71–79, 2004. sipt07.si.ehu.es/evalaccess/index.html. [2] M. Arrue, M. Vigo, and J. Abascal. Quantitative metrics for web accessibility evaluation. In Proceedings of the ICWE 2005 Workshop on Web Metrics and Measurement, 2005. [3] G. Brajnik. Comparing accessibility evaluation tools: a method for tool effectiveness. Universal Access in the Information Society, 3(3-4):252–263, Oct 2004. www.springerlink.com/openurl.asp?genre= article&id=doi:10.1007/s10209-004-0105-y. [4] G. Brajnik. Ranking websites through prioritized web accessibility barriers. In Technology and Persons with Disabilities Conference, Los Angeles, March 2007. CSUN, California State University Northridge. www.dimi.uniud.it/giorgio/papers/csun07.pdf. [5] G. Brajnik and R. Lomuscio. Samba: a semi-automatic method for measuring barriers of accessibility. In S. Trewin, editor, 9th Int. ACM SIGACCESS Conference on Computers and Accessibility, ASSETS, Tempe, AZ, Oct 2007. ACM Press.
[6] M. Dunham. Data Mining: Introductory and Advanced Topics. Prentice Hall, 2003. [7] EIAO. European Internet Accessibility Observatory. www.eiao.net. [8] Google. Google accessible search. labs.google.com/accessible, 2007. Visited: May 2007. [9] M. R. Henzinger, A. Heydon, M. Mitzenmacher, and M. Najork. On near-uniform URL sampling. In Proceedings of the 9th international World Wide Web conference on Computer Networks: the International Journal of Computer and Telecommunications Networking, pages 295–308, Amsterdam, The Netherlands, 2000. North-Holland Publishing Co. [10] Italian Government. Requisiti tecnici e i diversi livelli per l’accessibilit` a agli strumenti informatici. www.pubbliaccesso.it/normative/DM080705.htm, July 2005. G. U. n. 183 8/8/2005. [11] M. King, J. Thatcher, P. Bronstad, and R. Easton. Managing usability for people with disabilities in a large web presence. IBM Systems Journal, 44(3):519–535, 2005. [12] A. Mulas and C. Pitton. Analisi sperimentale e proposta di nuove tecniche di campionamento per la valutazione manuale dell’accessibilit` a di siti web. Master’s thesis, University of Udine, Udine, Italy, April 2007. [13] N. Ulltveit-Moe, M. Snaprud, A. Nietzio, M. G. Olsen, and C. Thomsen. Early Results from Automatic Accessibility Benchmarking of Public European Web Sites from the EIAO. eiao.net/publications. Visited: May 2007. [14] E. Velleman, C. A. Velasco, M. Snaprud, and D. Burger. D-WAB4 Unified Web Evaluation Methodology (UWEM 1.0). Technical report, WAB Cluster, 2006. [15] M. Vigo, M. Arrue, G. Brajnik, R. Lomuscio, and J. Abascal. Quantitative metrics for measuring web accessibility. In W4A ’07: Proceedings of the 2007 International Cross-Disciplinary Workshop on Web Accessibility (W4A), pages 99–107, New York, NY, USA, 2007. ACM Press. www.dimi.uniud.it/giorgio/papers/w4a07.pdf. [16] W3C/WAI. Conformance evaluation of web sites for accessibility: Determine the scope of the evaluation. www.w3.org/WAI/eval/conformance.html#scope. Visited: May 2007.
Method 1 µ = 0.4967 2 σ = 0.0306 µ = 0.4584 σ 2 = 0.0287 µ = 0.4584 σ 2 = 0.0287 µ = 0.4568 σ 2 = 0.0279 µ = 0.4985 σ 2 = 0.0315 µ = 0.5048 σ 2 = 0.0335 µ = 0.5009 σ 2 = 0.0326 µ = 0.5010 σ 2 = 0.0332 µ = 0.5015 σ 2 = 0.0330 µ = 0.5029 σ 2 = 0.0322 µ = 0.5005 σ 2 = 0.0328 µ = 0.5013 σ 2 = 0.0330 µ = 0.4973 σ 2 = 0.0327
Random Random-walk-A Random-walk-B Ad-hoc NumIssues-Eucl PassFail-Eucl FailRate-Eucl NumIssues-Manh PassFail-Manh FailRate-Manh NumIssues-cos PassFail-cos FailRate-cos
2 µ = 0.4469 2 σ = 0.0272 µ = 0.4224 σ 2 = 0.0270 µ = 0.4121 σ 2 = 0.0280 µ = 0.4173 σ 2 = 0.0260 µ = 0.4299 σ 2 = 0.0262 µ = 0.4281 σ 2 = 0.0267 µ = 0.4269 σ 2 = 0.0269 µ = 0.4320 σ 2 = 0.0275 µ = 0.4295 σ 2 = 0.0258 µ = 0.4286 σ 2 = 0.0265 µ = 0.4358 σ 2 = 0.0262 µ = 0.4337 σ 2 = 0.0258 µ = 0.4286 σ 2 = 0.0287
5 µ = 0.3893 2 σ = 0.0213 µ = 0.3680 σ 2 = 0.0265 µ = 0.3578 σ 2 = 0.0258 µ = 0.3461 σ 2 = 0.0224 µ = 0.3528 σ 2 = 0.0191 µ = 0.3444 σ 2 = 0.0232 µ = 0.3422 σ 2 = 0.0221 µ = 0.3469 σ 2 = 0.0220 µ = 0.3381 σ 2 = 0.0217 µ = 0.3294 σ 2 = 0.0223 µ = 0.3488 σ 2 = 0.0218 µ = 0.3461 σ 2 = 0.0228 µ = 0.3370 σ 2 = 0.0221
Sample size 10 µ = 0.3387 2 σ = 0.0171 µ = 0.3305 σ 2 = 0.0250 µ = 0.3118 σ 2 = 0.0210 µ = 0.2779 σ 2 = 0.0206 µ = 0.2728 σ 2 = 0.0177 µ = 0.2553 σ 2 = 0.0170 µ = 0.2425 σ 2 = 0.0148 µ = 0.2526 σ 2 = 0.0155 µ = 0.2285 σ 2 = 0.0126 µ = 0.2283 σ 2 = 0.0126 µ = 0.2624 σ 2 = 0.0166 µ = 0.2555 σ 2 = 0.0178 µ = 0.2421 σ 2 = 0.0177
20 µ = 0.2892 2 σ = 0.0119 µ = 0.2746 σ 2 = 0.0216 µ = 0.2582 σ 2 = 0.0169
50 µ = 0.2175 2 σ = 0.0075 µ = 0.1983 σ 2 = 0.0148 µ = 0.1839 σ 2 = 0.0120
100 µ = 0.1657 2 σ = 0.0049 µ = 0.1427 σ 2 = 0.0098 µ = 0.1307 σ 2 = 0.0076
µ = 0.2046 σ 2 = 0.0120 µ = 0.1464 σ 2 = 0.0074 µ = 0.1515 σ 2 = 0.0080 µ = 0.1837 σ 2 = 0.0100 µ = 0.1409 σ 2 = 0.0061 µ = 0.1423 σ 2 = 0.0071 µ = 0.1762 σ 2 = 0.0122 µ = 0.1636 σ 2 = 0.0146 µ = 0.1465 σ 2 = 0.0130
µ = 0.1204 σ 2 = 0.0061 µ = 0.0728 σ 2 = 0.0028 µ = 0.0710 σ 2 = 0.0025 µ = 0.1064 σ 2 = 0.0052 µ = 0.0626 σ 2 = 0.0021 µ = 0.0674 σ 2 = 0.0023 µ = 0.0866 σ 2 = 0.0058 µ = 0.0584 σ 2 = 0.0031 µ = 0.0506 σ 2 = 0.0027
µ = 0.0722 σ 2 = 0.0032 µ = 0.0309 σ 2 = 0.0007 µ = 0.0250 σ 2 = 0.0005 µ = 0.0562 σ 2 = 0.0020 µ = 0.0266 σ 2 = 0.0005 µ = 0.0249 σ 2 = 0.0005 µ = 0.0380 σ 2 = 0.0014 µ = 0.0118 σ 2 = 0.0003 µ = 0.0123 σ 2 = 0.0003
Table 2: Accuracy of the sampling methods with different sample sizes with respect to WCAG metric.
Institutions
Newspapers • • • • • • •
www.w3.org www.ercim.org www.carabinieri.it www.poliziadistato.it www.tuttoconsumatori.it www.serviziocivile.it www.ialweb.it
• • • • • •
www.uniud.it www.univ.trieste.it www.unipd.it www.unifi.it www.uniroma1.it www.unimi.it
• • • • •
www.trenitalia.it www.dmail.it www.tre.it www.apogeonline.com www.essedi.it
• • • • •
www.gazzettino.quinordest.it www.repubblica.it www.corriere.it www.ilgiornale.it www.ilsole24ore.com
• • • •
www.regione.sardegna.it www.regione.puglia.it www.regione.piemonte.it www.regione.vda.it
• • • • •
www.excite.it www.quattroruote.it www.puntoinformatico.it www.pcfacile.com www.paginegialle.it
Local government
Universities
Operational
Portals
Table 3: List of tested web sites with their genres.