features such as color (Baldwin, 1989; Landau, Smith, &. Jones, 1988). ... Dermott, & Chun, 1997), places (Epstein, Harris, Stanley,. & Kanwisher, 1999), and ...
Cognitive, Affective, & Behavioral Neuroscience 2003, 3 (1), 1-16
Effects of structural similarity on neural substrates for object recognition JANE E. JOSEPH and ANN D. GATHERS University of Kentucky Medical Center, Lexington, Kentucky Human occipitotemporal cortex (OTC) is critically involved in object recognition, but the functional organization of this brain region is controversial. In the present study, functional magnetic resonance imaging (fMRI) signal changes were recorded in humans during an animal-matching task that parametrically varied degree of structural (i.e., shape) similarity among the items. fMRI signal in the midto anterior-fusiform gyrus increased as animals overlapped more in terms of structure and as reaction time increased. In contrast, relatively more posterior aspects of the fusiform gyrus and inferior occipital cortex showed greater fMRI signal when the animals overlapped less in terms of structure. A similar organization emerged when three-dimensional geometric shapes were matched, indicating that OTC is differentially tuned to varying degrees of overlap in object structure, regardless of taxonomic category. We discuss how the present findings fit in with current functional neuroanatomical approaches to object recognition.
Object recognition depends critically on processing the shape of an object. Nearly all models of object naming and recognition involve a processing stage that is intermediate between perceptual and semantic processing (Biederman, 1987; Davidoff, 1991; Humphreys, Riddoch, & Quinlan, 1988), and this stage includes processing some type of shape representation. In one account, the shape representation is a structural description, which is an abstract representation of the three-dimensional (3-D) structure of an object (Biederman, 1987; Marr & Nishihara, 1978). A structural description specifies the primitive volumetric components of an object as well as the relative sizes of the components and their spatial arrangement; therefore, a structural description is an abstract representation of shape or structure. The present study is concerned with these shape representations, which mediate between perceptual and semantic processing and which we refer to as structural descriptions. Structural descriptions can be contrasted with perceptual descriptions, which are derived from the pattern of light striking the retina and specify edges or blobs in an image as well as the layout of surfaces, as in primal or 2-1/2-dimensional sketches (Marr, 1982). Importantly, unlike structural descriptions, perceptual descriptions are not abstract representations of structure, and they are typically associated with a relatively earlier stage of visual processing.
The importance of structural descriptions has been underscored in both cognitive (Biederman, 1987; Humphreys et al., 1988) and computational (Marr & Nishihara, 1978) approaches to object vision. In addition, shape information appears to be a critical object attribute that binds together members of basic- or entry-level categories (Jolicœur, Gluck, & Kosslyn, 1984; Rosch, Mervis, Gray, Johnson, & Boyes-Braem, 1976). When children learn to generalize learned concepts to new instances, they most often use the attribute of shape to do so, rather than other features such as color (Baldwin, 1989; Landau, Smith, & Jones, 1988). Collectively, this evidence shows that shape information is a critical feature needed to name, identify, and classify objects. The ventral aspects of primate occipital and temporal cortex, referred to as the ventral processing stream, play a pivotal role in processing object form or shape, whereas other, more dorsal regions are concerned with processing information about the location of an object in space (Creem & Proffitt, 2001; Ungerleider & Mishkin, 1982). A recent explosion of functional neuroimaging studies has provided important insights into the functional organization of the human ventral processing stream for object recognition (see Grill-Spector, Kourtzi, & Kanwisher, 2001; Joseph, 2001). These studies have (1) provided a description of the patterns of brain activation as a function of recognizing objects from different taxonomic categories, (2) provided a description of the response properties of cortical regions involved in object recognition, and (3) focused on potential cognitive processing mechanisms that drive cortical responses during object recognition. Each body of work is presented in turn. First, in several functional imaging studies the effect of manipulating taxonomic category on PET or f MRI responses has been examined, and the debate continues as to
We thank Gerry Piper, Peter Hardy, and David Partin for their technical assistance, Guinevere Eden and Karen Jones for their important roles in preliminary experiments, and Don Gash, Christine Brown, Jim Eliassen, and Dennis Proffitt for helpful comments on earlier drafts of this manuscript. Finally, we thank the participants who volunteered for the study. Correspondence concerning this article should be addressed to J. E. Joseph, Department of Anatomy and Neurobiology, University of Kentucky Medical Center, 800 Rose St., Davis-Mills Building, Room 308, Lexington, KY 40536 (e-mail: jjoseph@pop. uky.edu).
1
Copyright 2003 Psychonomic Society, Inc.
2
JOSEPH AND GATHERS
whether specialized neural modules exist for the recognition of different categories (see, e.g., Kanwisher, 2000) or whether object and category representations are more distributed throughout object-processing areas (see, e.g., Haxby et al., 2001). Evidence for the specialized module view comes from findings that faces (Kanwisher, McDermott, & Chun, 1997), places (Epstein, Harris, Stanley, & Kanwisher, 1999), and body parts (Downing, Jiang, Shulman, & Kanwisher, 2001) produce strong and replicable f MRI responses in specific brain regions in comparison with other object categories. Faces, for example, consistently activate the midfusiform gyrus, whereas places activate the parahippocampal gyrus. This consistent activation has been interpreted as evidence of specialized modules that are dedicated to recognizing given object categories. In a different view, a given category maximally activates a small brain region, but other categories produce statistically significant responses in the same region (Haxby et al., 2001; Ishai, Ungerleider, Martin, & Haxby, 2000; Joseph & Gathers, 2002). Importantly, these two approaches outline possible configurations for the functional architecture that supports object recognition, but the cognitive processing mechanisms that may drive cortical responses involved in object recognition have not been addressed in this debate. The need to address cognitive processing mechanisms was emphasized by Joseph (2001) in a recent literature review and meta-analysis of stereotactic coordinates from 14 neuroimaging studies. In that meta-analysis, the category manipulation (face vs. natural object vs. manufactured object) accounted for some variance in brain activation locus in occipital and ventral temporal cortical areas. However, the type of cognitive task (viewing vs. matching vs. naming) accounted for even more variance than did taxonomic category distinctions. Consequently, the cognitive demands of an object-recognition task can influence the spatial distribution and localization of cortical responses. A second body of research focuses on the response properties of human cortical regions that support object recognition (see Grill-Spector et al., 2001). In one line of investigation, a particular region of the ventral visual stream, called the lateral occipital complex (LOC), responds robustly to object shape or structure but not to two-dimensional (2-D) textures (Malach et al., 1995). The LOC responds to objects defined by motion, luminance, or texture (Grill-Spector, Kushnir, Edelman, Itzchak, & Malach, 1998) as well as by stereoscopic information in the absence of luminance contours (Gilaie-Dotan, Ullman, Kushnir, & Malach, 2001). In addition, the LOC responds to objects or shapes even when partially occluding grids create differences in local edges (Kourtzi & Kanwisher, 2001; Lerner, Hendler, & Malach, 2002). The LOC shows reduced responses to image scrambling (GrillSpector, Kushnir, Hendler, et al., 1998; Lerner, Hendler, Ben-Bashat, Harel, & Malach, 2001) or other forms of image degradation such as the addition of visual noise (Malach et al., 1995), but it is not sensitive to spatial frequency, retinal size, or visual field (Grill-Spector, Kush-
nir, Hendler, et al., 1998; Malach et al., 1995). Importantly, primary visual cortex and early visual areas do not show the same response properties as does the LOC. Other authors who did not specifically isolate the LOC but who used similar manipulations corroborate these findings for similar cortical areas (Op de Beeck, Beatse, Wagemans, Sunaert, & van Hecke, 2000; Vuilleumier, Henson, Driver, & Dolan, 2002). This work suggests that the LOC is not critically engaged in low-level visual processing such as spatial frequency processing and local edge extraction, nor is it retinotopically organized. Instead, the LOC appears to be involved in higher level aspects of object perception. Lerner et al. (2001) suggested that early visual areas are devoted to processing local features, whereas later visual areas (including the LOC) process information more holistically, on the basis of the f inding that the LOC shows a reduced response to scrambled images, whereas primary visual cortex shows a stronger response to scrambling. In the present study, we investigate whether the more holistic representations processed in anterior ventral visual stream areas are structural object descriptions. A third set of studies has focused on potential cognitive processing mechanisms that may drive ventral visual stream responses. Gauthier and colleagues (Gauthier, Anderson, Tarr, Skudlarski, & Gore, 1997; Gauthier et al., 2000b) have proposed that the level of categorization needed to identify objects influences cortical responses in these regions. The brain regions that seem to be specialized for faces are actually engaged in a process of identifying objects at a more specific or subordinate level than is needed for other object categories. They also show that the amount of expertise in identifying certain classes of objects modulates the response in these “face-specific” regions, even when faces are not the target stimulus set (Gauthier, Skudlarski, Gore, & Andersen, 2000; Gauthier, Tarr, Anderson, Skudlarski, & Gore, 1999). The putative mechanism responsible for the functional organization of the ventral visual stream, then, is a process of distinguishing among visually similar category members, manipulated by the requirement of subordinate categorization. This explanation is plausible; however, these investigations did not formally operationalize the notion of similarity among natural object categories. Op de Beeck et al. (2000) manipulated degree of shape degradation in orientation, basic category level, and exemplar-matching tasks in an f MRI study. More shape degradation led to a reduced response in the midfusiform gyrus, regardless of whether the task was one of orientation, category, or exemplar matching. Moreover, shape degradation exerted a more powerful influence on midfusiform responses than did categorization level. This finding is at odds with the proposal by Gauthier et al. (1999) that these fusiform regions are involved in processing objects at a more specific level (as has been tapped by the exemplar-matching task in the Op de Beeck et al., 2000, study). Op de Beeck et al. concluded that certain aspects of the fusiform gyrus isolated in their study are en-
STRUCTURAL SIMILARITY AND OBJECT RECOGNITION gaged in perceptual object processing rather than in higher level processing such as retrieving memory representations. This conclusion stemmed from the finding that shape degradation influenced midfusiform responses even when nonsense shapes were matched for orientation. Consequently, these midfusiform responses do not seem to depend on whether an object is meaningful, familiar, or nameable. Many studies have confirmed that midfusiform or LOC responses are not exclusive for real and nameable objects (Kourtzi & Kanwisher, 2000; Malach et al., 1995; Moore & Price, 1999; Schacter et al., 1995; Vuilleumier et al., 2002; Whatmough, Chertkow, Murtha, & Hanratty, 2002), collectively suggesting that cognitive processing in the midfusiform gyrus is biased toward perceptual rather than semantic processing. A recent f MRI study has resolved some of the debate concerning the type of processing engaged in by ventral visual stream areas. Vuilleumier et al. (2002) examined priming effects on f MRI responses during object recognition. Priming effects were assessed by repeating the presentations of objects (1) from the same or from a different viewpoint, (2) with the same or with a different image size, and (3) with the same name but as a different exemplar of a given category. In general, priming effects are associated with reduced activation in cortical regions that respond strongly to the first presentation of a stimulus (Buckner et al., 1995; van Turennout, Ellmore, & Martin, 2000). Vuilleumier et al. found that priming effects in the right fusiform gyrus were driven by viewpoint priming, whereas priming effects in the left fusiform gyrus were insensitive to viewpoint. This indicates that the fusiform gyrus supports both viewpoint-dependent and viewpointinvariant object representations, albeit in different hemispheres. Importantly, the left fusiform gyrus did not show exemplar priming effects, indicating that although it is involved in processing viewpoint-invariant representations, these representations appear to be item specific rather than representations of a given class of objects. In other words, these representations are not likely semantic in nature. Potentially, they may be higher order perceptual representations, such as structural descriptions. In sum, human functional neuroimaging studies have isolated several important factors that may drive the functional organization of ventral visual and visual association cortex, such as taxonomic category (Kanwisher et al., 1997; Krieman, Koch, & Fried, 2000), level of categorization (Gauthier et al., 1997; Gauthier et al., 2000a), perceptual expertise (Gauthier et al., 2000; Gauthier et al., 1999), holistic versus local feature processing (Lerner et al., 2001), and central versus peripheral visual processing of object stimuli (Levy, Hasson, Avidan, Hendler, & Malach, 2001). However, the shape-processing demands of object recognition were directly manipulated in few of those studies. In the present study, we parametrically vary structural similarity (SS) between two objects (animals or three-dimensional shapes) in a perceptual matching task that required deciding whether two simultaneously presented objects were the same or different. Objects that have similar structures are high in SS and are thus more diffi-
3
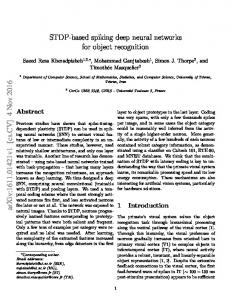
cult to differentiate than are objects that do not have similar structures; consequently, natural objects take longer to name than do manufactured objects, because they overlap more in terms of structure (Humphreys et al., 1988), and object-matching tasks are affected by degree of SS (Joseph, 1997; Joseph & Proffitt, 1996). As an example, dogs and horses (high SS) have the same general structure and organization of individual body components, whereas frogs and dolphins (low SS) do not (see Figure 1A). Consequently, pictures of frogs and dolphins are differentiated faster and more accurately than pictures of dogs and horses. If the midfusiform gyrus is involved in processing structural object descriptions, then f MRI signal in these cortical areas will be modulated by parametrically varied SS. On the basis of a preliminary study that showed this pattern in an animal-naming task (Joseph, Jones, Zeffiro, & Eden, 2000), we further postulate that relatively more anterior aspects of the ventral visual stream will be engaged during high-SS matching, and relatively more posterior aspects will be engaged during low-SS matching. Our primary goal was to examine the influence of parametrically varied SS on the functional organization of occipitotemporal (OT) cortex; however, we also report on other cortical areas that are modulated by SS. METHOD Participants In Experiment 1, 12 paid adult volunteers were originally scanned, but the raw data of 2 participants were omitted due to excessive head motion or image artifacts. The remaining sample consisted of 5 females and 5 males (mean age 28 years, all right-handed) with normal or corrected-to-normal vision. In Experiment 2, 16 participants were originally scanned, but the raw data of 5 participants were omitted due to excessive head motion or image artifacts. The remaining sample consisted of 5 female and 6 male paid adult volunteers (mean age 24 years, 9 right-handed) with normal or correctedto-normal vision. None of the participants had a history of neurological or psychiatric illness. One participant had a history of thyroid cancer and was taking thyroid medication at the time of the study. Three individuals participated in both experiments, thereby completing the animal-matching task twice. However, only the data from their first session were used. The participants gave written consent in accordance with the guidelines of the University of Kentucky Institutional Review Board. Stimuli and Procedure Line drawings of animals from several different classes (birds, mammals, reptiles, amphibians, fish, and insects) served as stimuli for the animal-matching task. In a previous rating study (Joseph, 1997), 22 participants viewed 195 pairs of natural objects two times and rated the similarity of the two items of a pair in terms of 3-D, volumetric structure. In that rating study, the participants were instructed to focus on the 3-D structure and to ignore similarity of the object outlines, sizes, orientations, and taxonomic categories. Using a mouse, the participants moved a marker along the analogue rating scale, which was anchored by the labels least similar (corresponding to a value of 0) and most similar (corresponding to a value of 1,000). Quartile values from the distribution of SS ratings determined the assignment of animal pairs to each of the four SS levels in the present study (12 pairs per SS level). The shape-matching stimuli were 12 drawings of 3-D shapes scanned in from a previously published report (Biederman, 1987) in which the 3-D shapes were classified along four dimensions, or
4
JOSEPH AND GATHERS
Figure 1. Experimental design for the animal- and 3-D-shape-matching tasks. (A) Sample animal pairs for each of the four levels of structural similarity (SS1–SS4), with mean SS ratings and standard deviations (SDs) for different trials shown in the last column. (B) Sample 3-D shape pairs for each of the three SS levels (SS1–SS3).
nonaccidental properties: (1) whether the edge of the cross section of the shape was curved or straight; (2) whether the cross section exhibited both rotational and reflectional symmetry or only reflectional symmetry; (3) whether the size of the cross section was constant or expanded along the longitudinal axis of the shape; and (4) whether the longitudinal axis of the shape was curved or straight. Ten shape pairs were created for each of three SS levels, and the number of dimensions in which two shapes overlapped determined the SS level (Figure 1B). Before entering the MRI scanner, the participants viewed the same object pairs for as long as they needed to learn the correct matches and then had 24 practice trials (the majority of participants needed only one practice session). The purpose of this training was to reduce any ambiguity about what constituted a match in the pres-
ent study (following the criteria of previous studies using the same procedure: Joseph, 1997; Joseph & Proff itt, 1996). During the f MRI study, on each trial of the animal- and shape-matching tasks, one picture appeared above and one below fixation (the entire display subtended an approximate visual angle of 4º). Each pair appeared for 400 msec, followed by 1,600 msec of fixation. The participants decided whether the two pictures represented the same object or different objects, and responses were recorded with an MRcompatible response device. The participants were instructed to fixate the crosshair at all times and to make responses as quickly and as accurately as possible (the participants could respond at any point during a trial). No feedback was given during the experiment. After the participants had completed the f MRI tasks in Experiment 2, we asked them to name the stimuli used in both matching tasks, to de-
STRUCTURAL SIMILARITY AND OBJECT RECOGNITION termine whether the animals and the 3-D shapes evoked similar names and semantic representations across individuals. The mean name agreement for animal stimuli (M 5 85.2%, SD 5 15.9%) was significantly higher than the mean name agreement for the 3-D shapes [M 5 35.6%, SD 5 22.3%; t(38) 5 7.8, p , .0001]. fMRI Design and Data Acquisition In Experiment 1, each participant completed two functional runs of animal matching, and in Experiment 2 each participant completed three functional runs: animal matching, shape matching, and a passive-viewing face and object recognition, reported elsewhere (Joseph & Gathers, 2002). The animal-matching run of Experiment 2 is referred to as Experiment 2-A, and the shape-matching run is referred to as Experiment 2-S. Twelve experimental task epochs (4 SS levels 3 3 repetitions for animal matching, and 3 SS levels 3 4 repetitions for shape matching) in pseudorandom order alternated with 12 fixation epochs in each functional run for the matching tasks. Eight volumes were collected per task epoch, and two volumes were collected per fixation epoch. Twenty-four experimental trials occurred in each task epoch, and the ratio of same to different trials within an epoch was randomly assigned as 5:7, 1:1, or 7:5. Although each task epoch contained “different” pairs from only one SS level, the same pairs were randomly determined within each epoch, so that there was no systematic variation of same pairs across blocks and, hence, across SS levels. A Siemens Vision 1.5 Tesla magnet equipped with a head coil for whole-brain imaging and a T-2*-weighted gradient echo sequence were used to collect functional brain images (40-msec echo time, 6-sec repetition time, 64 3 64 matrix, 230-mm field of view, forty-six 3-mm slices, acquired in ascending order, with a 20% gap). These parameters allowed whole-brain coverage with 3.6-mm 3 voxels. Data Analysis MEDx software (Sensor Systems, Sterling, VA) was used for f MRI data analysis, and SPSS (SPSS, Inc., Chicago, IL) was used for all scalar statistical analyses. After the first two fixation volumes of each participant’s time series were discarded, the remaining echoplanar images were realigned to the mean intensity image of the time series using a 6-parameter rigid-body model and the 3-D scanline chirp-Z algorithm with a least squares cost function for resampling, as is implemented in automated image registration (AIR; Woods, Cherry, & Mazziotta, 1992). Gaussian filtering was applied to the motion-corrected time series (6-mm 3 filter and kernel size of 9 pixels), and the images were intensity normalized to scale the voxel intensities to a mean of 1,000. High-pass filtering using a period of 120 sec was applied to the data. Mean intensity images for the various experimental conditions were spatially normalized using the standardized stereotactic system of Talairach and Tournoux (1988). After data preprocessin g, several types of analyses, described below, were conducted (in Experiment 1, brain volumes were first averaged across the two functional runs). 1. To determine areas involved in object recognition for the animaland shape-matching tasks, a paired t test contrasted the experimental task (all of the SS task epochs combined) with baseline (all of the fixation epochs combined). Cluster detection conducted on the resulting z map (z score . 2.33, p , .01) identified major areas involved in object recognition. 2. To determine areas that were modulated by SS level in the animalmatching tasks, we first identified regions of interest (ROIs) using cross-correlation analysis in MEDx, in which a time series was constructed using the group condition mean for the combined fixation epochs as the first time point and, as the remaining time points, the 12 group condition means for each of the three repetitions of the four SS levels. This group-level time series was cross-correlated with two different reference waveforms. The first reference waveform was constructed from the mean SS rating (see Figure 1A) for each SS level (the fixation time point was assigned a value of 0) to determine areas showing f MRI-signal increases as SS level increased. The sec-
5
ond reference waveform (also 13 time points long) was constructed from the difference between the mean SS rating for each SS level and 1,000 (the maximum value on the SS scale). This waveform was used to detect brain regions showing greater f MRI signal to lower SS levels (the fixation time point was assigned a value of 0) and signal above baseline. Note that simply using the negative correlation map of the first cross-correlation would not yield this result, because the negative correlation map would reflect activation due to the baseline (or deactivation ). These two cross-correlations yielded statistical maps of Pearson r values, converted into z scores, and cluster detection was conducted on the resulting z maps. For shape matching, the time series was also 13 time points long (fixation mean as the first time point and 3 SS levels 3 4 repetitions for the remaining time points), but the reference waveform reflected the number of dimensions shared at each SS level (Figure 1B). The clusters emerging from these group-level cross-correlations served as ROIs for the following analyses. Because cross-correlation (as implemented in MEDx) operates on a group-averaged time series and does not provide information about the consistency of the effects of interest across participants, we conducted repeated measures analyses of variance (ANOVAs, using SPSS) within the ROIs isolated by cross-correlation. Scalar values for these ANOVAs were determined by first calculating spatially normalized mean intensity images for each SS level and fixation for each participant. These mean intensity images were then masked by each of the clusters derived from the cross-correlation maps, and mean intensity values within each ROI for each SS level and fixation were calculated. Percent change scores (each SS level 2 fixation) were submitted to a separate one-way repeated measures ANOVA (using SPSS) to assess the effect of SS on f MRI signal within each cluster. For these ANOVAs, the results of multivariate tests are reported when sphericity assumptions are violated; otherwise, the results of the univariate tests are reported (Hertzog & Rovine, 1985). Results are typically reported only for those clusters that both were signif icant in the group–level cross-correlation (z . 2.33, p , .01) and showed consistent effects across participants in the ANOVAs ( p , .05). In some cases, we report marginally significant effects (as assessed by the repeated measures ANOVAs) in Tables 1–4, but only for ROIs that emerged as significant in another experiment. 3. To determine ROIs that were modulated by behavior, four cross-correlations similar to the one described in (2) above were performed, except that the reference waveforms were constructed from the following four group-averaged behavioral measures: mean correct log-transformed reaction times (RTs) for different trials, mean errors for different trials, mean RTs for same trials, and mean errors for same trials. Cluster detection and repeated measures ANOVAs were then conducted, as has been described above. 4. Like the group-level cross-correlations, individual-participant cross-correlations were performed to determine which brain regions were modulated by SS level (using the same reference waveforms used in the group analyses). Cluster detections performed on individual participants used a z score threshold of 2.33 in some cases, but a threshold of 1.64 in cases in which few clusters were detected at 2.33. 5. We also were interested in the relationship between overall blood oxygenation level response signal within each ROI and overall RT or errors collapsed across SS level. Therefore, we also conducted four scalar Pearson correlations within each ROI using SPSS in which the average percent change for each participant was determined and correlated with average RT (collapsed across SS) on different trials, RT on same trials, errors on different trials, and errors on same trials. These data are used in our discussion of task difficulty.
RESULTS Behavioral Results As was expected, response latencies and errors collected from the participants in the magnet increased as SS in-
6
JOSEPH AND GATHERS
Figure 2. Behavioral results for the animal- and 3-D-shape-matching tasks. Logtransformed RT and errors as a function of SS level for same and different trials in (A) Experiment 1, (B) Experiment 2-A, and (C) Experiment 2-S. Error bars reflect within-participants confidence intervals (Loftus & Masson, 1994).
creased for the animal-matching task in both experiments (Figures 2A and 2B), which is consistent with the results of other behavioral studies that manipulated SS (Humphreys et al., 1988; Joseph & Proffitt, 1996). A repeated measures ANOVA revealed that the main effect of SS in Experiment 1 was significant for both errors [F(3,27) 5 53.1, p , .001] and RT [F(3,27) 5 5.8, p , .05]. “Same” responses were faster than “different” responses [F(1,9) 5 14.2, p , .05]. The SS effect was more pronounced for “different” than for “same” trials for both RT [F(3,27) 5 4.2, p , .05] and errors [F(3,27) 5 57.0, p , .001], which reflects the manipulation of SS only on different trials and no systematic variation of SS across same trials. For Experiment 2-A, the main effect of SS was significant for errors [F(3,7) 5 13.8, p , .01] and was marginally significant for RT [F(3,7) 5 3.5, p 5 .078]. “Same” re-
sponses were faster and more accurate than “different” responses [F(1,9) 5 28.6, p , .0001 and F(1,9) 5 7.1, p , .05, respectively]. In addition, the SS effect was more pronounced on different trials for errors and RT [F(3,7) 5 23.2, p , .001, and F(3,27) 5 3.4, p , .05, respectively]. Because the objects of high-SS pairs look more similar than the objects of low-SS pairs do, the same–different decision requires more time and produces more errors in the high-SS condition than in the low-SS condition. The same behavioral profile emerged when the 3-D shapes were matched (Figure 2C), which suggests that the structural similarity principle is not reserved only for meaningful and nameable objects. Errors increased as SS level increased [F(2,18) 5 41.8, p , .0001], and “same” responses were faster and more accurate than “different” responses [F(1,9) 5 10.2, p , .011, and F(1,9) 5 16.3,
STRUCTURAL SIMILARITY AND OBJECT RECOGNITION
7
Figure 3. Group-averaged statistical maps showing activation associated with the perceptual matching tasks versus fixation in all three experiments. Displayed voxels are significant at p < .01.
p , .01, respectively]. In addition, the SS effect was more pronounced on different trials than on same trials for both RT and errors [F(2,8) 5 21.5, p , .001, and F(1,9) 5 16.3, p , .01, respectively]. In Experiment 2, responses were faster and more accurate for 3-D-shape matching than for animal matching [F(1,9) 5 19.0, p , .002, and F(1,9) 5 65.9, p , .0001, respectively]. Areas Involved in Object Recognition Not surprisingly, animal matching recruited large portions of the ventral processing stream relative to visual fixation (Figure 3). The bulk of the activation occurred in bilateral OT cortex, and these clusters were centered in the left and right posterior fusiform gyri (BA 19). Other areas of activation included the left and right intraparietal sulcus (BA 7/40), the left central sulcus (BA 3/4), the right middle frontal gyrus (BA 9), and the right cerebellum. OT Areas Modulated by Structural Similarity The parametric design of the present study allowed us to isolate brain regions that were sensitive to varying lev-
els of SS. We first focused on OT cortex using a crosscorrelation analysis that isolated regions that were more sensitive to high SS than to low SS, thereby demonstrating a bias toward processing structural descriptions. As was described in the Method section, the reference waveform was constructed from the mean SS ratings shown in Figures 1A and 1B. In Table 1, the OT regions that were sensitive to high SS in all three experiments are summarized. In Experiment 1, two left fusiform regions showed increased f MRI signal as SS level increased. Both of these regions—the left mid- to anterior fusiform gyrus (BA 20/ 37) and the left midfusiform gyrus (BA 37)— showed consistent SS effects across participants, according to repeated measures ANOVAs. The left midfusiform region (BA 37) also emerged in Experiments 2-A and 2S for animal and shape matching, whereas the more anterior locus (BA 20/37) replicated only for shape matching. The right anterior fusiform gyrus (BA 20) was isolated in both animal-matching tasks but not in the shape-matching task. Figure 4 shows the clusters summarized in Table 1 (yellow voxels). Note that in all three experiments the left
8
JOSEPH AND GATHERS Table 1 Ventral Processing Stream Areas Sensitive to High Structural Similarity in the Matching Tasks of Experiments 1 and 2 Experiment
x, y, z Cluster Size (voxels) Peak z Score Effect of SS 237 249 224 19 3.47† F(3,7) 5 4.9, p , .05 243 259 217 110 3.78* F(3,7) 5 13.0, p , .01 249 257 228 19 2.91‡ F(3,30) 5 4.0, p , .05 248 263 218 45 3.88* F(2,20) 5 7.4, p , .01 243 247 231 19 3.08† F(2,20) 5 4.2, p , .05 139 239 228 42 3.01† F(3,7) 5 2.9, p 5 .10 146 238 222 21 3.38† F(3,30) 5 3.5, p 5.05 138 220 220 16 2.91‡ F(3,30) 5 3.2, p , .05 126 17 245 36 3.78* F(3,7) 5 4.3, p 5 .05 Note—L, left; R, right; FG, fusiform gyrus; BA, Brodmann’s area; x, medial–lateral coordinate; y, anterior–posterior coordinate; z, inferior–superior coordinate; SS, structural similarity. Italics indicate loci at the border of the cerebellum and the fusiform gyrus according to the MNI template in MEDx. *p , 1024. †p , 1023. ‡ p , 1022. 1 1 2-A 2-S 2-S 1 2-A 2-A 1
Area
BA
L mid-FG 20/37 L mid-FG 37 L mid-FG 37 L mid-FG 37 L mid-FG 37 R ant-FG 20 R ant-FG 20 R ant-FG 20 R Temporal Pole 20/38
midfusiform gyrus was sensitive to high SS. To confirm that similar anatomical regions were activated in the three experiments, we determined the degree of overlap in standardized space among the areas reported in Table 1. Overlaps of at least 1 voxel were found for the left midfusiform region in Experiment 1 (243 259 217) and the left midfusiform region in Experiment 2-A (249 257 228), as well as for the right anterior fusiform region in Experiment 1 (139 239 228) and the right anterior fusiform region in Experiment 2-A (146 238 222). Total overlap for these regions was 6 voxels. The left midfusiform region of Experiment 1 (243 259 217) overlapped with the left midfusiform region of Experiment 2-S (248 263 218) by 5 voxels. To determine whether any ventral visual or temporal regions are more sensitive to large differences in object structure (low SS) than to small differences in object structure (high SS), as was the case in our previous study (Joseph et al., 2000), a second cross-correlation analysis isolated regions that showed systematic decreases in signal as a function of SS. Importantly, these decreases in signal reflect task-relevant activation (i.e., activation greater than the fixation baseline task), but in a pattern reciprocal to the increases in signal described above. In Experiment 1, this cross-correlation revealed three ventral visual stream regions that showed decreased f MRI signal as SS level increased: the left inferior occipital gyrus (BA 19), the right inferior occipital gyrus (BA 19), and the right lingual gyrus (BA 18), all of which showed consistent SS effects across participants (Table 2 and Figure 4A, blue voxels). Inferior occipital regions associated with decreasing signal as a function of SS were extensive and more posterior than the fusiform regions associated with resolving high SS in Experiment 1. In the animal-matching task of Experiment 2, similar posterior fusiform and inferior occipital regions showed sensitivity to low SS, as in Experiment 1, but these regions were not as extensive as those in Experiment 1. In the shape-matching task, only the right lingual gyrus was sensitive to low similarity; inferior occipital and posterior fusiform regions were not. Overlaps of at least 1 voxel were found for the left inferior occipital regions of Experiment 1 (240 280 220) and Experi-
ment 2-A (239 280 221) and for the right posterior fusiform regions of Experiment 1 (136 271 217) and Experiment 2-A (148 271 219). Total overlap for these regions was 24 voxels. The right lingual region of Experiment 1 (14 297 27) overlapped with the right lingual region of Experiment 2-S (18 2104 24) by 1 voxel. Note that in all three experiments an overall pattern of reciprocal increases and decreases emerged in anterior and posterior ventral visual regions, respectively, as is shown in Figure 4. The previous analyses demonstrated that the change in signal as a function of SS within the regions outlined in Tables 1 and 2 was consistent across participants. In other words, the signal changes were not likely carried by only a few individual participants’ patterns. However, we next determined whether the clusters of activation detected in the group–level activation maps were also detectable in individual participants. Tables 3 through 5 outline the individual-participant clusters of activation that overlapped with or were situated nearby (as indicated in italics) the group clusters after spatial normalization for each of the three experiments. A majority of the participants showed activation that was colocalized with or proximal to the group clusters, especially for the left midfusiform gyrus in all three experiments and for inferior occipital and posterior fusiform regions for animal matching. The anterior fusiform regions, however, were not detected as often in individual participants. Although mid to anterior aspects of the fusiform gyrus show greater sensitivity to high SS and the posterior fusiform gyrus and portions of the ventral occipital lobes are more sensitive to low SS, a large portion of OT cortex showed no modulation by SS. Figure 5A shows the overlap between voxels that showed an overall task effect based on the task-versus-fixation contrast (red) and voxels that were sensitive to increasing (yellow) or decreasing (blue) SS levels in Experiment 1. Importantly, those regions that showed SS modulation (yellow and blue voxels) lie in the anterior and posterior extents of OT cortex. The average signal across voxels that showed an overall task effect but no sensitivity to SS level (exclusively red voxels) is shown in Figure 5B (red line). As expected, this
STRUCTURAL SIMILARITY AND OBJECT RECOGNITION
9
(A )
(B )
(C )
– 2 6
– 2 4
– 2 2 T a la ir a c h
– 2 0
z- c o
– 1 8
– 1 6
o r d in a t e
Figure 4. Group-averaged OT regions (–26 to –16 mm inferior to a plane through the anterior and posterior commissures) modulated by structural similarity (SS) level consistently across subjects for the animal-matching task of (A) Experiment 1 and (B) Experiment 2-A, and for the shape-matching task of (C) Experiment 2-S. Yellow-coded voxels show a significant fMRI signal increase as SS level increased (see Table 1), and blue-coded voxels show a significant fMRI signal decrease as SS level increased (see Table 2).
function is flat in comparison with the functions for increases and decreases (yellow and blue lines, respectively). A two-way repeated measures ANOVA on SS level and modulation (increases, decreases, and no SS effect) confirmed this interaction [F(6,4) 5 12.3, p , .05].
OT Areas Correlated with Behavior for the Matching Tasks Given that increases in SS led to longer response latencies and more errors on different trials, we were interested in whether f MRI signal could be predicted by the RT and
Table 2 Ventral Processing Stream Areas Sensitive to Low Structural Similarity in the Matching Tasks of Experiments 1 and 2 Experiment
Area
BA
x, y, z
Cluster Size (voxels)
Peak z Score
Effect of SS
1 2-A 1 2-A 1 2-S
L IOG L IOG R post-FG R post-FG R LG R LG
19 19 19 19 17/18 17
240 280 220 239 280 221 136 271 217 148 271 219 14 297 27 18 2104 24
218 76 230 23 83 15
4.15* 4.08* 3.56† 4.08* 4.08* 3.28†
F(3,7) 5 8.5, p , .01 F(3,30) 5 2.6, p 5 .08 F(3,27) 5 3.2, p , .05 F(3,8) 5 10.4, p , .01 F(3,27) 5 3.0, p , .05 F(2, 20) 5 2.7, p 5 .10
Note—L, left, R, right; IOG, inferior occipital gyrus; FG, fusiform gyrus; LG, lingual gyrus; BA, Brodmann’s area; x, medial– lateral coordinate; y, anterior–posterior coordinate; z, inferior–superior coordinate; SS, structural similarity. Italics indicate locus at the border of the cerebellum and the fusiform gyrus according to the MNI template in MEDx. *p , 1024. †p , 1023.
10
JOSEPH AND GATHERS Table 3 Individual Participants’ Activations That Correspond to Group Activations in OT Cortex for Experiment 1 L Midfusiform
Participant 1 2 3 4 5 6 7 8 9 10
237 249 224 243 259 217 – – 248 258 214 250 256 218 – 236 250 224 244 256 216 256 249 218 255 270 28 246 266 218 232 260 220 244 250 222 244 254 216
R Ant. FG
L Inf. Occipital
R Post. FG
R Lingual g.
139 239 228
240 280 220
136 271 217
14 297 27
146 238 226
240 282 214 234 284 214 246 286 212 236 286 214 238 280 220 230 292 214
136 276 216 136 278 216 142 270 216 124 280 218 154 264 210 142 264 216
16 290 214 112 296 214 – 0 280 216 – –
238 284 222
132 284 214
16 298 210
224 290 214 – 234 284 214
– 146 286 212 140 262 216
– – 210 286 212
138 238 224 – – – – – – – 134 234 228
Note—L, left; R, right; FG, fusiform gyrus; Ant., anterior; Inf., inferior; Post., posterior; g., gyrus.
error functions illustrated in Figure 2. To that end, we determined areas that were correlated with group-averaged behavioral responses to the varying degrees of SS (see Analysis 3 of the Method section). Some of the same fusiform areas that were sensitive to high SS in Table 1 also showed modulation by correct RT on “different” trials. For animal matching in Experiment 1, the left midfusiform gyrus (BA 37) showed increasing signal as RT increased (cluster size 5 26 voxels, peak z score 5 3.55, p , .001). Likewise, for shape matching in Experiment 2S, the left midfusiform gyrus was modulated by increases in RT (cluster size 5 61 voxels, peak z score 5 4.08, p , .0001). In Experiment 2-A, the right anterior fusiform gyrus (BA 20) was modulated by RT on “different” trials (cluster size 5 14 voxels, peak z score 5 3.17, p , .001). The finding that the RT functions also predicted f MRI signal in fusiform regions is not surprising, given that RT increases as SS level increases. However, only RT on “different” trials predicted f MRI signal in some of the regions outlined in Table 1. RT on “same” trials and errors for “same” and “different” trials did not predict signal in
any of the ventral visual stream regions isolated in the present study. Other Cortical Regions Modulated by Structural Similarity We also explored whether resolving high SS in these perceptual matching tasks would make greater demands on relatively more anterior cortical regions outside of the ventral visual stream than would processing low SS. In general, this hypothesis was confirmed in that more cortical regions emerged as sensitive to high SS than to low SS (compare Tables 6 and 7), and the regions sensitive to high SS were more anterior than those sensitive to low SS, with the exception of one region in Experiment 2-A. One region that emerged as sensitive to high SS in all three experiments was inferior parietal cortex. Left inferior parietal cortex, including the intraparietal sulcus, was sensitive to high SS in both animal-matching experiments, whereas right inferior parietal cortex was sensitive to high SS in the shape-matching task. In contrast, the superior parietal lobule was more strongly implicated in low-SS
Table 4 Individual Participants’ Activations That Correspond to Group Activations in Experiment 2–A L Midfusiform
R Ant. fusiform
L Inf. Occipital
R Post. FG
Participant
249 257 228
146 238 222
239 280 221
148 271 219
1 2 3 4 5 6
2 241 254 221 240 263 215 – – 243 269 25
135 242 224 – – 151 242 211 – –
246 286 216 220 292 216 244 288 26 232 284 212 – 248 282 214
7 8
– 243 255 227 237 258 213 231 251 218 250 256 226
134 240 225 132 247 224
– 242 278 210
136 262 224 148 268 218 146 284 212 140 260 228 – 126 274 220 140 260 220 134 296 210 –
– 146 242 224
– –
9 10
122 290 220 150 272 214 11 244 242 226 142 254 226 236 274 228 2 Note—L, left; R, right; FG, fusiform gyrus; Ant., anterior; Inf., inferior; Post., posterior.
STRUCTURAL SIMILARITY AND OBJECT RECOGNITION
11
Table 5 Individual Participants’ Activations That Correspond to Group Activations in Experiment 2-S L Midfusiform
L Ant. fusiform
R Lingual g.
Participant
249 263 218
243 247 231
18 2104 24
1 2 3 4 5 6 7 8 9 10 11
– 250 260 216 250 270 214 244 266 218 – 246 264 218 – 252 258 216 246 260 222 246 264 222 244 266 220
– 2 242 248 232 – – 246 250 228 – 2 242 250 228 242 248 232 238 248 230
126 2100 28 116 286 218 16 270 14 21 289 113 114 260 26 – – – 122 2104 16 18 2102 26 16 2102 24 Note—L, left; R, right; FG, fusiform gyrus; Ant., anterior; Inf., inferior; Post., posterior; g, gyrus.
matching in Experiment 1, and this region was relatively more posterior than the inferior parietal locus implicated in high-SS matching. However, this superior parietal region did not emerge as significant in the other two experiments. Another region that was sensitive to high SS for animal matching but not shape matching was the right in-
ferior frontal gyrus (BA 44). The right medial frontal gyrus (BA 6) was sensitive to high SS for both matching tasks in Experiment 2. Midline cerebellum was sensitive to low SS in both animal-matching tasks (Table 7), but no other regions emerged across two or more experiments for low SS.
Decreases
Percent Signal Change
No SS modulation
(A)
Increases Increases
0.14
Decreases No effect
0.12 0.10 0.08 0.06
SS1
SS2
SS3
SS4
(B)
Figure 5. (A) Four slices from OT cortex (–18 to –12 mm inferior to a plane through the anterior and posterior commissures) show areas modulated by SS level (rendered in yellow and blue for increases and decreases, respectively) overlaid on areas that showed an overall task effect based on the task-versus-fixation contrast but no SS modulation (rendered in red) in Experiment 1 (excluding the marginally significant right anterior fusiform region). Voxels that showed both an overall task effect and decreasing signal as SS increased are rendered in purple, and voxels that showed a task effect and increasing signal as SS increased are rendered in orange. (B) Average percent signal change as a function of SS level across all voxels that showed increases (yellow line), decreases (blue line), and an overall task effect but no modulation by SS level (red line). Error bars reflect withinparticipants confidence intervals (Loftus & Masson, 1994).
12
JOSEPH AND GATHERS Table 6 Other Cortical Areas Sensitive to High Structural Similarity in the Matching Tasks of Experiments 1 and 2
Experiment
Area
BA
x, y, z
Cluster Size (voxels)
Peak z Score
Effect of SS
1 2-A 2-A 2-S 1 2-A 2-A 2-S 1 2-A 1 1 2-A 2-S
L IPS L IPL L SPL L SPL R Inferior Frontal R Inferior Frontal Medial Frontal Medial Frontal L Middle Frontal L Middle Frontal L Uncus L Central sulcus R Cerebellum R Frontal Pole
7 7 7 7 44 44 6 6 9/46 6 38 4
235 260 156 237 256 153 230 263 139 126 260 140 157 115 126 160 117 120 13 17 154 116 25 173 255 130 128 251 18 141 222 18 229 250 212 158 120 264 237 118 168 15
69 22 118 34 18 22 28 37 54 51 19 36 29 15
3.47† 3.85* 3.78* 3.08† 2.91‡ 3.44† 3.78* 3.47† 3.78* 3.78* 2.92‡ 3.47† 3.38† 3.08†
F(3,27) 5 4.2, p , .05 F(3,8) 5 3.2, p 5 .08 F(3,30) 5 4.7, p , .05 F(2,20) 5 4.5, p ,.05 F(3,27) 5 5.7, p , .01 F(3,30) 5 4.0, p , .05 F(3,8) 5 9.3, p , .01 F(2,9) 5 4.9, p , .05 F(3,27) 5 2.8, p 5 .07 F(3,30) 5 7.4, p , .01 F(3,27) 5 5.7, p , .01 F(3,7) 5 7.8, p , .05 F(3,30) 5 5.3, p ,.01 F(2,9) 5 5.4, p , .05
10
Note— L, left; R, right; IPS, intraparietal sulcus; IPL, inferior parietal lobule; SPL, superior parietal lobule; BA, Brodmann’s area; x, medial–lateral coordinate; y, anterior–posterior coordinate; z, inferior–superior coordinate; SS, structural similarity. *p , 1024. †p , 1023. ‡p , 1022.
Effect of Task Difficulty To address whether f MRI signal in regions modulated by SS are sensitive to task difficulty, apart from the SS manipulation, additional correlations were performed. As did other authors (e.g., Gold & Buckner, 2002), we examined the relationship of overall signal intensity (collapsed across SS level and expressed as percent change relative to fixation) and overall behavioral performance (collapsed across SS level) within each region that showed SS modulation in Tables 1, 2, 6, and 7. If f MRI signal is largely driven by task difficulty that is not related to the experimental manipulation, then those participants who found the task more difficult overall (as indexed by longer RT and more errors) should also produce greater signal in these regions. In other words, the correlations between average signal and average RT or errors should be positive if task difficulty drives responses in a given region (see Analysis 5 of the Method section). None of these correlations was significant and positive in any of the fusiform regions that showed sensitivity to high SS, indicating that the f MRI response in anterior fusiform regions is not driven by overall task difficulty, but it is sensitive to difficulty driven by the SS manipulation. However, task difficulty (errors) was negatively correlated with f MRI signal in the left anterior fusiform gyrus (r 5 2.64, p 5 .05, n 510) in Experiment 1 and in the right anterior fusiform gyrus (r 5 2.72, p , .05, n 5 10) in Experiment 2-A.
The negative correlation indicates that better performers (i.e., those with fewer errors) produced greater f MRI signal than did less accurate performers. Hence, activation in these anterior fusiform regions was not associated with greater difficulty of responding but with ease of responding. In contrast, f MRI signal in some of the other cortical regions presented in Tables 6 and 7 was driven by task difficulty. In Experiment 2-A, left inferior parietal cortex showed marginally greater signal as difficulty increased, as is indicated by errors (r 5 .59, p 5 .075, n 5 10). In other words, this region showed sensitivity to task difficulty apart from the SS manipulation. The right medial frontal gyrus was also sensitive to overall task difficulty in both Experiments 2-A and 2-S. In Experiment 2-S, f MRI signal was positively correlated with RT (r 5 .68, p , .05, n 5 10), suggesting that individuals who took longer to respond also had greater signal in this region. Interestingly, however, f MRI signal was negatively correlated with errors (r 5 2.64, p , .05, n 5 10), suggesting that individuals who made fewer errors had greater signal in this region. Taken together, this pattern suggests that f MRI signal in the right medial frontal gyrus was greater for those individuals who took longer to respond but were more accurate. Individuals who adopted the opposite strategy (respond more quickly at the expense of making more errors) did not activate this region as
Table 7 Other Cortical Areas Sensitive to Low Structural Similarity in the Matching Tasks of Experiments 1 and 2 Experiment
Area
BA
x, y, z
Cluster Size (voxels)
Peak z Score
Effect of SS
1 1 1 2-A 2-A
L SPL L SPL / MOG Midline Cerebellum Midline Cerebellum R Inferior Frontal
7 7
227 270 138 128 276 122 23 263 224 23 268 225 152 136 218
34 71 86 34 22
3.38* 3.40* 2.76† 3.38* 3.38*
F(3,7) 5 3.7, p 5.07 F(3,27) 5 7.5, p , .01 F(3,27) 5 9.3, p , .01 F(3,30) 5 5.1, p , .01 F(3,8) 5 6.9, p , .05
47
Note—L, left; R, right; SPL, superior parietal lobule; MOG, middle occipital gyrus; BA, Brodmann’s area; x, medial–lateral coordinate; y 5 anterior–posterior coordinate; z, inferior–superior coordinate; SS, structural similarity. *p , 1023. †p , 1022.
STRUCTURAL SIMILARITY AND OBJECT RECOGNITION strongly. In Experiment 2-A, f MRI signal in the right medial frontal gyrus was negatively correlated with errors (r 5 2.72, p 5 .02, n 5 10), as in Experiment 2-S, indicating that more accurate performers produced greater signal than did less accurate performers. It should be noted that these correlations are conducted on very small samples; therefore, we interpret these findings cautiously. DISCUSSIO N The present findings demonstrate a direct relationship between processing structural object descriptions and f MRI signal changes in OT cortex. In other studies, image properties have been manipulated in object-recognition tasks (e.g., scrambling, degrading, or reducing exposure duration) to produce differences in f MRI or PET signal, and cognitive processing differences have been inferred from those manipulations. In contrast, in the present study we did not alter the object images; instead, we parametrically varied the degree of SS between two objects in a perceptual matching task. This manipulation of SS was based on normative similarity ratings collected previously (Joseph, 1997), thereby capturing a psychologically relevant dimension—namely, perceived similarity among objects. Importantly, we have shown that our main experimental manipulation resulted in changes in RT and errors, which, we argue, is critical for demonstrating that this manipulation affects information processing during object recognition. We first showed that OT regions are sensitive to parametrically varied degree of overlap in object structure, so that f MRI signal in the midfusiform gyrus increased as SS level increased. The left midfusiform region that was sensitive to high SS in all three experiments in the present study may correspond to the ventral anterior vertex of the functionally defined LO complex (Grill-Spector, Kushnir, Hendler,et al., 1998; Malach et al., 1995). However, this conclusion is based solely on the similarities of the Talairach coordinates in the present study and in those of Grill-Spector, Kushnir, Hendler, et al. (1998), and not on precise gyral or sulcal characterizations. Nevertheless, many other studies of object recognition have implicated regions similar to those implicated in the present study (see the review by Joseph, 2001). Although both left and right fusiform regions were modulated by SS in the present study, the left midfusiform gyrus was consistently activated in all three experiments and was detected more often in individual participants. One possible explanation for stronger involvement of the left than of the right fusiform gyrus is that the left fusiform gyrus may be involved in processing viewpoint-invariant object representations, whereas the right fusiform regions may be more involved in processing viewpoint-dependent representations (Vuilleumier et al., 2002). In the present study, objects within a pair were often presented in a different viewpoint or pose (see Figure 1). Therefore, deciding whether two objects were the same required matching across different viewpoints, which may have biased brain activation patterns to the left hemisphere.
13
We also showed that signal increases in the fusiform gyrus were predicted by correct response latencies during the matching task, implying that brain activation in OT cortex is critically linked to the shape-processing demands of object recognition. Other studies have also shown modulation of f MRI responses in fusiform regions as a function of object-recognition performance. For example, Bar et al. (2001) showed that f MRI signal in anterior fusiform regions increased linearly as recognition performance improved, and Grill-Spector, Kushnir, Hendler, & Malach (2000) found that the relationship between objectrecognition performance and f MRI signal was greater in the LOC than in other cortical regions. The present findings are in line with these other results in showing that f MRI signal in object-recognition areas is associated with behavioral performance. Interestingly, only correct RTs on different trials were associated with f MRI signal in object-processing areas; RTs on same trials and errors were not. This implies that a very specific aspect of structural processing—namely, time to correctly resolve SS—was associated with f MRI signal in left fusiform regions. Moreover, overall RT (collapsed across SS level) was not correlated with signal in these regions, implying that this activation does not reflect task difficulty apart from the SS manipulation. In addition to showing sensitivity to different levels of SS, the present study provided evidence of a spatially distributed response to object structure in the ventral processing stream. Relatively more anterior aspects of the fusiform gyrus showed greater signal when SS was highest, and relatively more posterior aspects of the fusiform gyrus and inferior occipital cortex showed greater signal when SS was lower. The difference between low and high SS is fairly subtle in that local features were fairly similar across SS levels. In fact, many of the animals that were used as stimuli in the low-SS pairs were also used in the high-SS pairs (and vice versa), but were paired with different animals to create higher or lower levels of similarity. Consequently, the differences in anterior and posterior activation in the present study cannot be explained by differences in local features. Instead, the posterior–anterior spatial distribution reflects different demands on processing higher level object structure. The same reciprocal posterior–anterior pattern emerged for both animal and 3-D-shape matching, indicating that semantic meaning and nameability are not likely mediating factors for this pattern, because shapes were not strongly associated with names. In addition, a similar posterior– anterior pattern was demonstrated in a previous f MRI study that involved structurally similar or structurally dissimilar animal naming, in which the pictures were presented one by one and participants were instructed to overtly produce names for them (Joseph et al., 2000). In the SS blocks, the animals had an average pairwise similarity rating of 671 on a scale of 1,000, and the structurally dissimilar blocks had an average of 279 (using the same similarity ratings as in the present study). Both structurally similar and structurally dissimilar naming recruited right posterior fusiform cortex (BAs 19 and 37),
14
JOSEPH AND GATHERS
but only SS animal naming recruited anterior ventral temporal cortex (BA 20). This finding demonstrates that the posterior–anterior pattern emerges for both perceptual matching and naming tasks. In the naming study, however, the activation associated with high SS was slightly more anterior than the activation associated with high SS in the present perceptual matching task. This pattern is consistent with the findings of a meta-analysis of stereotactic coordinates conducted by Joseph (2001), in which naming tasks activated relatively more anterior loci in ventral temporal cortex than did matching tasks. The present findings suggest that f MRI signal in mid– anterior fusiform regions reflect processing of object structure; however, alternative explanations for these findings must be considered. One possibility is that the greater f MRI signal to high SS in mid–anterior fusiform regions reflects greater attentional demands or cognitive effort that are independent of processing object structure. If a generalized attentional or difficulty mechanism were to account for the data, then the most cognitively demanding condition—high SS—should be associated with the greatest signal. However, as is shown in Figure 5B, the average signal associated with increases in mid–anterior fusiform regions was not significantly greater than the average signal associated with decreases in posterior fusiform and inferior occipital regions. In other words, the easier (low-SS) condition produced greater signal in posterior regions than the more difficult (high-SS) condition did in mid– anterior fusiform regions. In addition, individual differences in overall task difficulty, indexed by long RTs or high error rates (collapsed across SS level), did not predict greater f MRI signal in mid–anterior fusiform regions. Instead, as in another recent study (Bar et al., 2001), activation in anterior fusiform regions was associated with more accurate performance, which would not be expected if task difficulty—apart from the SS manipulation—were driving signal here. One caveat about this conclusion, however, is that it is based on correlation analyses with low power. Nevertheless, other cortical areas did show modulation by overall task difficulty apart from the SS manipulation, which included the left inferior parietal lobule (Experiment 2-A) and the right medial frontal gyrus (Experiment 2-S). These cortical regions may be part of a frontoparietal attentional network that does not appear to be specific to processing visual input (Kanwisher & Wojciulik, 2000). Another argument against the proposal that f MRI signal in mid–anterior fusiform regions is driven by task difficulty rather than by structural object processing is that both the easier shape-matching task and the relatively more difficult animal-matching tasks activated an overlapping site in the left midfusiform gyrus. Again, f MRI signal here is not driven by overall task difficulty; rather, it is driven by changes in difficulty directly related to structural processing. Another alternative explanation is that greater cognitive effort that is independent of structural-object processing might account for the anterior shift in activation in the fusiform gyrus. In other words, any visual task that
is more difficult in nature would activate a relatively more anterior locus than would an easier task, in which task difficulty is indexed by more errors or longer RTs. One aspect of the present data that argues against this proposal is that in Experiment 2 the shape-matching task was easier than the animal-matching task, yet the activation was not more anterior in the left fusiform gyrus for the more difficult animal-matching task. Moreover, f MRI signal in the more anterior aspects of the fusiform gyrus was associated with better rather than worse performance. Therefore, the anterior shift in activation was not associated with greater task difficulty. Other evidence indicates that more difficult visual tasks are not necessarily associated with a more anterior activation locus than less difficult tasks. A recent f MRI study of OT responses as a function of whether or not objects were recognized (Bar et al., 2001) showed that correct recognition was associated with a more anterior locus of activation than incorrect recognition. In that study, correct recognition was associated with more accurate and faster performance (easier condition) rather than with less accurate and slower performance (more difficult condition). In fact, in the present study, anterior fusiform regions were also correlated with better performance, not with worse performance. In addition, Whatmough et al. (2002) recently showed that the fusiform gyrus was not sensitive to the difficulty of naming objects in a PET study. Considering both of those studies together with the present one, the anterior shift of activation for high SS does not likely reflect greater task difficulty that is independent of the demands to process object form or structure. We now consider how the present results fit in with the recent literature regarding the functional organization of OT cortex. One proposal is that objects are recognized through modules in OT cortex that are specialized for specific taxonomic categories (Downing et al., 2001; Epstein et al., 1999; Kanwisher et al., 1997). In the present study, we showed that different aspects of the ventral visual stream are activated depending not on taxonomic category but on demands on the processing of object structure. Both animals and geometric shapes activated colocalized regions of the fusiform gyrus, and animals and shapes activated both anterior and posterior aspects of the ventral visual stream. Therefore, taxonomic category may not be the best candidate for an overriding functional organizational principle; instead, demands on cognitive processing may be a more viable mechanism (Joseph, 2001). One cognitive mechanism that may drive ventral visual stream responses is the requirement of subordinate-level categorization in certain object-recognition tasks (Gauthier et al., 2000a). For example, faces are recognized at a more specific or subordinate level than other categories, and it is this requirement of greater individuation, rather than taxonomic category differences, that drives responses in midfusiform areas. A related mechanism that drives responses in midfusiform regions is perceptual expertise. Humans have much more experience in recognizing faces at a subordinate level than they have in recognizing other categories, and studies have shown that degree of expertise
STRUCTURAL SIMILARITY AND OBJECT RECOGNITION drives responses in fusiform areas that respond strongly to faces (Gauthier et al., 2000; Gauthier et al., 1999). The requirement of increased perceptual differentiation is common to both the present framework and the subordinatelevel categorization approach. The main point of diversion between the two approaches is the requirement of perceptual expertise. It is clear that our participants were not experts in this perceptual matching task, as is indicated by the high error rates. Also, we minimized learning effects by not providing feedback during the experiment. Consequently, activation in the midfusiform gyrus in the present study cannot be explained by perceptual expertise. Another possible mechanism proposed for the functional organization of the ventral visual stream is a shift from the processing of local object features in posterior regions to that of more holistic or global representations in anterior regions (Gerlach et al., 2002; Lerner et al., 2001). The present results are compatible with such an explanation in that objects that have little overlap at the level of structural descriptions (low SS in the present study) are also less likely to have similar contours, edges, or other local features that can be extracted from an image. Consequently, detection of local object features may be sufficient for deciding whether two low-SS objects are different, and this type of processing takes place in relatively more posterior aspects of the ventral visual stream. However, to discriminate high-SS objects, a comparison of local image features is not sufficient, so objects are compared on the basis of more complex features or holistic representations. This results in stronger f MRI signal in relatively more anterior aspects of the ventral visual stream. The question remains as to whether activations in the fusiform gyrus represent bottom-up integration of local image features into holistic representations, or whether contact with stored structural and semantic representations also takes place here. In the present study, high-SS matching for both 3-D shapes and animals led to greater f MRI signal in the left mid–anterior fusiform gyrus, indicating that activation in this region did not depend on access to stored structural or semantic knowledge, because those associations were not very strong for the 3-D shapes. However, only animal matching led to greater activation of the right anterior fusiform gyrus, implying that contact with stored structural and possibly semantic knowledge recruits even more anterior extents of the fusiform gyrus. Gerlach et al. ( 2002) have provided evidence that favors this proposal. In their study, only recognizable intact and contour-deleted stimuli activated anterior extents of the fusiform gyrus, whereas unrecognizable contour-deleted stimuli did not. They propose that these more anterior foci of activation reflect access to or activation of structural descriptions (Gerlach et al., 2002). In this study, we have directly manipulated the demands on processing structural information to confirm this proposal. However, we cannot rule out the possibility that these anterior extents of activation are related only to structural object processing; they may also reflect semantic activation.
15
In conclusion, OT cortex is implicated in processing higher order object representations. The present study has contributed to that body of research by directly demonstrating a graded response in human midfusiform regions to varying degrees of overlap in object structure. In addition, the present data suggest a functional organization in OT cortex in which anterior regions are more sensitive to high SS than are posterior regions. The anterior shift in brain activation may reflect a transition from perceptual to structural object processing, in line with cognitive and computational accounts of object recognition (Biederman, 1987; Marr & Nishihara, 1978) and with a recent f MRI study that also showed an anterior shift in activation as objects were more accurately identified (Bar et al., 2001). However, future research is needed to disambiguate the neural substrates involved in processing perceptual, structural, and semantic object representations. Nevertheless, similar mid- to anterior fusiform regions have been previously associated with face recognition (Kanwisher et al., 1997), subordinate categorization (Gauthier et al., 1997), and perceptual expertise (Gauthier et al., 2000; Gauthier et al., 1999), yet none of those variables was manipulated in the present study. Consequently, the present data show that, in addition to these other approaches to the functional organization in OT cortex, similarity of object structure must also be considered. REFERENCES Baldwin, D. A. (1989). Priorities in children’s expectations about object label reference: Form over color. Child Development, 60, 1291-1306. Bar, M., Tootell, R. B. H., Schacter, D. L., Greve, D. N., Fischl, B., Mendola, J. D., Rosen, B. R., & Dale, A. M. (2001). Cortical mechanisms specific to explicit object recognition. Neuron, 29, 529-535. Biederman, I. (1987). Recognition-by-components: A theory of human image understanding. Psychological Review, 94, 115-147. Buckner, R. L., Petersen, S. E., Ojemann, J. G., Miezin, F. M., Squire, L. R., & Raichle, M. E. (1995). Functional anatomical studies of explicit and implicit memory retrieval tasks. Journal of Neuroscience, 15, 12-29. Creem, S. H., & Proffitt, D. R. (2001). Defining the cortical visual systems: “What,” “where,” and “how.” Acta Psychologica, 107, 43-68. Davidoff, J. (1991). Cognition through color. Cambridge, MA: MIT Press. Downing, P. E., Jiang, Y., Shulman, M., & Kanwisher, N. (2001). A cortical area selective for visual processing of the human body. Science, 293, 2470-2473. Epstein, R., Harris, A., Stanley, D., & Kanwisher, N. (1999). The parahippocampal place area: Recognition, navigation, or encoding? Neuron, 23, 115-125. Gauthier, I., Anderson, A. W., Tarr, M. J., Skudlarski, P., & Gore, J. C. (1997). Levels of categorization in visual recognition studied using functional magnetic resonance imaging. Current Biology, 7, 645-651. Gauthier, I., Skudlarski, P., Gore, J. C., & Andersen, A. W. (2000). Expertise for cars and birds recruits brain areas involved in face recognition. Nature Neuroscience, 3, 191-197. Gauthier, I., Tarr, M. J., Anderson, A. W., Skudlarski, P., & Gore, J. C. (1999). Activation of the middle fusiform “face area” increases with expertise in recognizing novel objects. Nature Neuroscience, 2, 568-573. Gauthier, I., Tarr, M. J., Moylan, J., Skudlarski, P., Gore, J. C., & Anderson, A. W. (2000a). Does visual subordinate-level categorisation engage the functionally defined fusiform face area? Cognitive Neuropsychology, 17, 143-163. Gauthier, I., Tarr, M. J., Moylan, J., Skudlarski, P., Gore, J. C., &
16
JOSEPH AND GATHERS
Anderson, A. W. (2000b). The fusiform “face area” is part of a network that processes faces at the individual level. Journal of Cognitive Neuroscience, 12, 495-504. Gerlach, C., Aaside, C. T., Humphreys, G. W., Gade, A., Paulson, O. B., & Law, I. (2002). Brain activity related to integrative processes in visual object recognition: Bottom-up integration and the modulatory influence of stored knowledge. Neuropsychologia, 40, 12541267. Gilaie-Dotan, S., Ullman, S., Kushnir, T., & Malach, R. (2001). Shape-selective stereo processing in human object-related visual areas. Human Brain Mapping, 15, 67-79. Gold, B. T., & Buckner, R. L. (2002). Common prefrontal regions coactivate with dissociable posterior regions during controlled semantic and phonological tasks. Neuron, 35, 803-812. Grill-Spector, K., Kourtzi, Z., & Kanwisher, N. (2001). The lateral occipital complex and its role in object recognition. Vision Research, 41, 1409-1422. Grill-Spector, K., Kushnir, T., Edelman, S., It zchak, Y., & Malach, R. (1998). Cue-invariant activation in object-related areas of the human occipital lobe. Neuron, 21, 191-202. Grill-Spector, K., Kushnir, T., Hendler, T., Edelman, S., Itzchak, Y., & Malach, R. (1998). A sequence of object-processing states revealed by f MRI in the human occipital lobe. Human Brain Mapping, 6, 316-328. Grill-Spector, K., Kushnir, T., Hendler, T., & Malach, R. (2000). The dynamics of object-selective activation correlate with recognition performance in humans. Nature Neuroscience, 3, 837-843. Haxby, J. V., Gobbini, M. I., Furey, M., Ishai, A., Schouten, J. L., & Pietrini, P. (2001). Distributed and overlapping representations of faces and objects in ventral temporal cortex. Science, 293, 2425-2430. Hertzog, C., & Rovine, M. (1985). Repeated-measures analysis of variance in developmental research: Selected issues. Child Development, 56, 787-809. Humphreys, G. W., Riddoch, M. J., & Quinlan, P. T. (1988). Cascade processes in picture identification. Cognitive Neuropsychology, 5, 67103. Ishai, A., Ungerleider, L. G., Martin, A., & Haxby, J. V. (2000). The representation of objects in the human occipital and temporal cortex. Journal of Cognitive Neuroscience, 12(Suppl. 2), 35-51. Jolicœur, P., Gluck, M. A., & Kosslyn, S. M. (1984). Pictures and names: Making the connection. Cognitive Psychology, 16, 243-275. Joseph, J. E. (1997). Color processing in object verification. Acta Psychologica, 97, 95-127. Joseph, J. E. (2001). Functional neuroimaging studies of category specificity in object recognition: A critical review and meta-analysis. Cognitive, Affective, & Behavioral Neuroscience, 1, 119-136. Joseph, J. E., & Gathers, A. D. (2002). Natural and manufactured objects activated the “fusiform face area.” NeuroReport, 13, 935-938. Joseph, J. E., Jones, K. M., Zeffiro, T. A., & Eden, G. F. (2000). FMRI correlates of structural similarity in object naming. Society for Neuroscience Abstracts, 26 (Pt. 2), 1502. Joseph, J. E., & Proffitt, D. R. (1996). Semantic versus perceptual influences of color in object recognition. Journal of Experimental Psychology: Learning, Memory, & Cognition, 22, 407-429. Kanwisher, N. (2000). Domain specificity in face perception. Nature Neuroscience, 3, 759-763. Kanwisher, N., McDermott, J., & Chun, M. M. (1997). The fusiform face area: A module in human extrastriate cortex specialized for face perception. Journal of Neuroscience, 17, 4301-4311. Kanwisher, N., & Wojciulik, E. (2000). Visual attention: Insights from brain imaging. Nature Reviews, 1, 91-100. Kourtzi, Z., & Kanwisher, N. (2000). Cortical regions involved in perceiving object shape. Journal of Neuroscience, 20, 3310-3318.
Kourtzi, Z., & Kanwisher, N. (2001). Representation of perceived object shape by the human lateral occipital complex. Science, 293, 1506-1509. Krieman, G., Koch, C., & Fried, I. (2000). Category-specific visual responses of single neurons in the human medial temporal lobe. Nature Neuroscience, 3, 946-953. Landau, B., Smith, L. B., & Jones, S. S. (1988). The importance of shape in early lexical learning. Cognitive Development, 3, 299-321. Lerner, Y., Hendler, T., Ben-Bashat, D., Harel, M., & Malach, R. (2001). A hierarchical axis of object processing stages in the human visual cortex. Cerebral Cortex, 11, 287-297. Lerner, Y., Hendler, T., & Malach, R. (2002). Object-completion effects in the human lateral occipital complex. Cerebral Cortex, 12, 163177. Levy, I., Hasson, U., Avidan, G., Hendler, T., & Malach, R. (2001). Center-periphery organization of human object areas. Nature Neuroscience, 4, 533-539. Loftus, G. R., & Masson, M. E. J. (1994). Using confidence intervals in within-subject designs. Psychonomic Bulletin & Review, 1, 476-490. Malach, R., Reppas, J. B., Benson, R. R., Kwong, K. K., Jiang, H., Kennedy, W. A., Ledden, P. J., Brady, T. J., Rosen, B. R., & Tootell, R. B. H. (1995). Object-related activity revealed by functional magnetic resonance imaging in human occipital cortex. Proceedings of the National Academy of Sciences, 92, 8135-8139. Marr, D. (1982). Vision: A computational investigation into human representation and processing of visual information. San Francisco: Freeman. Marr, D., & Nishihara, H. K. (1978). Representation and recognition of the spatial organization of three-dimensional shapes. Proceedings of the Royal Society of London: Series B, 200, 269-294. Moore, C. J., & Price, C. J. (1999). A functional neuroimaging study of the variables that generate category-specific object processing differences. Brain, 122, 943-962. Op de Beeck, H., Beatse, E., Wagemans, J., Sunaert, S., & van Hecke, P. (2000). The representation of shape in the context of visual object categorization tasks. NeuroImage, 12, 28-40. Rosch, E., Mervis, C. B., Gray, W. D., Johnson, D. M., & BoyesBraem, P. (1976). Basic objects in natural categories. Cognitive Psychology, 8, 382-439. Schacter, D. L., Reiman, E., Uecker, A., Polster, M. R., Yun, L. S., & Cooper, L. A. (1995). Brain regions associated with retrieval of structurally coherent visual information. Nature, 376, 587-590. Talairach, J., & Tournoux, P. (1988). Co-planar stereotaxic atlas of the human brain (M. Rayport, Trans.). New York: Thieme Medical Publishers. Ungerleider, L. G., & Mishkin, M. (1982). Two cortical visual systems. In D. J. Ingle, M. A. Goodale, & R. J. W. Mansfield (Eds.), Analysis of visual behavior (pp. 549-586). Cambridge, MA: MIT Press. van Turennout, M., Ellmore, T., & Martin, A. (2000). Long-lasting cortical plasticity in the object naming system. Nature Neuroscience, 3, 1329-1334. Vuilleumier, P., Henson, R. N., Driver, J., & Dolan, R. J. (2002). Multiple levels of visual object constancy revealed by event-related f MRI of repetition priming. Nature Neuroscience, 5, 491-499. Whatmough, C., Chertkow, H., Murtha, S., & Hanratty, K. (2002). Dissociable brain regions process object meaning and object structure during picture naming. Neuropsychologia, 40, 174-186. Woods, R. P., Cherry, S. R., & Mazziotta, J. C. (1992). Rapid automated algorithm for aligning and reslicing PET images. Journal of Computer Assisted Tomography, 16, 620-633. (Manuscript received June 25, 2002; revision accepted for publication February 11, 2003.)