Songklanakarin J. Sci. Technol. 30 (3), 405-411, May - Jun. 2008 http://www.sjst.psu.ac.th
Original Article
Effects of temperature and concentration on thermal properties of cassava starch solutions Sopa Cansee1, Cumnueng Watyotha1, Thavachai Thivavarnvongs1, Juntanee Uriyapongson2, and Jatuphong Varith3 1
Department of Agricultural Engineering, Faculty of Engineering, 2
3
Department of Food Technology, Faculty of Food Technology, Khon Kaen University, Khon Kaen, 40002 Thailand.
Department of Agricultural and Food Engineering, Faculty of Agro-Industry, Maejo University, Chiang Mai, 50290 Thailand. Received 1 October 2007; Accepted 26 June 2008
Abstract The thermal properties and densities of cassava starch solutions (CSS) were studied as functions of temperature (3050oC) and concentration (20-50%w/w). Thermal conductivity (k) and specific heat (Cp) were determined by line heat source and mixture calorimetry methods, respectively, while density ( ) was determined by the pycnometer. The k value was in the range of 0.307-0.333 W/moC, which decreased as temperature and concentration increased. The Cp value was in the range of 3.354-4.004 kJ/kgoC, which also decreased as temperature and concentration increased. The value was in the range of 1044- 1120 kg/m3, which decreased with increasing temperature but increased with concentration. A multiple regression equation of thermal conductivity, specific heat and density was developed as a function of temperature and concentration. Keywords: cassava starch, thermal properties, assembled colorimeter, density
1. Introduction Cassava starch obtained from cassava roots is widely used in the food industry because of its high viscosity, clear appearance, and low production cost (Pongsawatmanit et al., 2006). Thailand produced 27.62 million tons of cassava roots in 2007 (The Thai Tapioca Trade Association, 2008) and has been the only country where modified starch from cassava has been produced in large quantity (Sriroth et al., 2002). Normally, modified starch is used in industrial applications for both food and non-food sectors as a wet-end additive, binder of coating pastes, etc. giving added value to raw cassava starch powder. To obtain the modified cassava *Corresponding author. Email address:
[email protected]
starch, raw cassava starch is used as a starting substrate and is dissolved in the form of a colloid solution, referred as cassava starch solution (CSS). Knowledge of the various physical properties of CSS is important for the design of various processing machines, especially for the modified cassava starch reactor, and to assist the design process for commercial production in relation to fluid flow and heat transfer. For example, a low heating rate in the reactor is required in the first step to initiate the CSS paste. In addition, during the filling period of chemical reagents, the quality of product significantly depends on the thermal properties of CSS. Therefore, thermal properties of CSS are useful for the prediction of the chemical reagent mixing period. Generally, the variation in temperature and concentration of CSS during modified starch processing greatly affects its thermal properties. Some important thermal proper-
406
S. Cansee et al. / Songklanakarin J. Sci. Technol. 30 (3), 405-411, 2008
ties of CSS include thermal conductivity (k), specific heat (Cp) and thermal diffusivity (α). Thermal properties for several foods and agricultural materials have been reported by Rahman (1995), Mohsenin (1980) and Sweat (1995). By definition, the k value is an intensive property of material indicating its ability to conduct heat. It is used primarily in Fourier’s Law for heat conduction. Measurement techniques of k values can be divided into two categories; steady state and transient techniques. Among the transient techniques, the line heat source method is rapid and applicable to nonconvective food and biological materials because moisture loss from food is minimal. Therefore, it is more popular using researchers in determining the thermal conductivity of food and biological materials compared to the steady state methods. An example of the transient measurement of k on some food materials has been recently reported by Opoku et al. (2006). Cp is defined as the amount of heat necessary to increase the temperature of a unit mass of a material by a unit degree. Rahman has reviewed four methods of measuring Cp; the method of mixture, the comparison method, the adiabatic method and the differential scanning colorimeter (DSC). DSC is a very accurate method to determine the Cp of agricultural materials, but it has the drawback of high equipment and operating costs (Sweat, 1995). The comparison method employs two cups in the calorimeter of the same size, same material, same exterior finish and of identical mass (Mohsenin, 1980), thus, the equipment is difficult to manufacture. The adiabatic method is appropriate for measuring the specific heat of frozen foods. It is simple and requires a short duration time (Rahman, 1995). The method of mixture is more popular for measuring Cp (Rahman, 1995) than the DSC method because it is simpler and less expensive. Earlier studies on thermal properties of starches focused on gelatinized starch gels. Wang and Hayakawa (1993) determined the k value of starch gels using the line heat source technique, and found values ranging from 0.4770 to 0.5667 W/m⋅K at 80 to 120oC with varied moisture content from 39.6 to 75% wet basis. Morley and Miles (1997) determined the k value of starch using line heat source technique in the range of water content from 51 to 97% by mass. The k values of hydrated starch (mass fraction of water 0.22) and dry starch were found to be 0.364, 0.386 and 0.388 W/m⋅K, and 0.293, 0.305 and 0.301 W/m⋅K at 10, 50 and 80oC, respectively. Additionally, data on the thermal properties of tomato juice concentrates (Choi and Okos, 1983), passion fruit juice (Gratão et al., 2005) and coconut milk (Tansakul and Chaisawang, 2006) have been reported. To date, however, there have been no reports on the k value of CSS. Many studies have been conducted to determine the thermal properties of different agricultural starches such as Amioca starch (Wang and Hayakawa, 1993), potato starch, waxy maize starch (Morley and Miles, 1997) and high amylose corn starch (Hsu and Heldman, 2004). However, we have found no such literature relating to the effect of temperature and concentration on the thermal properties of
CSS. Therefore the objective of this study is to determine the thermal properties e.g., k, Cp and density (ρ) of CSS to provide data for the design of a mixing reactor, which is one of the important unit operations in the chemical and biochemical reaction processes. 2. Materials and Methods 2.1 Material preparation Cassava starch powder obtained from Sanguan Wongse Industries Co., Ltd., Thailand was used in this study. The basic physical properties of starch reported by the company are a whiteness of 93.7%, a pH of 6.0, a sulphur dioxide concentration of 27.6 ppm, a viscosity of 720 BU and a pulp content of 0.02%. The CSS was prepared in a 500 mL beaker with distilled water by mixing cassava starch powder in specific ratio by weight. The k, Cp and ρ values were measured at temperatures of 30, 40 and 50oC, and concentrations of 20, 30, 40 and 50% by weight. These temperatures and concentrations were selected according to industry practice to process modified cassava starch. During heating, the mixing beaker was covered with aluminum foil to prevent moisture loss due to evaporating. The CSS sample was continuously stirred until ready for all analyses. The temperature samples were measured using pre-calibrated mercury and digital thermo-meters with a temperature accuracy within ±1oC. 2.2 Thermal conductivity measurement The k of CSS was measured using the line heat source method. A k-probe model number TC-18 (Thermologic Inc., Pullman, WA, USA) was used in this study. The k-probe consisted of a fine gauge heating wire and a type E thermocouple embedded in a stainless steel needle of 36.87 mm in length and 1.27 mm in diameter. The heating wire retained a resistance of 1041.5 ohm/m. The probe was calibrated in 99.5% glycerol (0.286 W/moC; Rahman, 1995), dry starch (0.216 W/moC; Roth and Tsao, 1970) and saturated starch granule (0.3486 W/moC; Mattea et al., 1986). The thermal conductivity measurements of CSS were conducted using the protocol proposed by Holeschovsky et al. (1996). The CSS sample was immediately taken from the beaker in water bath and a portion of 60 mL was placed in a plastic bottle covered with styrofoam to prevent heat loss for each treatment. The heating wire was connected to a power supply providing a current of 58.9 mA, resulting in a power rating of 4.25 W/m. The thermocouple wires were connected to a datalogger (Model 350-454, Testo AG, Lenzkirch, Germany) with a resolution of 0.01oC. The temperature was recorded at every 0.5 s for a total duration of 30 s. The temperature rises were plotted against the logarithm of time. The thermal conductivity value was calculated from a straight line section after a lag period using equation (1) (Yang et al., 2002; Opoku et al., 2006) as follows:
S. Cansee et al. / Songklanakarin J. Sci. Technol. 30 (3), 405-411, 2008
k=
I 2R 4 S
(1)
where k is the thermal conductivity (W/moC), I is the current (A), R is the specific resistance of the heating wire (Ω/m) and S is the slope determined from the data points (oC). 2.3 Specific heat measurement The specific heat was determined using the method of modified mixtures following the protocol proposed by Jindal and Murakami (1984). The specific heat calorimeter consisted of a vacuum flask with a styrofoam insulation cover to prevent heat loss. A rubber O-ring was attached to the edge of the flask to provide additional sealant for heat loss. Thermocouples of type K and size of 0.65 mm in diameter were inserted through the center of the lid into the calorimeter. The heat capacity of the vacuum flask calorimeter with a polyethylene bag was calibrated using distilled water and found to be 0.124 kJ/oC, which was within the range of reported values by Sabapthy and Tabil (2004) of 0.457 kJ/oC and Jindal and Murakami (1984) of 0.055 kJ/oC. A 500 mL sample of water with a temperature 20oC lower than the CSS sample was used for each measurement. The CSS samples were mechanically stirred and maintained at constant temperatures of 30, 40 and 50oC in the water bath. The starch solution sample was quickly weighed and put inside a polyethylene bag of size 127x203.2x0.025 mm to prevent mixing. The temperature changes of water and the CSS sample in the vacuum flask calorimeter were recorded every 1 min with a resolution of 0.1oC by a datalogger model DW-40BT T/C-V (ECD, Dataworker 10/40, Milwaukie, OR, USA). The vacuum flask calorimeter was continuously shaken to prevent sedimentation in order to reach peak temperature in about 10 min of treatment and then shaken every 5 min to reach equilibrium temperature in 120 min. A heat loss correction curve was determined. The specific heat of the CSS was calculated following the heat balance equation (2) as follows: CsWs(∆Ts) = CwWw(∆Tw) + Hc(∆Tc)
(2)
where C is the specific heat (kJ/kgoC), W is the weight (kg), ∆T is the difference between the initial temperature and the equilibrium temperature (oC), H is the heat capacity of the calorimeter (kJ/oC), and the s, w, and c subscripts refer to the starch solution, water, and calorimeter, respectively. 2.4 Density measurement The density of CSS was determined with pycnometers. Each pycnometer was calibrated with distilled water at 3070oC in 10oC increments to compensate for the change in pycnometer volume due to thermal expansion. The error in the density measurement due to thermal expansion was found to be 0.48% for this temperature range. For the CSS density
407
measurement, each measurement was conducted at a constant temperature using a water bath model WB/OB7-45 (Memmert, Germany) with a resolution of 0.1oC. To measure the density of CSS, the pycnometer was placed in a water bath without its lid to equilibrate the temperature distribution. When the CSS sample reached the specified temperature, it was immediately put into the pycnometer and covered with the lid to avoid external air interference. The pycnometer was removed from the water bath, excessive water was blotted with tissue paper and the pycnometer was then quickly weighed using a model AFP-720 balance with 0.001 g resolution. The density was calculated from the ratio of mass to volume of CSS. 2.5 Thermal diffusivity determination The thermal diffusivity (α) of CSS was calculated using the measured values of k, Cp and ρ, and the following equation (3) as: α=
k cp
(3)
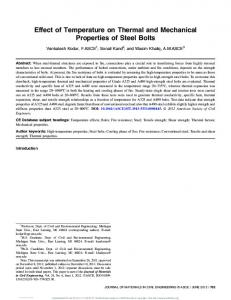
where k is the thermal conductivity (W/moC), α is the thermal diffusivity (m2/s), ρ is the density of CSS (kg/m3) and Cp is the specific heat (kJ/ kgoC). 2.6 Statistical analysis The thermal properties and density of CSS was studied at temperatures of 30, 40 and 50 °C and at concentrations of 20, 30, 40 and 50% w/w. A full factorial complete randomized design (CRD) was applied. Four replications of the Cp and ρ measurements were obtained for each treatment. The replications of the k measurements were in the range of 4-9 due to consideration from the coefficient of determination (r2). All statistical analyses were performed using SPSS version 10.0.1 (SPSS Inc., Chicago, IL, USA) for Windows. Analysis of variance (ANOVA) was performed and the average mean was analyzed by Duncan’s test at a p-value of 0.05. 3. Results and Discussion 3.1 Thermal conductivity (k) For the k measurements, the typical heating curves were obtained as shown in Figure 1. During the lag phase (initial heating), the temperature rise was less than 1.5oC. The temperature rise increased non-linearly in the lag phase for the first 5 s and increased linearly afterward. The temperature rise varied from 1 to 3oC during the linear phase for another 15 s. The temperature rise after 20 s became nonlinear again, possibly due to the effect of reflecting heat from container wall. Therefore, the experimental measurement of k on CSS was performed for the time interval of 5-20 s to avoid the effect of reflecting heat, as recommended by
408
S. Cansee et al. / Songklanakarin J. Sci. Technol. 30 (3), 405-411, 2008
2.5
Temperature rise (°C)
2.0
1.5
1.0
0.5
0.0 1
10 time (s)
100
Figure 1. Temperature rise of cassava starch solutions versus logarithm of time an example for 50%w/w concentration at a temperature of 30oC.
Zhang et al. (2005). Table 1 shows that the k value of CSS are in the range of 0.307 - 0.333 W/moC with a standard deviation varying from 0.003 to 0.012 W/moC. The k value significantly decreased (p