not an evident difference between mono and poly as well as with the rating power. From this ..... slow, they do not get aware of partial shading phenomena.
Efficiency Improvement of P&O Algorithms by Irradiance and Temperature Measurements Giuseppe Marco Tina, Giovanni Celsa, Fabio Cosentino University of Catania, DIEEI department, viale A. Doria, 6, Catania, Italy
Abstract— The measurements of global irradiance and temperature in a PV plant are quite common as they allow the monitoring of the system efficiency. In this paper these measurements are used to improve the performance of the classical P&O method for maximum power point tracking. The proposal algorithm can be used with both steady and variable operative conditions (irradiance and ambient temperature), as well as when there are shading or fault conditions that modify the I-V curve of the array, introducing one or more local maximum power points. The method is also based on a simplified model of the PV system that exploits the photovoltaic thermal coefficients. The method has been tested in simulation and the results are presented and discussed. Keywords—Photovoltaic; Maximum Power Point Tracking; Perturbate & Observe; Measurements
I.
INTRODUCTION
Nowadays the PV systems are spreading very quickly all over the world, to increase the cost- effectiveness of these systems, it is crucial to enhance the efficiency of the system, in such a way to increase the energy production during the technical life of the plant. Considering the different parts that compose a PV system, there are many areas where it is possible to work to improve the energy performances; these areas can be classified in technological (mainly materials and components) and operative (software of control, monitoring, maintenance). As far as the software of control is concerned, the most important is the maximum power point tracking logic (MPPT) implemented in the firmware of the photovoltaic invert. In fact it is compelling to extract the maximum power from the PV array over the variable operating conditions. In this context many MPPT techniques have been developed. Constant voltage, fractional open-circuit voltage (VOC), perturbation and observation, incremental conductance, neural net- works or fuzzy logic are some of the most used ones [1]. They can be classified into two groups: direct methods and indirect methods. Direct methods use the output power of the PV system as feed-back to search the MPP. Indirect methods measure other magnitudes, such as the short-circuit current, the open- circuit voltage or the temperature of the modules.
Abdelhamid Rabhi University of Picardie “Jules Verne”, Laboratory MIS, 33 Rue Saint Leu, Amiens, France
The most basic methods do not give very good MPPT performance. More sophisticated methods can provide better results, but they are more complex and more expensive. The most important problems of these four MPPT methods are malfunction with partial shading, wrong tracking direction, power oscillations around MPP, bad working with low irradiance and interruptions in the power generation. Special attention deserves the problem of MPPT when there are partially shaded conditions (PSCs) on PV modules, that can occur both in large as well as in small PV generation systems (PGSs). PSCs cause losses in system output power, hot spot effects, and system safety and reliability problems. When PSC occur, the PGS power–voltage characteristic curve exhibits multiple peak values; that is, the curve comprises a global maximum power point and multiple local maximum power points. An important criterion to define the effectiveness of an MPPT technique is to test it against shading [1]. To provide PGS researchers and engineers with useful reference information, [2] explores global maximum power point tracking (GMPPT) methods suitable for application in PSC. Basic operating principles of various GMPPT methods, including their advantages and limitations, are described. Regarding firmware-related techniques, various indices are evaluated, including whether the design parameters are relevant to the system, GMPPT time, GMPPT accuracy, algorithm complexity and required sensors. In terms of hardware-related techniques, the advantages and disadvantages of various architectures are discussed. The main idea of this research starts from the consideration that, nowadays, the PV systems are equipped with some sensors apt to check if the performance of the PV plant is good or not, if not some maintenance activities can start to eliminate the cause of inefficiency. As matter or fact many PV systems are equipped of monitoring and/or diagnostic systems. The two sensors mainly used are the irradiance sensor for the measurements of the solar radiation in the plane of the array and the PV module temperature sensor that is installed in the back of the PV modules. As a consequence, we have investigated the possibility of use these sensors to improve the efficiency of MPPT algorithm without requiring further hardware. Concerning the use of temperature based MPPT, there is an MPPT method, which is simple in implementation; cost wise is also cheaper and above all has a good tracking factor
[3]. Stating from the fact that open circuit voltage of the PV cell varies with the cell temperature whereas the short circuit current varies with the irradiance level. The temperature based method uses temperature sensors for tracking MPP, as MPP varies with temperature and MPPT algorithm along with temperature function is used to track MPP [4–6]. But this method suffers from certain disadvantages also, like PV array temperature is not uniform throughout also calibration of temperature sensor is a problem for precision measurement, which may cause wrong tracking also [6]. The information about the irradiance and temperature are used in the MPPT algorithms based ANN when PSC occur, in fact the irradiance of the module, module temperature and shading pattern all affect the MPP location. Consequently, the training data required by the ANN substantially increase, and these data are not easily collected. This is the primary limitation of applying ANNs to GMPP searches. Therefore, only works in [8] and [9] in current literature proposed using ANNs as the primary method for addressing PSC. The input variables used in [8] and [9] were the averaged irradiance of selected modules, and the design was affected by the arrangement method of PV modules. Therefore, if the architecture of the PV array changes (e.g., adding new PV panels), the ANN must be re-trained. In addition, irradiance and temperature sensors are more expensive compared with the voltage and current sensors used in other GMPP methods. The approach proposed in this paper is based on the idea of improving the performance of the MPPT algorithm already installed in the PV inverter, usually an P&O, by means of the use of both irradiance, without installing further hardware. Basically the measurements are used to build a reference power and MPP voltage of PV plant to detect the presence of shading over the PV array, otherwise the inverter is required to switch to the sweep mode [10], the voltage moves to the maximum (minimum) value of the MPP voltage range allowed by the inverter, to the minimum (maximum) in such way to find the global maximum power. II.
PV SYSTEM MODELS
The PV models required in this paper are strictly connected with the functioning of a PV inverter, specifically with the DC/DC part of the inverter and its MPPT logic of control. The two models have the same measured inputs, i.e. irradiance on the plane of array, “GT”, and the module temperature, “TPV”, whereas the outputs are, respectively: the maximum power, “MP”, and the voltage at maximum power point “VMP”. The prediction of PV module performance in terms of electrical power output in the field, that is, the deviation from the test conditions reported by the manufacturer of the module can be modelled by means of quite precise models based on single or double diode models or by means of simple correlations depending on operative and/or ambient variables [11]. The single diode PV module model consists of a single diode connected in parallel with a light generated current source (Iph) and two resistances (Rs and Rsh) that model the power losses, as shown in Fig. 1.
Rs
Ipv
Id Iph
Vd
Vpv
Rp
Load
Fig. 1. One-diode electrical PV module equivalent circuit
A current balance at a point to the left of Rs as shown in Fig. 1 and after substituting in Ohm’s law and the Shockley diode equation for the currents through the resistors and diode, respectively, yields the model characteristic equation, given by eq.1. 𝐼!" = 𝐼!! − 𝐼! 𝑒
!!" !!! !!" !! !! !!
−1 −
!!" !!! !!" !!
(1)
where: • Vpv = PV module voltage (V), • Ivp = PV module current (A), • Iph = light current (A), • Io = diode reverse saturation current (A) • Qd = ideality factor, • ns = number of cells in series, • Rs = series resistance (Ω), • Rp = shunt resistance (Ω) • VT= kTPV/q is the thermal voltage (V), k is Boltzmann’s constant, Tc is the cell temperature, and q is the charge of an electron. The use of such models is difficult for on-line applications due to the need to find the parameters of these models (up to five) that vary according to the operating conditions. The parameters of PV module model can be found mainly in two ways: 1) starting from the parameters calculated from the I-V curve at STC conditions and then using the translation equations [12]; 2) measuring periodically the I-V curve during the normal operation of the PV module and calculating the parameters. On the other hand it worth noticing that in a real operating conditions of the PV modules of a grid connected photovoltaic system work at maximum power point (MPP) due to the present of DC/DC converter where an algorithm for MPP tracking (MPPT) is implemented. In this context, we are interested in using simple correlations that provide a reference for the power produced by a PV module under the MPPT conditions. The prediction of PV module performance in terms of electric power output in the field, that is, the deviation from the standard test conditions reported by the
manufacturer of the module, is modeled by means of correlations of PV array power as a function of mainly operating temperature. In [11], Table 3 shows a list of such correlations; the most known and used model is given by the following equation: 𝑃!,! = 𝜂!"# 𝐴𝐺! 1 − 𝛽 𝑇! − 𝑇!"# + 𝛾 log!" 𝐺!
(2)
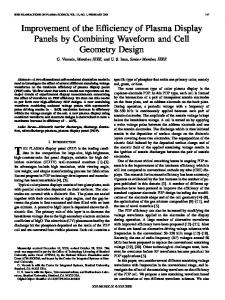
Where ηref is the reference module efficiency at a PV cell temperature Tref of 25°C and at a solar irradiance GT on the module equal to 1000 W/ m2. γ and β are, respectively, the solar irradiance and temperature coefficients for the PV module. TPV is the PV cell temperature, which depends on the environmental conditions. Generally, two of these parameters (ηref, β) are given by the photovoltaic manufacturer, but γ and β depend on the material used for the PV module. Evans [13] suggested to use for the silicon β=0.0048 °C-1 and γ=0.12 and for a CIS module β=0.006°C-1. Most often this equation is seen with γ=0 [14]. Actually, given a PV technology, the thermal coefficient of a PV module, β, varies greatly. Considering the most used PV technologies: mono and poly crystalline silicon cell, Fig. 2 shows the absolute variation of β according with the peak power of the PV modules. It is worth noticing that there is not an evident difference between mono and poly as well as with the rating power. From this preliminary analysis, the average values of β, in %/°C, are respectively: -0.4482 %/°C (mono) and -0.4383 %/°C (poly).
MONO -‐-‐-‐> mean= -‐ 0.4482 %/°C POLI -‐-‐-‐> mean= -‐ 0.4383 %/°C
0.5 0.4 0.3
!!!" !!!
=−
!!! !!!" !
!!,!"#
−
!! !
≅ −2.45
!"
(3)
!
where: Eg0 is the bandgap energy at Tc,ref=300 K, Eg0=1.21 eV and Voc,ref(Tc,ref)=0.55 V. But we are interested in the relationship between Voc and Vmpp. Under the hypothesis of neglecting the series resistance Rs, we combine two equations given by (1) evaluated at open circuit point and at maximum power point, so we have: 𝑉!,! = 𝑉!" − 𝑉! ln
!!,!
(4)
!!
In normal operating conditions for silicon cells we have Vm,m/VT≈20. So finally we get: 𝑉!,! ≅ 𝑉!" − 3.65𝑄! 𝑉!
(5)
The thermal coefficient of the maximum power point assumes the following expression: 𝜇=
!!!,! !!!
=
!!!" !!!
−
!.!"!! !
(6)
!
It is means that at first evaluation the two thermal coefficients differ just for a constant. Fig. 4 shows the absolute variation of open circuit thermal coefficient varying with the PV module peak power. In this case there is a larger difference between mono and poly compared with β coefficient. From this preliminary analysis, the average values of µ, in %/°C, are respectively: -0.366 (mono) and -0.342 (poly).
0.2
0.6
0.1 0
170 175 180 185 190 195 200
210
P PV (W)
220
240
260
280
Fig. 2 MPP thermal coefficient for mono and poly crystalline PV module varying with power ratings. 0.18
Eff. real Eff. with beta 0 and gamma 0
0.17 0.16
Eff. with beta opt and gamma opt
0.15 Efficiency
𝛿=
0.13
MONO -‐-‐-‐> mean= -‐ 0.3659 %/°C POLI -‐-‐-‐> mean= -‐ 0.3421 %/°C
0.5 0.4 0.3 0.2 0.1 0
0.14
170 175 180 185 190 195 200
210
P PV (W)
220
240
260
280
Fig. 4 Open circuit thermal coefficient for mono and poly crystalline PV module varying with power ratings.
0.12 0.11
III.
β opt=0.0054 γ opt=-‐ 0.0083
0.1 0.09 0.08
V oc thermal coefficient(-‐ %/°C)
MPP thermal coefficient(-‐ %/°C)
0.6
The second model is used to improve the efficiency of the MPPT algorithm by using a value of the voltage at the maximum power point according to the operating conditions (Tc and GT). The open circuit thermal coefficient δ can be calculated analytically by means of (3) [15], that in the case of a silicon solar cell assume the following value:
0
50
100
150
200
250
n° measure Fig. 3 Experimental fitting of β and γ in (2) for a PV module
300
EFFECT OF MISMATCH PHENOMENA ON PVCURVES.
The mismatch phenomena (e.g. electrical, thermal and radiative) cause always power losses, but if the PV cells are connected in series the most important origin of losses is the uneven distribution of solar radiation over the PV module.
The impact of mismatch has been evaluated by means of a Matlab/Simulink model developed to cope with such problems[16]. This model has been used to simulate the electrical behavior of a PV module when there is uneven distribution of PV cell temperatures. Fig. 5 shows the pattern of temperature caused by the water flow in a PVT module [17].
Fig. 5. Distribution of PV cell temperatures in a module with cells in series: (a) vertical water flow, (b) horizontal water flow
Fig. 6 shows the I-V curves of a PV module in different cases: 1) STC conditions (solid black line); 2) uniform irradiance and uneven distribution of temperature: case (a) – solid blue line, case (b) solid red line; 3) shading of 70% on the third string (dashed black line), shading + case (a) (dashed red line), shading + case(b) (dashed blue line). It is worth noticing that the presence of shading creates multiple maximum points in the P-V curves. And in this case the P-V curves of cases (a) and (b) are not any more overlapped.
250 200
STC Case (a) Case (b)
P PV (W)
PV cells are shaded or covered, namely when the level of irradiation is not uniform throughout the module. In technical literature, the irradiation degree of solar panels is one of the determining factors for PV systems to function in optimal parameters. Shading of photovoltaic (PV) panels can significantly reduce system performance. This loss of production varies depending on the size and density of the obstacle. Better to quantify the importance of the loss before starting to put its solar panels. There are two types of shadows: partial shade and full shade. Total or complete shade called what comes panel cover (cover, broken branch, dirt of any kind, etc.). Partial shading passes partly sunlight. Photovoltaic cells are connected in series. The lowest cell will therefore have an impact on the performance of other cells. Thus, shading total of one row of cells can make the overall ineffective photovoltaic module. The photovoltaic panels are characterized by a diode called ' bypass diode ' which is connected in parallel by a group of cells. It protects the heat cells caused by shade.
150 100 50 0 0
5
10
15
20 VPV (V)
25
30
35
40
Fig. 6. P-V curve for the PV module (Fig.14) at 1000W/m2 (solid curve), with a 70% shaded on third substring (dashed curved).
IV.
IMPROVED P&O MPPT METHOD
One of the most used MPPT algorithm is certainly the Perturbe and Observe (P&O). It is based on the evaluation of the derivative of P versus V. The sign of dP/dV and the type of DC/DC converter used determine the increasing or decreasing of the converter duty cycle, and so the operating point of the PV module or string in such a way to maximize the produced power. The P&O algorithms are widely used in MPPT because of their simple structure and the few measured parameters required. They operate by periodically perturbing (i.e. incrementing or decrementing) the array terminal voltage and comparing the PV output power with that of the previous perturbation cycle. If the power is increasing the perturbation will continue in the same direction in the next cycle, otherwise the perturbation direction will be reversed. This means the array terminal voltage is perturbed every MPPT cycle; therefore when the MPP is reached, the P&O algorithm will oscillate around it resulting in a loss of PV power, especially in cases of constant or slowly varying atmospheric conditions. Improving the P&O algorithm’s logic for comparing the parameters of two preceding cycles can solve this problem. If the MPP is reached, the perturbation stage is bypassed. Another way to reduce the power loss around the MPP is to decrease the perturbation step, however, the algorithm will be slow in following the MPP when the atmospheric conditions start to vary and more power will be lost. In cases of rapidly changing atmospheric conditions, as a result of moving clouds, it was noted that the P&O MPPT algorithm deviates from the MPP due to its inability to relate the change in the PV array power to the change in the atmospheric conditions. The perturbation step size is determined to be 0.1 in this simulation of the MPPT algorithm for all cases. To overcome this problem (named drift) modified P&O MPPT algorithm have been proposed. The behavior of the MPPT can be analyzed both in static and dynamic conditions; the static MPPT efficiency describes the ability of the MPPT to find and hold the MPP under constant environmental conditions (i.e. solar irradiance and cell-temperature) whereas the dynamic
MPPT efficiency describes the ability in tracking the MPP in case of variable conditions [18]. The MPPT efficiency is calculated as follows: !!"" !
100
Measure Ip,r p,r,Vp,r p,r,GTT,TCC
(7)
Where PPV(t) is the output power of the programmable dc power supply included in the PV simulator and PMPP(t) is the power at the MPP. In case of discrete time calculations, the above variables are sampled, and MPPT efficiency is calculated at each sample k. In static conditions, ηMPPT (t) is averaged over a specified period when the steady state is achieved and no further variations of ηMPPT (t) occur; depending on the operating conditions, the transient can take several seconds. In dynamic conditions, when the MPP changes due to irradiance variations, the MPP tracking is usually analyzed using staircase or trapezoidal irradiance profiles [19]. At present, conventional MPPT algorithms are valid for the single-peak case, as it is more difficult to track the global maximum power point for multiple-peak situations (Fig. 6). Meanwhile, there are still some shortcomings in the algorithms specific to multiple-peak situation. In [8] a classification of the maximum power point search algorithms is suggested: algorithms working under the uniform insolation and algorithms for partial shading conditions. The second group includes modified or hybrid algorithms to track the maximum power point under a partial shading. They include the power curve searching algorithms [20÷22], the DIRECT search algorithm [23] and a method using a division of the open circuit voltage [22]. The proposed MPPT algorithm attempts to combine two methods: passive method (based on power and voltage models) and active method (based on P&O and global MPP search). Specifically, at each time step, the MPP measured, Pp,r, is compared with the MPP calculated by (1), Pp,m. If the difference ΔPp,r-m is greater than a given error, e1, the global maximum is searched and both Ppg,r and Vm,r are stored. After this step there is another check about the measured voltage at MPPT, Vm,r if it close to the calculated value Vm,m, the system go back to the normal operation otherwise it goes on. In fact to avoid the continuous passage between the two MPPT algorithms, another different test is performed, as (1) is valid only when there isn’t any fault (e.g. shading). DPp, that is the different between two consecutive values of Pp,r(t) is evaluated. Till DPp,r, is smaller than a given value e2 the system perform locally the P&O, otherwise it performs again the global search. As the P-V curve can change in such a way that local maxima can change without affecting the part of P-V where the P&O is operating in this case in a given time interval the global MPPT has to be performed. Figure 8 shows the change in operating point positions when the irradiance conditions are changed quickly. At time t=0.15s the irradiance on third substring changes from 1000W/m2 to 300 W/m2. Figure 9 shows that when the rapid PSC occurs, the traditional P&O fails to track the real MPP, and operating point stays at about 81.7W.
Evaluate Pp,r p,r ,,Pp,m p,m and Vm,m m,m Yes
|Δ Pp,r-‐m p,r-‐m|>e11 No
Search global MPP and store Ppg,r pg,r and Vm,r m,r Yes
|Δ Vm,r-‐m m,r-‐m|