Estimation of: Efficiency, Scale & Scope and Productivity Measures of UAE Banks
by Dr. Ananth Rao Assistant Professor (Finance & Banking) College of Business Administration
Dubai University College PO Box 14143, Dubai, United Arab Emirates (UAE) Phone (Office): 00-971-4-2072630 Fax (Office): 00-971-4-2242151 E-mail:
[email protected]
1
Estimation of: Efficiency, Scale & Scope and Productivity Measures of UAE Banks1 ABSTRACT
This study estimated cost inefficiency, scale & scope measures and cost productivity growth rates of banks in United Arab Emirates during 1998 (a bad year for banks due to lower oil price) and 2000 (a good year for banks as the oil prices were higher). The study provided evidence that: -
Substantial cost X-inefficiencies and scope economies existed in UAE banks.
-
Average small banks improved their scale economies in 2000, while large banks maintained constant returns to scale than in 1998.
-
Cost productivity rate of average banks increased by 24% (when compared to the best-practicing banks).
Key terms:
UAE Banks, Cost inefficiency, Scale and Scope estimates, Cost Productivity growth rate, Foreign Investment.
JEL Classification:
G21, L25
1
The paper was presented at the European Conference of Financial Management Association International (FMAI – USA), in Copenhagen, Denmark on 6th June 2002. The author acknowledges the valuable comments provided by the participants at the FMAI conference. The author also acknowledges the encouragement and support given by the University through granting release time for the current research.
2
Estimation of: Efficiency, Scale & Scope and Productivity Measures of UAE Banks (Non-technical summary for practitioners and non-specialists)
Scale efficiency refers to the relationship between a firm’s average cost and output. Scope efficiency refers to the economies of joint production, where the cost of producing joint products is less than the sum of their standalone production costs. Productivity change or change in cost efficiency refers to the extent of change in cost due to combination of Change in best practice cost functions, Change in inefficiency and Change in business conditions over time. Recently research on banking efficiency has allotted more attention to the issue of X-inefficiency. X-inefficiency refers to the deviations from the production efficient frontier, which depicts the maximum attainable output for a given level of input.
Within the “Gulf region”, United Arab Emirates (UAE) is the second highest in terms of branch density with one bank branch serving almost 12000 populations in the year 2000. Such an over-banked situation has resulted in increased competition, reduced margins, limited lending opportunities for banks and hence efforts are needed to increase their productivity. No in-depth study has so far been reported on performance and efficiency analysis of banks in UAE. Therefore, the current research studied 35 commercial banks operating in UAE during 1998 (a weak year for banks as the oil prices were lowest) and 2000 (a good year for banks as the oil prices were higher). Using stochastic cost frontiers, the study provided evidence that:
3
-
Substantial cost inefficiencies existed in UAE banks. The cost inefficiency of the average medium-sized banks (i.e., with total assets around 19 billion AED) improved to 15.6% in 2000 (from 18.7% in 1998).
-
Average small-sized banks were more cost efficient in 2000 compared to average large-sized banks.
-
On an average, all the banks in general exhibited increasing returns to scale in 2000 compared to 1998.
-
Average small banks improved their scale economies in 2000 while average large banks maintained constant returns to scale.
-
When compared to the best-practicing banks, cost productivity rate of medium-sized banks increased between the two periods. This increase in cost productivity rate was contributed, to a major extent by the improved practices in cost functions adopted by these banks and changes in business conditions.
-
All the banks exhibited substantial scope economies in 2000 indicating the need for these banks to exploit the potential by offering diversified services rather than specializing in a few areas.
With the UAE entering into the fold of WTO and acquiring the status of the International Financial Center in the next couple of years in the Gulf region to attract foreign investments in the banking sector, these findings appear to be important for large UAE banks to reduce cost-inefficiency through efficient Asset and Liability Management.
4
Estimation of: Efficiency, Scale & Scope and Productivity Measures of UAE Banks Introduction Productivity of a firm refers to efficiency of : Firm’s production function yielding the maximum possible output from given quantities of inputs; Firm’s cost function incurring the minimum level of cost to produce some level of output given input prices; and a firm’s profit function generating the maximum profit given output prices and input prices. Each of these functions differs by the optimization criterion of maximality or minimality. The word frontier can meaningfully be applied in each of the three cases because the function sets a limit to the range of possible observations. Thus, for example, one may observe points below the production frontier (inefficient firms producing less than maximal possible output) but no points can lie above the production frontier. One may also observe points above the cost frontier (inefficient firms incurring more than minimal cost for producing maximal possible output) but no points can lie below the cost frontier. Similar comments apply to suitably defined profit frontiers. The extent of deviation by which a firm lies below (above) its production (cost) frontiers can be regarded as measures of inefficiency.
There exists a broad range of research studies on efficiency analysis of banking firms in developed and developing economies. These studies encompass the issue of scale and scope efficiency as well as change in productivity over time. Scale efficiency refers to the relationship between a firm’s average cost and output. Detection of U-shaped average cost curve suggests that there is an optimal scale of production at which point the production cost would be minimized. Scope efficiency refers to the economies of joint
5
production, where the cost of producing joint products is less than the sum of their standalone production costs. Productivity change or change in cost efficiency refers to the extent of change in cost due to combination of Change in best practice cost functions, Change in inefficiency and Change in business conditions over time.
More recently, research on banking efficiency has allotted more attention to the issue of X-inefficiency. X-inefficiency refers to the deviations from the production efficient frontier, which depicts the maximum attainable output for a given level of input.1 Research on US banks suggests that, X-inefficiencies appear to be large and tend to dominate scale and scope inefficiencies.2
Research Objectives
Within the “Gulf region”, United Arab Emirates (UAE) is the second highest in terms of branch density with one bank branch serving almost 12000 population in the year 2000. Such an over-banked situation has resulted in increased competition, reduced margins, limited lending opportunities for banks and hence efforts are needed to increase their productivity.
To the best of our knowledge, no prior study has been reported on performance and efficiency analysis of banks in UAE. In fact the only study reported in the Gulf-region was by Al-Faraj et al (1993) who used data envelopment methodology (a non-parametric method) for evaluation of bank branches in Saudi Arabia3. It is, therefore, of interest to
6
policy makers in UAE banking industry and academicians to research on the following specific objectives:
1. Does there exist cost X-inefficiency in banking industry? If yes, what is the level of the inefficiency? 2. How do these cost productivity estimates compare with other developed countries? 3. What are the scale and scope estimates of these banks and how do they compare to other banks internationally? 4. What is the magnitude of change in cost inefficiency over time and how do they compare with other studies?
These research questions have major relevance to UAE banking policy issues because of its importance to the UAE economy as a whole, and are especially important given the substantial changes in banking markets and banking regulations in UAE. For instance, if inefficient banking firms have a tendency to remain inefficient, it would be of interest for the policy makers to investigate how these banks can remain economically viable and not be driven out of the banking market.
Further, the policy makers and regulators would be concerned about whether inefficient banking firms pose additional risks to the banking system and its safety net. Because, a key role of a country’s bank regulators is to limit systematic risk – the risk that the problem of a few banks, which could spread to many other banks that are otherwise
7
liquid and solvent. This protects the money supply and the payment system from being severely disrupted.
Further, the responses to the research questions would help in
improving managerial performance e.g., by identifying best-practicing and worst-practice branches within a bank.
The present paper lays the foundation for such an efficiency and performance analysis by specifically focusing on the above research questions for UAE banks.
Relevance of Research
The research questions posed in the paper have major relevance to UAE banking policy issues because of its importance to the UAE economy as a whole, and are especially important given the substantial changes in banking markets and banking regulations in UAE. For instance, if inefficient banking firms have a tendency to remain inefficient, it would be of interest for the policy makers to investigate how these banks can remain economically viable and not be driven out of the banking market.
Further, the policy makers and regulators would be concerned about whether inefficient banking firms pose additional risks to the banking system and its safety net. Because, a key role of a country’s bank regulators is to limit systematic risk – the risk that the problem of a few banks, which could spread to many other banks that are otherwise liquid and solvent. This protects the money supply and the payment system from being severely disrupted.
Further, the responses to the research questions would help in
8
improving managerial performance e.g., by identifying best-practicing and worst-practice branches within a bank.
The research findings would also be of interest to the foreign investors to study the industry situation to undertake investments in the region since UAE has recently acquired the status of International Financial Center (IFC) similar to world financial markets like New York, London, Frankfurt, Singapore, Tokyo etc.
The rest of the paper is organized as follows. Section 2 discusses the banking firm and functional form of cost function, reviews the literature and presents the empirical model. Section 3 describes the Methodology – discusses the data and estimation issues. Section 4 presents the results of estimated cost functions, cost & scope economy measures and change in cost inefficiency over time. Section 5 summarizes the study and presents conclusions and limitations of the paper.
Section 2 2.1 Conceptual framework of a banking firm & literature review Production and Intermediation approaches are two main approaches used in the literature to conceptualize the flow of services provided by banks. Under the production approach, banks are thought of as primarily producing services for its customers. The bank output is best measured by the number and type of transaction processed over a given time period. However, such detailed transaction flow data is typically proprietary and not generally
9
available. The bank inputs comprise of labor and capital and their costs are included since only physical inputs are needed to process transaction.
Under the intermediation approach, banks intermediate funds between savers and investors. With this approach, service flows are typically assumed to be proportional to the stock of financial values in the accounts such as the number of $ of loans, $ of deposits etc (Berger and Humphrey 1991). The input of funds and their interest costs are included as input costs since funds are the main raw materials which are transformed in the financial intermediation process.
The literature suggests intermediation approach as more appropriate approach for evaluating entire banking industry because this approach is inclusive of interest expenses, which accounts for 50-66% of total costs of banks. Further, intermediation approach may be superior for evaluating the importance of frontier efficiency to the profitability of financial institutions since minimization of total costs (not just production costs) is needed to maximize profits. The production approach may be somewhat better for evaluating the efficiencies of branches of banks, because branches primarily process customer documents and branch managers typically have little influence over bank funding and investment decisions (Berger and Humphrey (1998)).
Researchers investigating bank cost efficiency presume a relationship exists between variable cost, input prices and output quantities as implied by economic theory. The cost minimization concept assumes that firms minimize costs subject to exogenously given
10
prices of variable inputs, quantities of variable outputs, quantities of fixed netputs (fixed inputs or outputs), environmental factors, their own managerial inefficiency, and random error. This concept is implemented using a standard cost function relating costs to these exogenously given conditions. For simplicity, the inefficiency and random error are assumed to be multiplicatively separable from the rest of the cost function, and all of the variables (other than dummies) are measured in natural logs (Ln):
LnTC = f (X) + LnU + LnV. The variable LnTC measures natural log of total costs (including both operating and interest expenses); f (.) is the best practice (natural log) cost function; X ≡ (LnW, LnY, LnQ, LnD) is the set of natural logged exogenous “business conditions” that affect costs, specifically variable input prices (LnW), variable output quantities (LnY), fixed netput quantities (LnQ), and environmental variables (LnD)4. The LnU term denotes an inefficiency factor that is zero for best-practice firms. For inefficient firms LnU > 0 because of both technical inefficiency (errors in minimizing inputs relative to outputs or maximizing outputs relative to inputs) and allocative inefficiency (errors in responding to relative prices in choosing inputs or outputs). The LnV term is a random error assumed to have zero mean each period. All variables may differ over time. The best practice cost function f (.) for the bank may vary over time.
2.2 Research Studies of Productivity Change and Inefficiency5 The research literature often calls shifts in the best-practice frontier as “technological” or “efficiency” change. Berger and Humphrey (1992) used thick frontier approach (TFA) to
11
compare bank cost efficiency and studied shifts in best-practice costs between 1980, 1984, and 1988 using data for all US banks. These three years correspond to pre-, mid-, and post-deregulation of the deposit side of banking. They found that when the shifts were not adjusted for changes in business conditions, average costs increased for all but the vary largest efficient banks in the 1980-84 interval, followed by decreases in average costs for all sizes in 1984-1988 period. The increase in costs in 1980-84 was larger for the smaller banks in the sample. This may reflect the deregulation of deposit rates in the 1980-84 periods, and the fact that smaller banks rely more heavily on deposits than larger banks. The decline in average costs in 1984-88 (after most of the effects of deregulation should have been exhausted), may have reflected a decline in market rates that affect deposit rates and rates on purchased funds about equally. When the shifts in average cost frontiers were adjusted for changes in the business conditions, an increase in costs was still found for the 1980-84 period, but a decrease was no longer found for the 1984-88 period.
Bauer, Berger and Humphrey (1993) used a panel data set of 683 banks with over $100 million in assets to estimate total factor cost productivity growth for the best-practice banks during 1977-1988. Over that period, their estimates ranged from an average annual growth rate of -2.28% to 0.16% depending on the estimation method used. The poor productivity growth was attributed to higher costs of funding due to high market rates, elimination of deposit rate ceilings, and increased competition from non-bank financial intermediaries, which increased demand for funds and reduced the supply of deposits. Hence the banks increased the number of branches over the 1980s, in addition to paying
12
higher deposit rates and providing the ATM innovation. The increase in deposit rates, increase in non-bank competition, and better convenience all made consumers of bank services better off, but because quality of service is difficult to account for in the estimation, the higher quality showed up as a decrease in productivity.
Humphrey (1993) used the same data set to investigate the effect on costs from shifts in the cost function from 1977-1988 periods. Measures were derived in three ways: from a simple time trend; from a time-specific index; and from annual shifts in cross-section cost functions. All three methods yielded similar estimates, with shifts in the cost function implying cost increases averaging 0.8% to 1.4% per year, and small banks (with assets of $100-$200 million) experiencing larger increases on average than large banks. Humphrey attributed the decline in cost productivity to deregulation of deposit rates. As support for this hypothesis, he found that in the pre-deregulation period (1977-1980), productivity increased, while during deregulation (1981-1982), productivity declined substantially, and in the post deregulation period (1983-1988), it showed a little change.
In contrast to these several cost minimization studies, several research efforts used linear programming methods to measure changes in productivity or performance. These methods are non-stochastic and do not allow for random error. The productivity changes are based on quantities of outputs and inputs without regard to prices, so there is no way to determine whether banks became more or less productive in an economic sense (i.e., efficiency) or respond more or less appropriately to market price signals.
13
Devaney and Weber (1996) investigated whether the market structure of rural banking markets affected the bank’s productivity growth over 1990-93. They used linear programming to calculate the Malmquist productivity index, which decomposes productivity changes into changes in efficiency, shifts in the production function and changes in the scale of operations. They found positive productivity growth at rural banks over 1990-93. Shifts in the production frontier were the driving force for this productivity growth.
Wheelock and Wilson (1996) also used the linear programming approach to investigate bank productivity growth, to decompose the change in productivity into its change in efficiency and frontier shift components. They found that larger banks (assets over $300 million) experienced productivity growth between 1984-1993, while smaller banks experienced a decline. Average inefficiency remained high in the industry, since banks were not able to adapt quickly to changes in technology, regulation, and competitive conditions.
Similarly, Alam (1998) used linear programming techniques to investigate productivity change in banking using a balanced panel of 166 banks from 1980 to 1999 with greater than $500 million in assets. As in Wheelock and Wilson, productivity change was decomposed into its two components: change in efficiency and shifts in the frontier. Bootstrapping methods were used to determine confidence intervals for the productivity measure and its components. The findings were that productivity surged between 1983 and 1984, regressed over the next year, and grew again between 1985 and 1989. The
14
main source of the productivity growth was a shift in the frontier rather than a change in efficiency.
The efficiency of commercial banks has reemerged as a critical issue to both the public and to policy makers. Cost efficiency represents one facet of efficiency. Most previous studies of cost efficiency compute scale and scope economy measures from Translog cost functions. However, the findings of these studies have cast doubt on the suitability of the Translog functional form. The study by Mitchell and Onvural (1996) contributed new evidence on bank cost efficiency to estimate cost functions having a functional form that avoids the problems of the Translog, and then using the estimated functions to compute measures of scale and scope economies. In their study they used the Fourier Flexible (FF) functional form. The approximating powers of the FF form derive from the capacity of a Fourier series to represent any function exactly. Despite its superior properties the FF form has sparsely been used to study the efficiency of financial institutions6. The Fourier Flexible form represents a semi-non-parametric approach to the problem of using the data to infer interrelationships among the variables when the true functional form of the relationships is unknown. Gallant (1981, 1982), Eastwood and Gallant (1991) and Gallant Souza (1991) discuss the FF form extensively.
In a typical study, a researcher first regresses costs variable on prices and outputs variables and then uses the parameter estimates to construct measures showing how output changes affect cost. Unfortunately, theory fails to indicate the functional form of the cost-price-output relationship. Nonetheless, the researcher must select a functional
15
form in order to perform the regression. Advanced calculus defines Fourier series as a linear combination of sine and cosine functions and can represent exactly any wellbehaved multivariate function f(x)7 (cf. Dym and McKean 1972, Ch 1). Thus a researcher lacking knowledge of the true form of a cost function may avoid gross functional misspecification by positing a Fourier series.
The performance of banking firms/institutions can be evaluated by separating them as those that perform well from those that perform poorly, based on some standard/benchmark by estimating the inefficiency. The measurement of inefficiency has been the main motivation for the study of frontiers. Frontier analysis is a sophisticated way to benchmark the relative performance of production firms (including banking firms) by estimating inefficiencies. The advantages of frontier analysis are:
-
it permits individuals with very little institutional knowledge or experience to select “best practice” firms within the banking industry (or “best practice” branches within the bank),
-
assigns numerical efficiency values,
-
broadly identifies areas on input overuse and/or output underproduction, and relates these results to questions of government policy or academic research interest.
2.3 Empirical Model It is well known that either the cost functions or the production functions uniquely define the technology; which one is to be estimated depends on one’s assumption and/or data.
16
The behavioral assumption underlying direct estimation of the bank cost function is generally cost minimization with output exogenous (e.g., because the banking firm is regulated). It requires the data on input prices but not input quantities, and the cost frontier yields information on the extra cost of technical and allocative inefficiency.
Representing a function by a Fourier series trades one problem (specification error) for another (approximation error). An exact representation of a function may require a Fourier series having an infinite number of trigonometric terms, but the coefficient of these terms could only be estimated with a data set having an infinite number of observations. Given a finite number of observations, a researcher is forced to choose a subset of the trigonometric terms with which to represent a cost function. Gallant (1981) asserts that a Fourier series representation of an unknown function can achieve a given level of approximation error with fewer trigonometric terms when it includes a secondorder polynomial in the explanatory variables. Gallant dubs this combination of secondorder polynomial and truncated Fourier series the Fourier flexible (FF) functional form. The empirical model in the study is represented by the FF cost equation (Equation 1) as: 4
4 4
2
(1) Ln TC = α0 + ∑ βj Ln Yj + 0.5 ∑ ∑ βj k Ln Yj Ln Yk + ∑ γm Ln Wm j
j k
m
2 2
4 2
m n
j m
+ 0.5 ∑ ∑ γm n Ln Wm Ln Wn + ∑ ∑ ρj 4
4
m
A
Ln Yj Ln Wm
4
+ ∑ [δj Cos Zj + θj Sin Zj] + ∑ ∑ [δjk Cos (Zj + Zk) + θjk Sin (Zj + Zk)] j=1
j=1 k=j
4 4
2
+ ∑ ∑ ∑ [δj k l Cos (Zj + Zk + Zl) + θj k l Sin (Zj + Zk + Zl)8] + η
B
j=1 k=j l=k
Where, TC is bank’s total cost, Yj is banks’ outputs j=1…4, comprising of: y1 - Book value of investment securities in Million AED; y2 - Book value of loans (net of loan loss provisions in Million AED; 17
y3 - Book value of Government loans in Million AED; y4 - Book value of other loans in Million AED;9 Wm is banks’ input prices (m= 1, 2) comprising of: w1- Unit cost of deposit funds measured as a ratio of total interest expenses to Total deposits; and w2 - Unit price of labor measured as a ratio of total wages and salaries of Employees to the number of full-time equivalent employees. Zj & Zk are scaled outputs, Zl are scaled input prices, η - is error term independently and identically distributed normal with zero mean and σµ standard deviation i.e., N(0, σ2µ). The stochasticity of the cost function model arises from the assumption on the error term (or the deviation from the frontier) and the error composition. The error term is composed of two parts η = LnU + LnV. The first part LnU is a one sided component that captures the effects of inefficiency relative to the stochastic frontier and is assumed to follow a (positive) exponential distribution. The second part LnV is a symmetric component that permits random variation of the frontier across firms, and captures the effects of measurement error, other statistical `noise’, and random shocks outside the bank’s control. The cost inefficiency term includes both technical and allocative inefficiency,
The terms in segment A in equation (1) represents the translog part of the FF cost function, while the terms in segment B represent the (truncated) Fourier series10. There are various rules to choose appropriate trigonometric terms to include in the FF cost function (such as setting the number of parameters equal to the number of sample observations raised to the two-thirds power etc). In this study due to limited sample size, we use the trigonometric terms with the greatest explanatory power11.
18
2.3.1 Measure of Inefficiency
The X-inefficiency of bank n, defined as Cn, can be expressed as the expected value of U, conditional on η (Jondrow, Lovell, Materov, and Schmidt 1982): Cn = E(Un|ηn) = [σλ/(1+λ2)] [φ (ηnλ/σ)/Θ((ηnλ/σ) +(ηnλ/σ)]
Æ
Eq. (2)
Where, λ is the ratio of the standard deviation of LnU to the standard deviation of LnV (i.e., σu / σv); σ2 = σ2u + σ2v; Θ is the cumulative standard normal density (cdf) function, and φ is the standard normal density (pdf) function. Estimates of Cn are obtained by evaluating equation (2) at the estimates of σ2u & σ2v. λ is interpreted to be indicator of relative variability of the two sources of random error that distinguish banking firms from one another. λ2 Æ 0 implies σ2v Æ ∞ and/or σ2u Æ 0, i.e., that symmetric error dominates in the determination of ε. Similarly, when σ2v Æ 0, the one-sided error becomes the dominant source of random variation in the model and error specification takes on the form of a negative half normal or exponential depending on the error specification12
2.3.2 Measure of Returns to Scale
The ray scale economy (RSEB) measure of bank B is the elasticity of cost with respect to output holding output composition constant (Mitchell and Onvural (1996). It is defined as follows: RSEB = ∑i δLnC (p, yB) / δLnyi
Æ
Eq. (3)
19
Where, δLnC (p, yB) / δLnyi is the partial derivative of the cost function with respect to (unscaled) output Yi, evaluated at the unscaled output quantities for an arbitrary bank B and unscaled sample mean-input prices p. RSEB measures the percentage change in cost due to a one-percentage change in all outputs, a change that alters the scale of output but not output bundle composition. Returns to scale are increasing; constant or decreasing as RSEB is less than, equal to, or greater than one. As an efficiency measure, RSEB is most useful if banks grow by changing their scales but not the composition of their output bundles. Berger et al (1987) observes that banks do change the composition of their output bundles as they grow. To recognize these changes, they propose an alternative scale economy measure called the expansion path scale economy (EPSEAB) measure. EPSEAB is the elasticity of incremental cost with respect to incremental output defined as follows (Mitchell and Onvural (1996)):
EPSEAB = {∑i [(yBi – yAi) / yBi] [RSEB]} ÷ {[C (p, yB) - C (p, yA)] / C (p, yB)}Æ Eq. (4) Where, yak and by are the quantities of the ith output at Banks A and B respectively, and C (p, yA) and C (p, yB) are total costs at Banks A and B respectively computed from cost function (1) and p is the sample mean of the input prices13. The numerator in equation (4) is the percentage change in cost where each output changes in the same proportion as it does between bundles A and B. The denominator is the percentage difference in costs between Banks A and B computed from the cost function in equation (1). Returns to scale are increasing, constant or decreasing when EPSEAB is less than, equal to, or greater than one.
20
2.3.3 Measure of Scope The scope economy measure, SCOPE, measures the cost saving from joint versus specialized production. For the case of two-output y1 and y2, SCOPE is defined as follows (Mitchell and Onvural (1996) :
SCOPE = [C (p, y^1, ym2) + C (p, y^2, ym1) - C (p, ya1, ya2)] C (p, ya1, ya2) Æ
Eq. (5)
Where, yai is the sample mean, ymi is sample minimum and y^i = yai - ymi i = 1,2. SCOPE measures the percentage cost saving from producing chosen quantities of the two outputs jointly in a single bank as against producing them in two banks, each of which specializes in one of the outputs. Scope economies exist if SCOPE value is greater than zero, and does not exist if SCOPE value is less than zero. SCOPE is most useful as an efficiency measure if extreme product specialization is a viable business strategy.
2.3.4 Measure of Productivity Change Berger and Mester (1999) represent the cost of the industry at time t by the predicted cost of a bank with average business conditions, average inefficiency for the period and a zero random error (ie. LnV = 0). The total gross change in cost between period t and t+n is measured by the ratio of predicted costs in the two periods as in equation (6) below:
∆ TCt,t+n =
{exp [ft+n (Xt+n)]} * {exp[LnUt+n]} ------------------------------------------{exp[ft (Xt+n)] } * { exp[LnUt]}
Æ
Eq. (6)
21
where, ∆ TC = change in total cost between periods t and t+n , f (.) is the cost function in period t and t+n periods, LnU is the average inefficiency computed from the cost function in respective periods from equation (1). As this is a gross change, any figure below 1.00 indicates falling costs and any figure above 1.00 indicate rising costs over the period. The change in total costs between two periods is decomposed in to three multiplicative components viz., Change in best practice (A), Change in inefficiency (B), and Change in business conditions (C) as in equation (7) below:
∆ TCt,t+n
= A * B * C, where:
Æ
Eq. (7)
A Æ {exp[ft+n (Xt)] } ÷ {exp[ft (Xt)] } B Æ {exp[LnUt+n]} ÷ {exp[LnUt]} C Æ {exp[ft+n (Xt+n)] } ÷ {exp[ft+n (Xt)]} The change in best practice (A), gives the change in costs due to changes in best practice cost function f (.) since it holds business conditions and inefficiency constant. Similarly, terms B and C give the contributions to change in total cost from change in inefficiency and change in business conditions respectively.
The cost productivity change is computed as the product of the change in best practice (A) and the change in inefficiency (B). This productivity change measure has been used in prior research, which separates the changes in the behavior of firms from changes in the conditions they face. The cost productivity change also represents an improvement over government productivity change statistics.14 However, change in cost productivity is a superior indicator of productivity as it controls for all parts of output quantities as well
22
as the input prices, fixed netput quantities, and environmental conditions specified in the business conditions vector X in equation (1) (Berger and Mester (1999)).
Section 3: Methodology 3.1 Data and Estimation issues. 1998 and 2000 published balance sheet and income expenses data for 35 banks in UAE were used to estimate cost equations representing the “intermediation” approach15. These 35 banks represented almost 81% of total banking industry’s assets in UAE. The year 1998 represent the period when the oil prices in the region were at their lowest (a bad year for banks) than in year 2000 when the oil prices were higher (a good year for banks)16. Estimating a common frontier across time (1998 and 2000) may not be appropriate because, the bank that is most efficient in one year may not be most efficient in another year. Hence Cost functions were estimated for two years 1998 and 2000 to investigate the stability of the industry cost function.
3.2 Estimating Cost Inefficiency A stochastic cost efficient frontier model based on a multi-product Translog cost function with a Flexible Fourier (FF) transformation is estimated. An efficient operating cost frontier in equation (1) is specified. Because it includes trigonometric transformations (ie. Cos (Z) and Sin (Z)) of the variables, the FF can globally approximate the underlying cost function over the entire range of data. Use of the FF requires that the data LnYj and the LnWj be rescaled by their respective mean values so that the minimum and maximum values of each independent variable is in the interval [0,2π], where π refers to the number
23
of radians. The standard symmetry restrictions apply to the translog portion of the function. Factor share equations as per Shepherd’s Lemma were not imposed to avoid undesirable assumption of perfect allocative efficiency (Berger and Mester (1999)). Nonavailability of detailed output and price data from the bank’s annual report precluded inclusion of more number of variables in the estimation process.
The linear homogeneity restrictions are imposed by normalizing the total cost and the input prices by the price of labor. Standard symmetry restrictions were imposed on the translog part of the FF form. Share equations were not used in the estimation to avoid imposing any restrictions on the functional form.
Total costs (TC) and the numerators used to construct the input prices (Wj j =1,2) are flow variables that reflect accumulated activity over 1998 and 2000, while the output variables (Yj, j = 1 to 4) and the input price (wm , m = 1,2) are averages of beginning-ofyear and end-of-year values. Because of natural log of zero is undefined, a small positive amount (1, which represents 1,000 Arab Emirate Dirham AED (UAE currency) of output) is added to each of the elements of Y for all banks.
Assuming the cost function to be stationary over time, cross-section observations are used to estimate the stochastic cost frontier separately for each year 1998 and 2000 by the method of maximum likelihood. Estimates of cost X-inefficiency (Cn) which represents the measure of firm-specific cost X-inefficiency are then computed for each bank in each sample period. In this study, “intermediation approach” has been taken by including
24
deposit cost as input. Two models were specified for estimation of cost X-inefficiency of banks (Cn):
1. TranslogÆ Translog cost function model with Total Cost (i.e., specifying only component A).
2. FFÆ Flexible Fourier (FF) model i.e., Translog cost function with Fourier Transformation (specifying components A & B in equation (1)). The trigonometric terms for FF forms for component B in equation (1) were chosen through pre-testing i.e., retaining significant trigonometric terms. The chosen vectors produce sine and cosine terms having pairs of outputs, and pairs of outputs coupled with input prices as arguments.
Section 4. Empirical Results Table.1 reports the summary statistics of business environment variables of banks viz., banking outputs, input prices, total assets and total costs. The business environment of banks was more variable in 2000 than in 1998. Both firm size and the cost function variables are highly skewed. The level of bank outputs viz., Investments, Loans and Customer deposits as well as input costs viz., cost of deposits and labor were higher and more variable in 2000 relative to 1998. Although net profit of banks increased in 2000 relative to 1998, Profitability of banks measured in terms of return on assets (ROA) declined from 2.05 percent in 1998 to 1.91 percent in 2000. Similarly return to stockholders measured in terms of return on equity (ROE) declined from 15.3 percent in
25
1998 to 13.6 percent in 2000. The variability of Net-Profit, Returns on Assets (ROA) and Equity (ROE) was higher in 2000 relative to 1998. Table.2 reports the results of estimated models. Table.1 Summary Statistics for 35 UAE Banks Year 1998 Year 2000 Mean S.D1 Skewness Mean S.D1 Skewness --------------------------------------------------------------------------------------------------------------------------------(TA) 5385 7847 2.1 6431 8872 1.9 Total assetsa Net profita (NP) 112 159 1.7 127 171 1.7 Total costa (TC) 325 451 2.0 420 540 1.7 Operating costsa (OC) 129 186 2.5 152 211 2.3 Return on Assetse (%) (ROA) 2.05 1.2 0.95 1.91 1.3 0.06 Return on Equityf (%) (ROE) 15.30 6.9 -0.21 13.60 9.2 -0.49 Outputs (Yj) (j = 1….to 6) (Y1) Investmentsa Loans & advancesa (Y2) Government loansa (Y3) (Y4) Other loansa Off-balance sheeta, b (Y5) Customer depositsa (Y6)
311 2521 330 160 3612 3848
938 3486 835 316 4865 5974
4.7 2.1 3.0 3.0 2.1 2.3
429 2803 497 283 4617 4385
1260 3648 1368 459 8263 6349
4.5 1.8 3.8 2.1 4.2 2.1
Inputs (Wm) (m = 1..2) (w1) 0.068 0.083 5.3 0.087 0.114 4.3 Cost of depositsc Cost of labord (w2) 0.127 0.008 1.8 0.141 0.065 1.7 1 S.D represents standard deviation – measure of dispersion a in Million AED (1US$ = 3.67 AED) b includes off-balance sheet items such as: loan commitments, letters of credit, futures and forward contracts, and notional value of outstanding swaps. c in AED for 100 AED of Customer deposits d in Million AED per full-time equivalent employee. e (Net profit / Average total assets)*100 f (Net profit / Average total equity)*100
Results in Table.2 indicate that, the models fit the two sets of data (1998 and 2000) quite well with adjusted R2 ranging from 0.90 to 0.94. As seen from the likelihood estimates and significance of coefficients, the FF model is superior to Translog model. This is consistent with the robust findings of Mitchell and Onvural (1996) who found that bank’s industry cost function clearly does not have the Translog form. Further coefficient values
26
of λ and σ are quite significant indicating that inefficiencies existed in UAE banks in both the periods.
Table.2 Cost function Model Estimation Results Year: Specification:
1998 FF
1998 Translog
2000 FF
2000 Translog
Adjusted R2 Log Likelihood Parameter estimates: βo
0.93 -10.02
0.90 -16.55
0.94 - 5.92
0.94 - 8.78
- 0.1112 (0.113)
- 0.1957 (0.123)
- 0.0692 (0.106)
- 0.0401 (0.0994)
∑ βj
0.9191*** (0.0516)
0.9852*** (0.0744)
1.0302*** (0.0592)
1.0296*** (0.0537)
∑ βjk
- 0.0171*** (0.007)
- 0.0083 (0.0058)
- 0.0059 (0.0047)
- 0.0063 (0.0043)
0.4686*** (0.0945)
0.5408*** (0.0778)
∑γ ∑ δjk
- 0.2408*** (0.096)
- 0.1454** (0.0794)
∑ δjkl
0.1669* (0.0976)
∑ θjkl
0.2419** (0.1195)
λ
3.9372** (1.7931)
- 0.0799 (0.1277) 3.2809** (1.5876)
3.7074*** (1.3469)
3.6617*** (1.4681)
σ
0.2226*** 0.2699*** 0.1618*** 0.1931*** (0.0875) (0.0914) (0.0551) (0.0753) Figures in parenthesis are standard errors *** Significant at 1 percent level (2-tailed t-test) that estimates are different from 0 ** Significant at 2 to 5% level (2-tailed t-test) that estimates are different from 0 * Significant at 7-9 percent level (2-tailed t-test) that estimates are different from 0
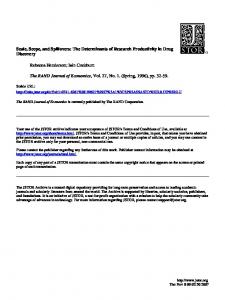
4.1 Cost Inefficiency Estimates The cost X-inefficiency (Cn) was estimated as per equation (2) from the values of λ and σ from Table.2 and the residual values estimated from equation (1). Figure.1 plots the cost
27
inefficiency estimates of banks and Table 3 exhibits summary of X-inefficiency estimates. 1.4
1.2
Inefficiency Estimates
1
0.8
0.6
0.4
0.2
0 1
2
3
4
5
6
7
8
9 10 11 12 13 14 15 16 17 18 19 20 21 22 23 24 25 26 27 28 29 30 31 32 33 34 35 Small Banks (1-18); Large Banks (19-35) 1998 Translog
1998 FF
Figure.1 Plot of Cost Inefficiency Estimates Figure.1 further confirms reveals that, the Translog model specification overestimated the cost inefficiency compared to the FF model specification.
Table.3 Cost inefficiency (Cn) Estimates Year: Specification Mean Cn Std. Dev Median Cn Skewness Minimum Maximum Sample size (N)
1998 FF 0.2399 0.1913 0.1869 2.59 0.0772 1.0438 35
1998 Translog 0.3048 0.2330 0.2084 2.11 0.083 1.2008 35
2000 FF 0.2521 0.2253 0.1564 1.97 0.0579 0.9773 35
2000 Translog 0.2553 0.2076 0.1931 1.88 0.0730 0.9581 35
28
Results in table.3 indicate that the cost inefficiency estimates were positively skewed in both years. Based on median values, Translog model overestimated cost inefficiency of banks by 10% in 1998 and 19% in 2000 compared to FF form. Even Berger and Deyoung (1996) reported that Translog model overestimated inefficiency of US Banks by more than 50% of costs. The median values of X-inefficiency estimates under FF form indicate that cost inefficiency (Cn) declined by 16.3% from 18.69% in 1998 to 15.64% in 2000 but were statistically less significant. These results appear to be consistent with the findings of Berger, Hunter and Timme (1993) that X-inefficiencies in banking account for approximately 20% of costs. The cost inefficiency estimates reported by earlier research studies for banks using stochastic frontier approach in other countries were: Italy 4245%; Spain 20%; Tunisia 52-63%; US 5-9% (Berger and Humphrey (1998)). The average inefficiencies reported by Berger and Humphrey (1998) in their survey of 130 financial institutions across 28 countries from both parametric and non-parametric estimation methods were 27 percentage points.17
Due to the smaller set of the data, size-wise cost function estimation could not be carried out. However, it would be interesting to observe how the different size of banks faired since cost inefficiency estimates (Cn) as well as scale economy measures (RSE) could be computed for individual banks from the model. The sample of banks was grouped based on median value of total assets into small and large sized banks. The size-wise cost inefficiency estimates are presented in Table.4.
29
Table.4 Cost Inefficiency estimates (Cn) of UAE Banks (Size-wise) using FF model Year: 1998 1998 2000 2000 Size: Small Size Large size Small Size Large Size ≤1933 ≤ 2220 (Total Assets > 1933 > 2220) Million AED) --------------------------------------------------------------------------------------------------------------------------------Sample means: 0.2832 0.1884 0.2552 0.2485 Sigma 0.2269 0.1261 0.2338 0.2222 Median 0.2182 0.1509 0.1477 0.1823 Skewness 2.29 2.56 1.67 2.63 Minimum 0.0831 0.0772 0.0579 0.0665 Maximum 1.0438 0.6016 0.8372 0.9773 Sample Size (N) 18 17 18 17
Results in Table 4 indicate that in case of small size banks, cost inefficiency declined by 9.89% from mean level of 28.32% in 1998 to 25.52% in 2000 while the variability increased marginally by 3% between the two periods. On the other hand in the case of large size banks, cost inefficiency increased by 32% from mean level of 18.84% to 24.85% in 2000, while the variability was very high which increased by 72% between the two periods. This result indicates an improvement in efficiency of operation of smallsized banks compared to large-sized banks during 2000 than in 1998. While the results in 1998 are consistent with other related studies, higher inefficiency estimates for larger banks in 2000 were unexpected. These results are confirmed in the Figure.2 where the small banks with increasing asset base exhibited decreasing trend in cost inefficiency in 2000 than in 1998 in contrast to large banks.
Figure.2 reveals a declining trend in the cost inefficiency estimates in small banks in 2000 compared to 1998 as the size of these small banks increased (On the X-axis, 1-18 denotes small banks and 19-35 denotes large banks arranged in ascending order of their total assets reflecting increasing asset base across the small and large banks). This result
30
is in contrast with an increasing trend in large banks in the corresponding periods. Thus small banks with increasing asset base appear to be more cost efficient than large banks.
1.2
1
Inefficiency Estimates
0.8
0.6
0.4
0.2
0 1
2
3
4
5
6
7
8
9 10 11 12 13 14 15 16 17 18 19 20 21 22 23 24 25 26 27 28 29 30 31 32 33 34 35 Small Banks (1-18); Large Banks (19-35) 1998 FF
2000 FF
Figure.2 Cost inefficiency estimates of UAE Banks
4.2 Estimates of Scale Economies Table.5 presents estimates of the ray scale economy (RSE) measure computed as per equation (3) and Figure.3 plot these estimates across small- and large-sized banks. Scale economy measure declined for all banks from 1.25 in 1998 to 0.94 in 2000 indicating increasing returns to scale in 2000 relative to 1998. This implies that, while banks exhibited decreasing returns to scale in year 1998 (RSE > 1) they showed improvement through increasing returns to scale in year 2000 (RSE 1.0) compared to large-sized banks, which exhibited almost constant returns to scale (RSE = 1.0475). Thus it appears that in 2000, small sized-banks improved their scale of operations and exhibited increasing returns to scale (as can be seen from the decreasing average RSE measure = 0.9261 < 1), while the large-sized banks almost maintained constant return to scale economy of operations in 1998 and 2000. This may be attributed to the fact that in year 2000 small sized banks probably improved their cost control due to increased competitive pressure in the banking industry. Table 5 Ray Scale Economy (RSE) estimates of UAE Banks using FF form Year: 1998 1998 1998 2000 2000 2000 Size All Small Size Large size All Small Size Large Size ≤1933 ≤ 2220 (Total Assets banks > 1933 banks > 2220 Mil AED) --------------------------------------------------------------------------------------------------------------------------------Mean RSE 1.2468*** 1.4146*** 1.0475*** 0.9367*** 0.9261** 0.9494*** Std. Dev. 0.4259 0.3839 0.3954 0.3934 0.4402 0.3434 Median RSE 1.3224 1.4703 0.9621 0.8829 0.8117 1.0091 Skewness -0.05 -0.359 0.3759 0.2656 0.6012 -0.495 Minimum 0.3950 0.8361 0.3950 0.2995 0.3270 0.2995 Maximum 1.9726 1.9726 1.9107 1.8664 1.8664 1.3938 Sample Size (N) 35 18 17 35 18 17 * **Statistically different from 0 at 1 percent level for a two tailed test ** Statistically different from 0 at 5 percent level for a two tailed test.
32
2.5
Scale Economy Estimate
2
1.5
1
0.5
0 1
2
3
4
5
6
7
8
9 10 11 12 13 14 15 16 17 18 19 20 21 22 23 24 25 26 27 28 29 30 31 32 33 34 35 Small Banks (1-18); Large Banks (19-35) 1999 RSE
2000 RSE
Figure.3 Scale Economy Measures of UAE Banks Figure.3 reveals that small banks experienced a declining trend in RSE measure as their assets base increased in 2000 compared to 1998. 14 small banks whose RSE >1 in 1998, showed an improvement in 2000 with a reduction in their RSE as their asset base increased. On the contrary, 10 large banks whose RSE < 1 in 1998, showed deterioration in 2000 with increase in their RSE as their asset base increased.
The results from Tables 4 & 5 as also from the plots in Figures 1 and 2 indicate that large-sized banks: -
exhibited higher levels of cost inefficiency in 2000 relative to 1998, and
-
enjoyed almost constant returns to scale in 1998 & 2000,
33
as compared to small-sized banks which experienced both decreasing cost inefficiency and increasing scale economies in 2000 than in 1998. This observation is of particular interest as it probably highlights the management capability of small-sized banks to positively turn the cost inefficiency and the scale economies in their favor when the oil economy was more conducive for the banking industry during 2000 compared to 1998. These results are consistent with the findings of Mitchell and Onvural (1996) who reported that banks in the smaller size group enjoy increasing returns to scale while banks of other size groups face constant returns to scale.
The RSE measure discussed so far did not consider changes in the composition of output bundles in banks. However, following the suggestion of Berger and Humphrey (1998) that, banks do change the composition of the output bundles as they grow, expansion path scale economy (EPSE) could be a better measure of returns to scale for banks. Equation (4) was evaluated using FF cost model. Median values of EPSE although declined for banks from 1.9472 in 2000 compared to 1.8879 in 1998; they were still > 1. This implies that, as banks changed the composition of their output bundles as they grew, their scale economies did not improve in 1998 and 2000.
4.3 Measure of Scope
Equation (5) was evaluated using flexible functional model to get SCOPE measure. SCOPE estimate was 0.5239 in 2000 relative to 0.5115 in 1998. This implies that there exists potential scope economy (Scope > 0) in these banks. Thus, the banks could still potentially exploit the synergy that exists in business diversification through joint outputs 34
rather than specialization in one output to decrease their costs of operations. Mitchell and Onvural (1996) observed that US banks experience neither economies nor diseconomies of scope.
4.4 Change in Cost Productivity estimates
When equations (6) & (7) were evaluated, the following changes in cost productivity were observed between 1998 and 2000 in the two cost functional specifications:
Specifications:
FF
Translog
Changes in Best-practice (A) (%) Change in Inefficiency (B) (%) Change in Business Condition (C) (%) Gross Change in Cost-Productivity growth rate (A) * (B) * (C) (%) Annualized growth rate in cost productivity (%)
1.3073 1.0123 1.1668
1.845 0.9516 1.1219
1.544 1.24
1.97 1.40
Gross change in cost-productivity for banks between 1998 and 2000 was 1.544% for FF cost functional form and 1.97% in Translog cost functional form. Annualized rates were 1.24% and 1.40% respectively for the two functional forms. The translog model overestimated the cost productivity growth rate (similar to overestimation of cost inefficiency estimate) than the flexible form. When decomposed into components, Changes in best practice cost function (term A in equation 7) and Changes in business condition cost components (term B in equation 7) declined which contributed to the rising costs. The Change in inefficiency cost component (term C in equation 7) was not a major factor in rising costs.
35
It is a fact that the major component of UAE economy is dominated by the oil-sector, which is uncontrollable due to influence of global factors. In such a situation, the decline in change in business conditions (term “B”) has to be offset by the banks by improving their operations through adoption of best-practices in management of costs (term “A”) to ensure a consistent increase in cost-productivity in future years.
Relatively speaking the rate of rising costs was lower for UAE banks compared to US banks. Berger and Mester (1999) estimated that, the cost of average US banks rose at an annual rate of 1.1% over the 1984-87 period, falling at an annual rate of 0.3% over the first seven years from 1984-91, and rising at an annual rate of 2.7% over the subsequent six years from 1991-97. Using the average practice cost frontier (estimated using all banks) to decompose the cost changes suggest that, cost productivity worsened over both subintervals (change in cost productivity > 1), while the business conditions as a whole reduced costs over both the subintervals (change in business conditions cost < 1).
If we examine the changes in business conditions more closely, the disadvantages of these changes in increasing costs are not all surprising. As shown in Table.1, average costs of deposits have increased substantially from 6.8% in 1998 to 8.7% in 2000. Given that interest expenses make up more than half of variable costs, it is expected that these increases in rates would increase costs substantially. Compounding this effect was the increase in the price of labor from 12.7% in 1998 to 14.1% in 2000 coupled with the costs of operation of the average banking firm from about 19% increase in total assets.
36
This further provides an opportunity for banks to manage their assets and liabilities more prudently in the coming years.
Section 5: Summary and Future Implications The study focused on cost inefficiency, scale & scope economies as well as productivity growth rates of UAE banks in 1998 (a bad year for banks due to lower oil prices) and 2000 (a good year for banks due to higher oil prices). The data comprised of 35 banks, which constituted 81% of total bank assets in 1998 and 2000. Flexible Fourier (FF) and Translog cost forms were specified for estimation purposes. The translog form overestimated cost inefficiency by 10 to 19% in the two years compared to FF form.
The study findings provide evidence that substantial cost inefficiencies seem to exist in UAE banks. The cost inefficiency for the medium-size banks (asset size around 19-22 billion AED) was 18.7% in 1998 and declined to 15.6% in 2000, but was statistically less significant. Small-size banks experienced higher decline in cost inefficiency (32%) between 1998 and 2000 compared to large-size banks (21%). Thus, it appears that small size banks performed well and improved their cost efficiency during the two periods, than large-size banks.
On an average, the banks exhibited increasing returns to scale in 2000 compared to 1998. During the same period small-sized banks improved their scale economies while large banks maintained constant returns to scale. This implies that the Management teams of small banks were capable of managing their portfolio more effectively and exploited the improved business conditions during 2000 in their favor, to face competitive pressure and
37
to ward off potential threats of consolidation by larger banks in the coming years through mergers and acquisitions.
The study findings reveal that there existed substantial scope economies in these banks in 2000 relative to 1998. This implies that banks could benefit much more from the synergy of joint products rather than specialization in only a few products.
As to the gross change in cost productivity growth rates between the two periods, the study revealed that cost changes were rising at an annual growth rate of 1.24% between 1998 and 2000. This implies that overall costs had increased by 24% when compared to the best-practice banks. This is attributed to the cost productivity change of 1.31% (implying 31% cost increase) due to change in best practice behavior of banks and 1.01% change in cost increase due to cost-inefficiency, and 1.17% change in cost increase (implying 17% increase) due to the improved business conditions in 2000. The comparison of the magnitude of the impact of these two factors indicate that the cost productivity factors viz., best practice behavior and changes in business conditions were major factors influencing increased annual cost productivity rate than the change in costinefficiency.
5.1 Limitations and Implications for Future Research
The study although was intended to lay a foundation for cost inefficiency analysis in UAE banks using the recent research developments in the area in other countries, the findings have following limitations:
38
Firstly, the data set was small (35 banks for two periods 1998 and 2000) compared to more than 300 banks over 10-15 year time periods in other related studies. This is unavoidable due to the smaller size of the UAE economy and lesser transparency in reporting of operation results in the region.
Secondly, all banks are not yet uniformly practice accounting and reporting standards as per GAAP although the Central Bank of UAE has directed all the banks for uniform adoption of accounting and reporting standards.
Third limitation is the absence of taxes on the profits of the national banks operating in UAE compared to foreign banks which have to account for taxes when repatriating their profits/loss to their parent banks overseas.
Future research may consider these limitations in their studies for obtaining better estimates for policy analysis.
39
REFERENCES Aigner, Dennis, C.A. Knox Lovell, and Peter Schmidt (1977). “Formulation and Estimation of Stochastic Frontier Production Function Models.” Journal of Econometrics 6, pp 21-37. Al-Faraj, T.N.A.S. alidi, K.A. Bu-Bshait. “Evaluation of Bank Branches by Means of Data Envelopment analysis.” International Journal of Operations and Production Management, vol 13, 1993; pp 45-52. Alam, I.M.S (1998). “ A Non-parametric Approach for Assessing Productivity Dynamics of Large Banks, Tulane University mimeo. Bauer, Paul W., 1990, “Recent Development in Econometric Estimation of Frontiers.” Journal of Econometrics, 46, pp 39-56. Bauer, P.W., A.N. Berger, and D.B. Humphrey, “Efficiency and Productivity Growth in U.S. Banking”, in H.O.Fried, C.A.K.Lovell, and S.S. Schmidt;eds. The Measurement of Productivity Efficiency: Techniques and Applications, Oxford University Press, U.K. 1993: 386-413. Berg, S. A., Forsund, F., and Jansen, E. (1992) “Malmquist indices of productivity growth during the deregulation of Norwegian Banking, 1980-89, Scandinavian Journal of Economics 94, 211-228. Berger, Allen N., and Loretta J. Mester. “What Explains the Dramatic Changes in Cost and Profit Performance of the U.S. Banking Industry?” Finance and Economic Discussion Series, Federal Reserve Board, Washington D.C., 1999-13. Berger, Allen N., and D.B. Humphrey (1998). “Efficiency of Financial Institutions: International Survey and Directions for future Research”. European Journal of Operational Research, pp 175-212, 1998. Berger, Allen N., and Robert DeYoung (1997). “Problem Loans and Cost Efficiency in Commercial Banks.” Journal of Banking and Finance, Vol. 21, 1997 Berger, A.N., and D.B. Humphrey, “The Dominance of Inefficiencies over Scale and Product Mix Economies in Banking”, Journal of Monetary Economics, 28 (1991):117148. Berger, Allen N., and Robert DeYoung (1996). “Problem Loans and Cost Efficiency in Commercial Banks.” Working Paper, Board of Governors of the Federal Reserve System, Washington D.C., U.S.A., (August 1996).
40
Berger, Allen N., John H. Leusner, and John J. Mingo, (1994). “The Efficiency of Bank Branches.” Board of Governors of the Federal Reserve, Finance and Economic Discussion Series Paper 94-26. Berger, Allen N., William C. Hunter, and Stephen G. Timme. (1993). “The Efficiency of Financial Institutions: A Review and Preview of Research Past, Present, and Future.” Journal of Banking and Finance, 17, pp.221-249. Berger, Allen N., and Humphrey D.B., (1992) “Measurement and Efficiency Issues in Commercial Banking, in Measurement Issues in the Services Sectors” (Z Grilliches, Ed)pp 245-279, National Bureau of Economic Research, University of Chicago Press, Chicago. Berger, Allen N., Gerald A. Hanweck, and D.B. Humphrey. “Competitive Viability in Banking.” Journal of Monetary Economics 20, (1987), 501-20. Devaney, M. and Weber, W. (1996). “Productivity Growth, Market Structure, and Technological Change: Evidence from the Rural Banking Sector”, Southeast Missouri University mimeo. Dym, Harry, and Henry P. McKean. “Fourier Series and Integrals, New York: Academic Press 1972. Eastwood, Brian J., and A. Ronald Gallant. “Adaptive Rules for Semi nonparametric Estimators that Achieve Asymptotic Normality.” Econometric Theory, 7 (1991), 307-40. Elyasiani, E., and Mehdian, S.M., (1995). “The Comparative Efficiency Performance of Small and Large US Commercial Banks in the pre- and post-deregulation eras”, Applied Economics 27, 1069-1079. Gallant, A. Ronald. “On the Bias in Flexible function Forms and an Essentially Unbiased Form: The Fourier Flexible Form.” Journal of Econometrics 15 (1981), 211-45. Gallant, A. Ronald. “Unbiased Determination of Production Technologies.” Journal of Econometrics 20 (1982), 285-323. Gallant, A. Ronald, Geraldo Souza. “On the Asymptotic Normality of Fourier Flexible Form Estimates.” Journal of Econometrics 15 (1981), 211-45. Humphrey, D.B., “Cost and Technical Change: Effects from Bank Deregulation”, Journal of Productivity Analysis, 4 (June 1993): 5-34. Hunter, W.C., and Timme S.G (1991). Technological Change and Production Economies in Large US commercial Banking” Journal of Monery, Credit and Banking, 29, 73-79.
41
Jondrow, James, C., A. Knox Lovell, I.S. Materov, and Peter Schmidt. 1982, “On Estimation of Technical Inefficiency in the Stochastic Frontier Production Function Model,” Journal of Econometrics, 19, pp 233-238. Leibenstein, Harvey. 1966. “Allocative Efficiency Versus ‘X-Efficiency’.” American Economic Review 56, pp.392-415. McAllister, Patrick H., and Douglas McManus, 1993, “Resolving the Scale Efficiency Puzzle in Banking”, Journal of Banking and Finance 17, 389-405. Mitchell, Karlyn, and Nur M. Onvural, (1996). “Economies of Scale and Scope at Large Commercial Banks: Evidence from the Fourier Flexible Functional Form.” Journal of Money, Credit, and Banking Vol. 28, No. 2, (May 1996) Wheelock, D.C., and Wilson, P.W 91996). “Technical Progress, Inefficiency and Productivity Change in U.S banking 1984-93,” Federal Reserve Bank of St. Louis mimeo.
42
END NOTES 1
The concept of X-inefficiency was introduced by Leibenstein (1966), who noted that, for a variety of reasons, people and organizations normally work neither as hard nor as effectively as they could.
2
Berger and Humphrey (1998) provide a survey of 130 efficiency studies on financial institutions in about 21 countries.
3
This study reported efficient estimates of 0.87, implying that bank branches were 13% less efficient than the best-performing/efficient banks.
4
LnD - in some cases LnD are zero-one dummy variables, such as indicator variables for bank branching restrictions, rather than being natural logged continuous variables.
5
The paper reviews only some of the papers in the literature: others include Hunter and Timme (1991), Berger et al. (1992), and Elyasiani and Mehdian (1995). See also the literature review in Alam (1998). 6 See Bauer (1990) for a review of Stochastic Frontier Approach (SFA) methods. Specification of models with distribution free is inappropriate as it only generates long-run estimates of cost efficiency (inefficiency), while thick cost frontier approach estimates cost efficiency (inefficiency) only for group of banks. On the other hand, in data envelopment analysis (DEA) approach the comparison of efficiency (inefficiency) of individual institutions is difficult. Berger, Hunter and Timme (1993) discussed the relative strengths and weaknesses of these approaches. 7
This is possible because the sine and cosines functions are mutually orthogonal and function space spanning; hence representing an arbitrary function by a Fourier series is analogous to representing an nvector as a linear combination of n mutually orthogonal, function space-spanning basis vectors.
8
While evaluating cost function after estimation, the sum and difference rule/formula for trigonometric terms was applied viz., Sin (a+b) = Sin(a) Cos(b) + Cos(a) Sin(b); Cos (a+b) = Cos(a)Cos(b) – Sin(a)Sin(b); Sin (a-b) = Sin (a) Cos (b) – Cos (a) Sin (b); Cos(a-b) = Cos (a) Cos (b) + Sin (a) Sin (b)
9
Although financial equity capital is an input under intermediation approach (or asset approach), it is generally considered fixed since it is difficult to change quickly and in part because, its price, the risk adjusted return on equity is difficult to measure.
10
For the FF methodology to work, the price and output quantity data expressed in natural logarithms in segment B must be scaled to limit the periodic sine and cosine functions to one period of length 2π. Also, data for all of the log-price variables must be scaled together as part of restricting the cost equation to exhibit linear homogeneity in input prices; the same is not true of data for all of the log-output quantity variables in segment A.
11
The equation in (1) is Fourier flexible functional form, which is a theoretical improvement on the translog form, which is a local approximation that may perform poorly for observations far from the sample means. In application, McAlester and McManus (1993), Berger, Leusner, and Mingo (1994), and Mitchell and Onvural (1996) have all found that the Fourier-flexible form fits the data better than the translog for banking data.
12
See Aigner, Lovell and Schmidt (1977) for technical discussion of the error specification.
13
Banks A and B are arbitrarily chosen with Bank A smaller than B.
14
The government measure usually uses the changes in a single output – gross product originating or a weighted sum of bank transactions divided by the single input measure, employee labor hours.
43
15
The banks in UAE started reporting the number of employees and staff cost in their annual reports only from the year 1998.
16
The United Arab Emirates (UAE) GDP at factor cost and at current prices stood at a level of AED 240.9 Billion with a growth rate of 20.4% during 2000. The output of the oil sector reached AED 73.35 Billion in 2000 compared to AED 34.49 Billion in 1998. The share of oil sector in GDP increased from 19.4% in 1998 to 30.3% in 2000. This was mainly due to the increase in average oil prices from US $ 12.4 a barrel in 1998 to US $ 27.2 a barrel in 2000. There were totally 46 banks operating in UAE during 2000, comprising of 20 national banks (with 311 branches) and 26 foreign banks (with 109 branches). The aggregate balance sheet of banks operating in UAE increased from AED 235 Billion at end-1998 to AED 277 Billion at end2000. During the two corresponding periods Credit extended increased from AED 106 Billion to 125 Billion and the Deposits increased from AED 135 Billion to AED 170 Billion.
17
Cross country comparison are difficult to interpret because the regulatory and economic environment faced by financial institutions are likely to differ importantly across nations.
44