Proceedings of the 43rd Hawaii International Conference on System Sciences - 2010
Efficiency, Trust, and Visual Appeal: Usability Testing through Eye Tracking Soussan Djamasbi Worcester Polytechnic Institute
[email protected]
Marisa Siegel Fidelity Investments
[email protected]
Abstract Creating a positive user experience is a fundamental element of producing a successful web page. Three important components of user experience are visual appeal, trust, and efficiency. This study extends past research by examining the effect of images of faces on the visual appeal, efficiency, and trustworthiness of a page. Data is collected using both subjective ratings and objective measurements, including eye tracking. Analysis indicates that users find a page that has images of people’s faces more appealing than a page that has no images of faces and perform tasks more quickly when there are faces present. Additionally, analysis reveals a strong positive correlation between trusting the informational content of a page and its visual appeal. This research has important implications for theory and practical applications.
1. Introduction As e-commerce sales continue to increase, growing an average of 6.75% in 2008 [28], it is important for companies to enhance the user experience of their websites. A recent survey indicates that a positive user experience can result in a return on investment (ROI) of as high as 83% [17]. This is an impressive statistic, particularly when IT investments are considered some of the riskiest ventures for a company [27]. Human computer interaction (HCI) studies suggest that a good user experience can be accomplished by creating pages that are able to be navigated efficiently, elicit trust in the information they provide, and are visually pleasing [6, 14, 16]. Although there is anecdotal evidence that users trust a page with their credit cards if the page is aesthetically pleasing [13], little research has been done to test whether the visual appeal of a page can indeed directly predict the level of trust a user has in the informational value of the page. Previous research shows that the visual appeal of a page is positively correlated with a perception of usability [15];yet, little work has been done to test whether visual appeal can also influence objective measures of usability, such as task completion time.
Tom Tullis Fidelity Investments
[email protected]
Rui Dai Worcester Polytechnic Institute
[email protected]
To explore these themes, two studies were conducted to compare users’ opinions on and reactions to two web pages. The first study examined the self report measures of visual appeal and trust, as well as objective measures of performance, with a high volume of participants. The second study extended the first by examining the gaze patterns of a smaller group of participants.
2. Background There are numerous methods through which user experience can be enhanced on websites. One of these is the inclusion of social presence. Social presence theory [22] describes the implication or sensation that another person is present when a user is interacting with a specific medium. Originally, this theory was only applied to and studied using telephony; however, research indicates that this theory is applicable to other communication technologies as well [23]. The inclusion of social presence may be particularly important on e-commerce websites because, as they are more impersonal and automated than traditional face-to-face commerce, they may be perceived as lacking human warmth [12] Social cues, such as pictures, can increase positive impressions of group communication (such as online discussions) [23] and elicit warm feelings, causing users to have a more satisfying experience [10, 22]. A recent study shows that pages that include human faces are perceived to have a greater degree of social presence [4]. The same study shows that users find images that include human faces more appealing than images that do not include faces (e.g., those that display a person but no face) and images that do not contain people. This is also supported by eye tracking studies that show users’ gaze is often more intense on faces in an image [6]. These findings suggest that the inclusion of an image of a face on a web page is likely to affect how visually appealing users find the page. Literature also suggests that, if a page is visually pleasing, users are more inclined to trust it [13]. This indicates that visual appeal is likely to be a good
978-0-7695-3869-3/10 $26.00 © 2010 IEEE
1
Proceedings of the 43rd Hawaii International Conference on System Sciences - 2010
predictor of trust. To examine this directly, we conduct analyses to determine if there is indeed a significant link between visual appeal and trust. Recent eye-tracking studies suggest that examining user gaze can help better understand user reactions [6, 26] Eye tracking has been noted as particularly useful when comparing the versions of a design or the effectiveness of a particular element on the page [2]. Thus, in this paper, users’ fixation is examined in order to explain their behavior.
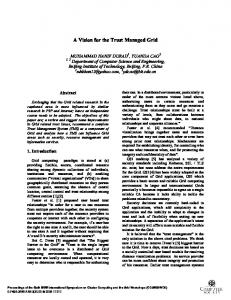
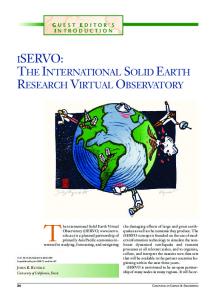
3. Experimental Material and Tasks In this section, we provide a brief description of the web pages and tasks used in both studies. The homepage of a finance-centered website was modified for use in both studies. The homepage contained a section called “Expert Insights,” located below the fold of the page. This section was modified to either contain images of faces (the “Faces prototype”) or images of non-faces, or logos (the “Logos prototype”). An image portraying the modification can be seen Figure 1. Literature suggests that users typically view a web page from the top down [7]. This is supported by studies showing fewer fixations on the part of a page that is below the fold [6]. As a result, investigating methods of attracting user attention below the fold is of particular interest. Participants were required to complete several tasks, provided to them in random order. All tasks were similar; they all required users to find information about a specific topic presented on the page (e.g., Brazil's stocks). Two of the tasks were critical tasks, or tasks that were related to the section of the page that differed. The answer to one of these tasks, which asked users to find information on what is next for GE, was located on the left side of the Expert Insights section. The answer to the second critical task, which asked users to find information that describes the worst mistake they can make when doing their taxes, was located on the right side of the Expert Insights section. In this paper, henceforth, these two tasks will be referred to as Task 1 (“Find an opinion on what's next for GE”) and Task 2 (“Find an opinion about what the worst mistake on your taxes is”).
4. Study I: Online Survey The objective of Study I was to examine whether user behavior differed between the two web page prototypes. In the following section, the hypotheses of this study are stated, and a description of the study and its results are provided.
The Web is a social medium through which human relationships and interactions are mediated [1]. The social presence theory states that, because human beings are social, there is a “sense of being with another” which is essentially shaped and affected by interfaces [1]. Users are generally aware of the level of social presence a medium offers, and will choose the one most appropriate for their purposes [20]. Media having a high degree of social presence are judged as being warm, personal, sensitive and sociable [22]. Especially in a web environment, it has been argued, a sense of human warmth and sociability can be instilled through the inclusion of pictures of humans [11].
Figure 1.a. Expert Insight Window for the Faces Prototype
Figure 1.b. Expert Insight Window for the Logos Prototype
Figure 1. The manipulated section of the prototypes contained images of faces or logos
2
Proceedings of the 43rd Hawaii International Conference on System Sciences - 2010
4.1. Hypotheses A recent study shows that perceived social presence has a significant and positive relationship with the presence of images that include human faces on a webpage [4]. A positive aesthetic experience is typically accompanied by positive feelings [15]. The “emotional evaluation” of an object is a major factor in whether we find it appealing or not [11]. Because positive feelings have a social origin [9], social presence is likely to increase the appeal of a web page. Therefore, we expect: H1) Users will rate the web page that has images of people’s faces as more visually appealing than the page with logos. Empirical studies suggest that the beauty of a website design can greatly affect users’ trust in an ecommerce website [8, 13] For example, 46.1% of average consumers assess web credibility “based in part on the appeal of the overall visual design” [8]. Similarly, users who showed a preference for clean web designs were willing to trust such a page more easily because it was pleasing to them [13]. These results suggest that visual appeal ratings and trust ratings are likely to be correlated and, as a result, it is likely that visual appeal will be a predictor of trust in this experiment: H2) The trust rating will be significantly and positively influenced by the visual appeal rating.
4.2. Participants & Design This study was conducted online. Five hundred twenty-two employees of a leading financial company, recruited via corporate e-mail, participated in the study. They ranged in age from their 20s to their 60s (264 male and 258 female). Participants were randomly assigned to one of the two prototypes, and viewed only that version of the prototype.
4.3. Measurements User performance was operationalized as task completion time. In addition to this objective measure, two subjective measures were also captured. After completing all tasks, participants were asked to rate the visual appeal of the web page they viewed, as well as their level of trust in the accuracy of the information on the page. Both of these measurements were self-reported ratings provided on seven-point Likert scales. These surveys have been used previously in a number of studies [8, 15]
4.4. Results The first hypothesis, H1, predicted that the Faces prototype would be rated more visually appealing than the Logos prototype. A one-tailed t-test indicated that, as predicted, the Faces prototype was
rated as significantly more appealing than the Logo prototype (p=.034). The analysis showed that images of faces had a large effect size (d=.84) on visual appeal [3]. The results of this t-test are shown in Table 1. Table 1. Results of the t-test for visual appeal. Visual Appeal Mean Std. Dev. Logos 4.54 1.58 Faces 4.78 1.43 df= 521, t Stat= 1.831, p=0.034, d= 0.84 The second hypothesis (H2) stated that the trust rating would be significantly influenced by the visual appeal rating. The results (Table 2) of a regression indicated that the visual appeal rating significantly predicted the trust rating (p=.000) and explained 15% of the variance in trust (R2 = .15). In addition, the visual appeal rating had a medium effect size (f2=.18) on the trust rating [3]. Trust was positively correlated with visual appeal. These results support H2. Table 2. Linear regression results. DV
IV
Trust
Intercept
Β
t Stat
p
31.86
0.000
Visual Appeal 0.38 9.59 0.000 Overall model F = 91.972; p < 0.001; R2 = 0.15; Adjusted R2 = 0.15, f2=0.18
4.5. Additional Analysis There is ample evidence that the visual appeal of a web page can enhance its perceived usability [15]; yet, little is known about the relationship between visual appeal and objective measures of usability. Studies show that people are attracted to human images, and tend to fixate on faces when browsing web pages [6, 26]. However, there is some evidence that people do not have this tendency to fixate on images of faces when completing tasks [26]. A recent empirical study using images of faces revealed some surprising results. It was found that users tended to take longer, though not significantly longer, to complete tasks when images of faces were included than when there were no images. In that study, however, the images of the faces were located above the fold [26]. This suggests that, although they are not receiving direct fixation, the images were distracting to users in completing tasks. Because the images of the faces are located below the fold in our study, there may be differences in user behavior; there is evidence that users tend to favor information that is above the fold over information that is below the fold [6, 7, 29]. Because faces attract attention,
3
Proceedings of the 43rd Hawaii International Conference on System Sciences - 2010
placing them below the fold may help to guide users’ gaze towards an area they favor less. This may mean that images of faces, which may be distracting and lead to a higher task completion time when placed above the fold, could be useful in drawing user attention to particular information when located below the fold. To investigate this possibility, we examined the completion time of the critical tasks in the two prototypes. Our analysis indicated that participants completed the tasks significantly faster on the Faces prototype. Our analysis also showed a small effects size (d=0.33) for this t-test [3], shown in Table 3. Table 3. Results of the t-test for mean task time (in minutes). Mean Task Time Mean Logos 0.96 Faces 0.82 df= 521, t Stat= 2.475, p=0.01, d=0.22
Std. Dev. 0.73 0.55
To determine if the decreased task completion time affected the participants’ precision, another ttest was conducted on accuracy between the two prototypes, revealing no significant difference. The shorter task time, without a decrease in accuracy, appears consistent with the theory of visual rhetoric. This theory states that, when they are appropriate for their associated message, graphics can help deliver the message more effectively [21]. Next, because the genders of the faces in the images involved in the two critical tasks were different, we examined whether this affected the results. A t-test revealed that the completion time for Task 1 was significantly faster than that for Task 2, suggesting a possible interaction between the genders of the faces and task completion time. To investigate this further, the same t-test was conducted using the participants’ data from the Logos prototype. If the observed effect were due to the gender of faces, no difference would be expected on the Logos prototype. However, analysis of the task completion times on the Logos prototype showed the same trend – Task 1 was completed significantly faster than Task 2. Together, these results indicate that the horizontal order of the information on the page, not gender, is more likely to be the reason for different completion times in our study. This interpretation is aligned with models of visual hierarchy, which suggest a left-toright order of viewing preference [7]. Because of this preference, participants came across the information on the left side first and thus completed the task requiring that information (Task 1) faster.
5. Study II: Eye Tracking The objective of Study II was to refine the results of Study I through the use of eye tracking. In particular, the analysis of users’ gaze can help better explain which parts of the prototypes are viewed by users and whether the amount and duration of fixations differed in the two prototypes. Because the critical tasks were related to the Expert Insights section, it is logical that there would be fixation in that area. Based on the theory of visual rhetoric, if the faces are a useful cue to users (help better process information), the Expert Insights section of the Faces prototype should receive fewer fixations and less fixation time than the Expert Insights section of the Logos prototype. This would, then, support the shorter task completion time found for the critical tasks on the Faces prototype in Study I.
5.1. Design In order to achieve unbiased results comparable across Studies I and II, the same materials, including the prototypes and tasks, were used. Study II was conducted in a laboratory environment in which the eye movements of the participants were tracked using the Tobii 1750 eye tracker. This eye tracker is completely remote from the participant, enabling a more natural lab experience. The eye tracker works with both glasses and contact lenses, and there is no restriction on the participant’s movement.
5.2. Measurement In this study, the eye movements of the participants were tracked, enabling analysis of the fixation patterns of users. A fixation is a gaze of a minimum of 300 milliseconds and is a reliable indicator of interest [6, 18]. Fixation can be analyzed through the creation of heat maps. Examples of heat maps are shown in Figure . Red, green, and yellow represent users’ fixations, with red indicating the highest level of fixation, followed by green and yellow. Areas with no color received no fixation. Heat maps are particularly useful when using data aggregated from several participants, as in this study. It is necessary to be cautious in the analysis of heat maps, particularly in comparison to each other. There are several different types of heat maps that can be created – in this paper, we examine both count and duration heat maps to compare the viewing patterns of the participants. A count heat map indicates the number of times a participant fixated on a section, regardless of duration. If, for example, a participant fixates on a section for ten seconds, looks away, and then fixates again for one second, the count heat map will record two fixations. In contrast,
4
Proceedings of the 43rd Hawaii International Conference on System Sciences - 2010
a duration heat map indicates the real time a participant fixates on a section. Using the prior example, if a participant fixates on a section for ten seconds, looks away, and then fixates again for one second, the duration heat map will record eleven seconds of fixation. These two types of heat maps are useful when analyzing different sections of a single page, but when comparing across pages, they are less useful. Because the colors on a heat map are relative to the highest amount of fixation represented on that heat map, a red section on one count heat map may indicate that a participant looked at that area ten times, but on a different heat map, red may indicate that another participant looked at an area only twice. To make comparison across heat maps meaningful, we create “standardized heat maps,” or heat maps in which we standardize the highest number of fixations. So, in the example discussed above, we would create heat maps so that the red areas would indicate ten fixations (as opposed to two) on both heat maps. This allows a legitimate comparison of which areas received the most fixation across the heat maps. In some cases, this method may cause some loss of subtlety in the heat map with lower relative fixation, particularly if there is a great difference between the highest fixations of the heat maps. As a result, it is sometimes useful to examine the regular, not standardized, heat maps. In this study, because we are comparing the fixation patterns of participants across two different prototypes, it is more appropriate to use the standardized versions of the count and duration heat maps.
5.3. Participants Participants were recruited from the same leading financial company from which the Study I participants came, though none of the Study II participants took part in Study I. Forty people, evenly split between males and females, participated in the second study. They ranged from twenty to fifty years of age. These participants were randomly assigned to the Logos or Faces prototype.
5.4. Procedure Upon arriving at the usability lab, participants reviewed and signed a statement of informed consent. The eye tracker was calibrated to each participant, a brief procedure during which the participant watches a circle moving on the screen. When the eye tracking began, the software launched the online study used in Study I in Internet Explorer. The experimenter left the room while the participant completed the study.
Upon completion, the participant provided demographic information and was debriefed.
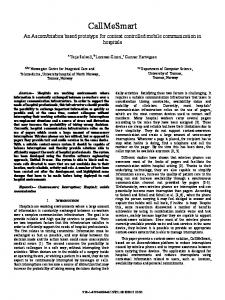
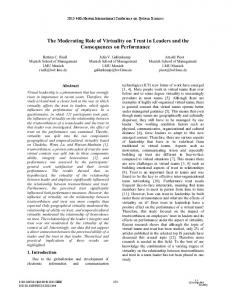
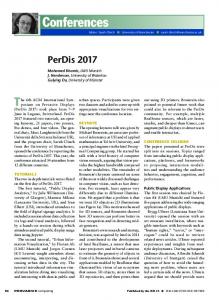
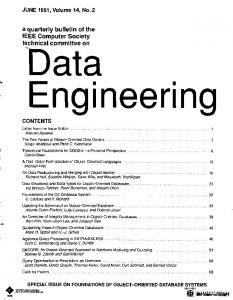
5.5. Results Because there may have been discrepancies in the participants’ task completion time due to procedural differences between Studies I and II, a t-test was conducted. The results, shown in Table 4, indicate no significant difference between the task completion times in Studies I and II. We also compared the effect sizes of the two studies, using a method recommended by Rosnow and Rosenthal [19], to test whether the results of the two studies were different. This analysis showed no significant differences (p=0.28) between the product-moment in the two studies (r=-0.22, r=-0.39), indicating that the differences in the settings of the two experiments had no significant effect on performance in the two studies. Table 4. Results of the t-tests for mean task completion time across Studies I and II. Mean (Std Dev.) Task Time Faces Logos Study I 0.82 (0.55) 0.96 (0.73) Study II 0.66 (0.17) 0.89 (0.35) df= 266, t Stat= df= 266, t Stat= 0.821, p=0.412 0.586, p=0.567 As discussed in Section 5.2, two types of heat maps are analyzed in this study – these are shown in Figures 2 to 5. The heat maps displayed in these figures contain the Expert Insights section, the only area that differed between the two prototypes. The heat maps also include the section directly above the Expert Insights section. Both of these sections were located below the fold. First, we used a standardized count heat maps, indicating the number of times the participants fixated on a particular area, to compare the number of fixations between the two prototypes. These are shown in Figures 2 and 3. As expected, there were fixations in the Expert Insights section of both prototypes. A comparison of the Expert Insights sections on the two heat maps reveals a similar pattern – there is fixation on text, but not on images. Participants fixated very few times on the images of the logos or the faces on either of the two prototypes. However, participants had more fixations on the text next to the images and in the area above (Investing Tips & Tools) on the Logos prototype compared to the Faces prototype.
5
Proceedings of the 43rd Hawaii International Conference on System Sciences - 2010
Figure 2. Standardized count heat map for Faces prototype
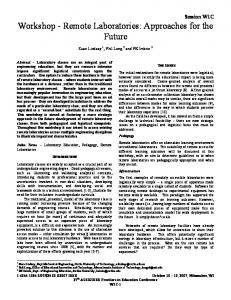
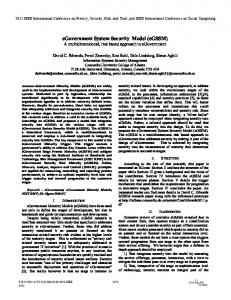
Figure 4. Standardized duration heat map for Faces prototype
Figure 3. Standardized count heat map for Logos prototype
Figure 5. Standardized duration heat map for Logos prototype
Next, we used the standardized duration heat maps (Figures 4 and 5) to compare the amount of time participants fixated on areas across the prototypes. These reveal a longer fixation on the text next to the images in the Logos prototype when compared to the Faces prototype, but very little fixation on the images themselves in either prototype. The count and duration heat maps show fewer and shorter fixations on the text on the Faces prototype compared to the text on the Logos prototype. This indicates that participants viewed the information required to complete the critical tasks for less time on the Faces prototype. This, in turn, suggests that, compared to the images on the Logos prototype, the images of faces were more helpful to users in retrieving and processing the needed information. This supports the shorter completion time found for these tasks on the Faces prototype in Study I.
Additionally, we examined the fixation duration on various parts of the two prototypes. This analysis shows a longer fixation on the text next to the left image compared to the text next to the right image on the same page (both on the Faces and Logos prototypes). According to usability literature [7], viewing a page consists of two cognitive stages. In the first stage, a user scans an area to find a point of entry or an anchor. In the second stage, the user uses the anchor to gather information, typically located around the anchor. Because users tend to exhibit a left-to-right order preference when viewing a page, the longer fixation time on the left side of the Expert Insight section may be due to this behavior. Because of the left-to-right preference, it is likely that users chose to anchor on the information on the left side of the Expert Insights section when familiarizing themselves with the content of that section. This,
6
Proceedings of the 43rd Hawaii International Conference on System Sciences - 2010
then, caused the higher fixation duration on the left side. Thus, it is likely that, when participants were completing the task related to the information on the right (Task 2), they did not need to examine the information as extensively because they were already familiar with the content.
6. Discussion In this paper, we investigated user behavior in relation to images in the area of a homepage located below the fold. We used two prototypes of the same page to examine 1) whether including images of people (experts) had an influence on perceptions of visual appeal, and 2) whether a user’s trust assessment was correlated with visual appeal rating. Additionally, we examined whether the inclusion of such images had an impact on user performance on tasks involving areas related to those images. As predicted, the results showed that the page with images of people was rated significantly more visually appealing than the page that included images of logos. These results, showing a large effect size, are consistent with social presence theory and suggest that the inclusion of images, even when they are not placed at the top of visual hierarchy [7] (i.e., they are located below the fold), can positively affect the appeal of a homepage. Moreover, the participants’ visual appeal ratings were found to be a significant predictor of their trust ratings with a medium effect size. These results support the literature suggesting that the beauty of a page may affect whether people trust it[8, 13] . While the results show that visual appeal can significantly and positively affect trust, it does not mean that good aesthetics are all that is needed to gain the trust of users. In today’s crowded online markets, functionality and utility are expected [24]. In such a market, where competition has shifted towards user experience [25], companies are likely to benefit from pages that meet users’ expectations of functionality as well as their aesthetic needs. Our analysis also showed that people completed tasks significantly faster when using the page with images of people, while maintaining accuracy. These results indicate that the presence of faces compared to logos helped users to find the task related information faster. This is further evidenced by the fewer fixation counts on the text on the Expert Insights section of the Faces prototype. It is of particular note that an image of a face was more effective at drawing users’ attention for a task of finding an opinion about a company than the company’s own logo (Task 1). This is consistent with
literature that indicates that users are attracted to faces[6, 26]. Heat maps showed that, while users were attracted to the area in which images were located, there was little or no fixation on the images of the faces or logos themselves. Rather, there was fixation on the text next to images. The lack of direct fixation on images can be explained by the task-based nature of the study and web page. Literature provides evidence that, when completing tasks on a web page, users have fewer direct fixations on images than when they are browsing [26]. The fact that the text positioned next to the logos received a higher number of fixations and a longer amount of fixation compared to the Faces prototype supports the lower task completion time using the Faces prototype. This behavior suggests that the presence of faces allowed users to process the textual information needed for the task with less effort, leading to a lower fixation amount and duration. According to the theory of visual rhetoric, graphics can help to deliver a message more effectively [21]. The results indicate that, in our study, the images of faces were more effective than logos in delivering the intended message. It was also found that participants completed the task that required information on the left side of the Expert Insights section faster than the task that required the right side of the same section, regardless of the prototype condition. This was supported by eye tracking, which showed a higher fixation time on the left side than the right, suggesting that participants familiarized themselves with the Expert Insights section by viewing the left side first. These results are consistent with research that indicates users tend to exhibit a left-to-right viewing order [7]. The heat maps also revealed that participants had a higher fixation count on the Tips & Tools section, the area above the Expert Insights section, on the Logos prototype. This again indicates that faces may have served as a better cue for the needed information than the logos. According to Faraday [7], people first scan the page for an anchor, and then search for information around the anchor. The lower fixation count on the Tips & Tools section of the Faces prototype suggests that users had a more efficient scanning phase (fewer fixations) than the Logos condition. In other words, people using the Faces prototype were able to determine which area to anchor onto without a great deal of searching when compared to the people using the Logos prototype.
7
Proceedings of the 43rd Hawaii International Conference on System Sciences - 2010
While the fixation count was lower for the Tips & Tools section on the Faces prototype than on the Logos prototype, it had a higher fixation duration. This further supports the above interpretation. Because the faces attracted attention to a useful anchor, people spent more time reading the information rather than scanning the area for an anchor. In other words, the Logos prototype’s higher fixation count on the Tips & Tools section, along with the higher fixation count on the Expert Insights section, suggests that users may have been searching for a contextual clue during the tasks and were unable to find one as easily as they did in the Faces prototype. The higher fixation duration on the Faces prototype, on the other hand, may be due to the attention drawn to the area by the images of the faces, which served as anchors. Together, our results indicate that the images of the faces may have drawn the users’ attention to areas around the images, but they were not distracting to their purpose.
7. Limitations & Future Research This research was conducted through both an online study and a laboratory study. During the laboratory portion, an unobtrusive eye tracker was used in a setting designed to resemble a realistic user environment. Of course, as with any study, the generalizability of these results is limited to the environment and task. This research can be extended in future studies in several ways. Users may react differently in distinct contexts. Web pages other than homepages may lead to different results, as could website genres unrelated to finance. A web page deeper within the information architecture of a retail website, for example, may yield very different results. Similarly, web pages of lower aesthetic quality may cause users to react differently to images of people. The location of the images on the page may play a role in user behavior and reactions as well, particularly in the context of eye tracking. For example, in this study, the images were located below the fold of the web page; future studies can extend this research by examining the effect of images above the fold of the web page. Furthermore, future studies should examine the effect of the size of the images, perhaps in conjunction with location, as well as different content. It may be that non-face images of a different genre are more effective than images of faces.
8. Conclusion The results of this research show that users found a page with images of people more visually appealing than a page with images of non-people (“logos”) and
that their trust ratings was significantly correlated with their visual appeal ratings. Additionally, our analysis shows that participants completed tasks using the Faces prototype significantly faster than with the Logos prototype. Further, the completion time was significantly affected by the horizontal order of information on the web page. The finding that visual appeal is a significant predictor of trust is of particular interest to companies. These results indicate that, by improving the appeal of their web pages, companies can help to improve trust in the web page and, possibly, in the company itself. Our results indicate that, when it is appropriate to the content, the inclusion of images of faces can help to increase the appeal of a page. The heat maps suggested that images of faces were useful to draw attention to the textual information which served as an anchor for participants, as they were able to have a higher fixation duration on the relevant information rather than the many fixations and lower fixation duration found on the Logos prototype. Together, these results suggest that companies can benefit from adding faces to their websites when their inclusion is appropriate to the message communicated. Additionally, the results indicating a faster completion time for the task relevant to the left side of the page suggest that including frequently completed tasks on the left side of a page can potentially increase the efficiency of users and, thus, improve the user experience. This research has important theoretical and practical implications. Theoretically, it expands past research on the effect of images, and particularly human images (e.g., faces), on user behavior. It also provides evidence of a positive correlation between visual appeal and trust. Further, this study contributes to human computer interaction research by providing further evidence that fixation patterns can provide valuable information regarding user behavior. This objective measure provides unique value in that it continuously captures user behavior, whereas subjective measures typically take place at the beginning and/or end of sessions. This use of eye tracking can stimulate a new and productive line of research. Practically, this research provides insight into the user experience, enabling companies to improve the web experience of their users. Such an improvement can help companies to increase their reach and, therefore, their market share. In particular, the results pertain to areas of web pages located below the fold.
8
Proceedings of the 43rd Hawaii International Conference on System Sciences - 2010
Because users exhibit a top down viewing preference [7], enticing users to view content located at the bottom of web pages, particularly below the fold, is often reported to be problematic [5]. Thus, finding ways to attract attention to components below the fold is of particular value to companies.
9. References [1]
[2]
F. Biocca, C. Harms, and J.K. Burgoon, Toward a more robust theory and measure of social presence: review and suggested criteria, Presence, 12(5), 2003. S. Burton-Taylor, Eye tracking: greater insight or fashion fad? Web Usability Partnership, 2009, http://www.webusability.co.uk/2009/eyetracking-greater-insight-or-fashion-fad
[3]
J. Cohen, Statistical Power Analysis for the Behavioral Sciences, Lawrence Erlbaum Associates, Publishers, Hillsdale New Jersey, 1988.
[4]
D. Cyr, M. Head, H. Larios, and B. Pan, Exploring Human Images in Website Design: A Multi-Method Approach, MIS Quarterly, 33(3), 2009.
[5]
[6]
S. Djamasbi, T. Tullis, J. Hsu, E. Mazuera, K. Osberg, and J. Bosch, Gender Preferences in Web Design: Usability Testing through Eye Tracking, in Proceedings of the 13th Americas Conference on Information Systems, 2007, Keystone, Colorado. S. Djamasbi, T. Tullis, M. Siegel, F. Ng, D. Capozzo, and R. Groezinger, Generation Y & Web Design: Usability Testing through Eye Tracking, in Proceedings of the Fourteenth Americas Conference on Information Systems, 2008, Toronto, Canada.
[7]
P. Faraday, Visually Critiquing Web Pages in 6th Conference on Human Factors and the Web, 2000, Austin, Texas.
[8]
B. Fogg, J. Marshall, O. Laraki, A. Osipovich, C. Varma, N. Fang, J. Paul, A. Rangnekar, J. Shon, P. Swani, and M. Treinen, What makes Web sites credible? a report on a large quantitative study, in Proceedings of the SIGCHI conference on Human factors in computing systems, 2001, Seattle, Washington.
[9]
B.L. Fredrickson, Positive Emotions and Upward Spirals in Organizations, in: K.S. Cameron, J.E. Dutton, and R.E. Quinn, Eds., Positive Organizational Scholarship, BerretKoehler Publishers, Inc., San Francisco, 2003.
[10]
D. Gefen and D. Straub, Managing User Trust in B2C e-Services, E-Service Journal 2(2), 2003.
[11]
K. Hassanein and M. Head, Manipulating Social Presence through the Web Interface and its Impact on Attitude towards Online Shopping, International Journal of HumanComputer Studies, 65(8), 2007.
[12]
M.M. Head, Y. Yuan, and N. Archer, Building Trust in e-Commerce: A Theoretical Framework, in Proceedings of the Second World Congress on the Management of Electronic Commerce, 2001.
[13]
K. Karvonen, The Beauty of Simplicity, in Proceedings on the Conference on Universal Usability, 2000, Arlington, Virginia: ACM
[14]
P. Lanford and R. Hübscher, Trustworthiness in E-Commerce, in Proceedings of the 42nd annual Southeast regional conference, 2004, Huntsville.
[15]
T. Lavie and N. Tractinsky, Assessing dimensions of perceived visual aesthetics of web sites, International Journal of HumanComputer Studies, 60(3), 2004.
[16]
J. Nielsen, Usability metrics: Tracking interface improvements, IEEE Software, 13(6), 1996.
[17]
J. Nielsen, Usability ROI Declining, But Still Strong January. 2008,
[18]
K. Rayner, S.P. Liversedge, S.J. White, and D. Vergilino-Perez, Reading disappearing text: cognitive control of eye movements, Psychological Science, 14(4 ), 2003.
[19]
R. Rosenthal and R. Rosnow, Essentials of Behavioral Research, McGraw Hill, New York, NY, 2008.
[20]
E. Sallnäs, K. Rassmus-Gröhn, and C. Sjöström, Supporting presence in collaborative environments by haptic force feedback, ACM Transactions on ComputerHuman Interaction, 7(4), 2000.
9
Proceedings of the 43rd Hawaii International Conference on System Sciences - 2010
[21]
L.M. Scott, Images in Advertising: The Need for a Theory of Visual Rhetoric, Journal of Consumer Research, 21, 1994.
[22]
J. Short, E. Williams, and B. Christie, The Social Psychology of Telecommunications, John Wiley and Sons Ltd, New York, 1976.
[23]
M. Tanis and T. Postmes, Social Cues and Impression Formation in CMC, Journal of Communication, 53(4), 2003.
[24]
N. Tractinsky, Toward the Study of Aesthetics in Information Technology, in Twenty-Fifth International Conference on Information Systems, 2004, Washington, DC.
[25]
N. Tractinsky, Does Aesthetics Matter in Human-Computer Interaction, in: C. Stary, Ed., Mensch & Computer, Oldenbourg Verlag, München 2005.
[26]
T. Tullis, M. Siegel, and E. Sun, Are people drawn to faces on webpages?, in Proceedings of the 27th international Conference Extended Abstracts on Human Factors in Computing Systems, 2009.
[27]
B. Violino, The Intangible Benefits of Technology are Emerging as the Most Important of All, in InformationWeek. 1997.
[28]
A. Vollman, U.S. Retail E-Commerce Declines 3 Percent in Q4 2008 versus Year Ago but Sales for Full Year Grew By 6 Percent. 2009,
[29]
H. Weinreich, H. Obendorf, H. E., and M. Mayer, Not quite the average: An empirical study of Web use, ACM Transactions on the Web, 2(1), 2008.
10