The International Archives of the Photogrammetry, Remote Sensing and Spatial Information Sciences, Volume XLI-B2, 2016 XXIII ISPRS Congress, 12–19 July 2016, Prague, Czech Republic
EFFICIENT AND ACCURATE INDOOR LOCALIZATION USING LANDMARK GRAPHS F. Gu a , A. Kealy a , K. Khoshelham a , J. Shang b a
b
Department of Infrastructure Engineering, University of Melbourne, Melbourne, Australia
[email protected], (a.kealy, k.khoshelham)@unimelb.edu.au Faculty of Information Engineering, China University of Geosciences, Wuhan, China -
[email protected] Commission II, WG II/8
KEY WORDS: Indoor Localization, Landmark Graph, Dead Reckoning, Smartphones, Spatial Information
ABSTRACT: Indoor localization is important for a variety of applications such as location-based services, mobile social networks, and emergency response. Fusing spatial information is an effective way to achieve accurate indoor localization with little or with no need for extra hardware. However, existing indoor localization methods that make use of spatial information are either too computationally expensive or too sensitive to the completeness of landmark detection. In this paper, we solve this problem by using the proposed landmark graph. The landmark graph is a directed graph where nodes are landmarks (e.g., doors, staircases, and turns) and edges are accessible paths with heading information. We compared the proposed method with two common Dead Reckoning (DR)-based methods (namely, Compass + Accelerometer + Landmarks and Gyroscope + Accelerometer + Landmarks) by a series of experiments. Experimental results show that the proposed method can achieve 73% accuracy with a positioning error less than 2.5 meters, which outperforms the other two DR-based methods. 1.
INTRODUCTION
The advent of sensor-equipped smartphones has enabled a wide range of applications such as museum and shopping guides (Bihler et al., 2011; Shang et al., 2011), emergency response (Renau et al., 2007), personal task reminder (Lin & Hung, 2014), asset tracking (Boustani et al., 2011), search and rescue (Zorn et al., 2010), advertising (Dhar & Varshney, 2011; Dao et al., 2012), and location-enabled social networks (Cho et al., 2011). The fundamental task of these applications is determining the location of mobile objects (e.g., a person or an asset). A number of solutions for indoor positioning have been proposed and developed. They differ from each other in terms of positioning techniques used, coverage, accuracy, cost of deployment and maintenance. WiFi-based indoor positioning is one of the most widely used indoor localization techniques since it can make use of existing WiFi infrastructure. However, it has the need to collect fingerprints, which is time-consuming and labor-intensive, or to know the exact locations of access points (APs), which is infeasible in some cases. Also, WiFi technology is recognized as an energyhungry technology (Thiagarajan et al., 2011), resulting in a remarkable reduction in battery life. In order to deal with these problems, Dead Reckoning (DR) is often used, which can estimate the current location in real time given an initial location. The popularity of smart devices equipped with inertial sensors enables DR to be widely used. It is especially useful for localization and tracking in the wireless signal denied areas. However, the accumulated error of DR grows over time, resulting in the long-term DR practically being useless. Combining DR with other absolute positioning techniques such as WiFi (Jin et al., 2013) and UWB (De Angelis et al., 2010) can eliminate both the accumulated location error of DR and the jumping estimations by absolute positioning techniques for a short time. However, these absolute localization techniques are not always available and often need to spend extra cost on the deployment and maintenance. A promising solution to solve the accumulated error problem of DR is the fusion of spatial information, which can achieve rela-
tively accurate indoor localization with little or with no need for extra hardware. There are two commonly-used methods of fusing spatial information to improve location accuracy, namely map matching and spatial model-aided method (Shang et al., 2015). A typical map matching method is landmark matching (Wang et al., 2012). The advantages of landmark matching method are its simplicity and high operation efficiency. However, it is sensitive to the completeness of landmark detection, and inaccurate matching may lead to a larger localization error. Other map matching methods like trajectory matching and Bayesian approachesbased matching can usually achieve higher accuracy, but they are computationally expensive, making them impractical for applications running on resource-limited mobile devices like smartphones. Another method of fusing spatial information to enhance localization accuracy is using spatial models. Compared with basic indoor maps, indoor spatial models include richer information, not only static objects (e.g., rooms, doors, sensors, furnitures) and dynamic objects (e.g., people), but also their spatial relationships. With more geometric, topological and semantic information, spatial models can be used to significantly improve location accuracy as well as to achieve more reliable location-based services (Becker & Durr, 2005; Stevenson et al., 2010). However, automated methods for reconstructing indoor spatial models are in their infancy and manual methods are labor-intensive and slow (Diaz-Vilarino et al., 2015). This study aims to achieve efficient and accurate indoor localization by utilizing the proposed landmark graph. Although lots of research work has been done in this field, some critical issues still require to be explored. Existing research on fusing spatial information is either computation-intensive or sensitive to the completeness of landmark detection (for the landmark matching method). We solve this problem by proposing the concept of the landmark graph, which is a directed graph where nodes are landmarks and edges are accessible paths with heading information. Heading estimation is important for accurate indoor localization. Prior work focuses on integrating different sensor data to obtain accurate, specific heading estimation. However, we observe that users do not move arbitrarily in some limited environments and
This contribution has been peer-reviewed. doi:10.5194/isprsarchives-XLI-B2-509-2016
509
The International Archives of the Photogrammetry, Remote Sensing and Spatial Information Sciences, Volume XLI-B2, 2016 XXIII ISPRS Congress, 12–19 July 2016, Prague, Czech Republic
2.1
Architecture
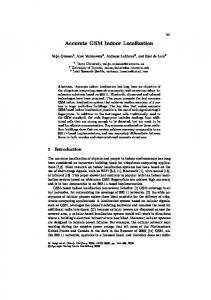
The system architecture is shown in figure 1, including three main components, namely motion model (which consists of step length and heading estimation), landmark recognition and detection, location estimator. The estimation of step length is based on the accelerometer readings, which can be calibrated by the results of the location estimator. Compass readings and gyroscope readings are jointly used to compute the direction. All these sensor data in figure 1 and WiFi measurements (which is optional) are used to recognize and detect landmarks. While the locations of most landmarks (e.g., stairs, doors, corners, elevators) can be derived from floor maps, sensor data can provide extra landmarks like magnetic landmarks. The overall process falls into two phases: firstly, a landmark graph is constructed based on map information and these sensor readings; then, the location estimator computes users’ location according to the constructed landmark graph, outputs from the motion model component, and real-time landmark detection results. The details about landmarks will be introduced in Section 2.4. WiFi
Barometer Accelerometer Compass Gyroscope
Map
Landmark Recognition & Detection
Landmark Graph
Step Length Estimation
Location Estimator
Heading Estimation
Location
Figure 1: System architecture
2.2
acc-y (m/s 2 )
SYSTEM OVERVIEW
acc-z (m/s 2 )
2.
acc-x (m/s 2 )
they usually follow a relatively fixed motion pattern. For example, users tend to walk along a straight line in the corridor environments. Therefore, we argue that it is not necessary to obtain specific heading readings in some cases. On the contrary, constraining users’ motion direction can help achieve higher location accuracy when they are located in some limited environments like corridors since the constrained direction is more robust than specific heading readings provided by the compass or gyroscope.
Step Length Estimation
When users are walking, there is a repetitive and periodical pattern in the accelerometer readings, as depicted in figure 2. By utilizing the repetitiveness and periodicity of users’ walking, we can compute how many steps users have traveled and further infer the distance they have moved since the length of each step for a particular user is relatively fixed. To avoid the influence of smartphone’s orientation on the step detection method, we only utilize the magnitude of the acceleration: p at = axt 2 + ayt 2 + azt 2 (1) where axt , ayt , azt are the accelerometer readings along the Xaxis, Y -axis and Z-axis at time t, respectively. Initially, the step length is empirically set to a certain value (e.g., 0.65 meters for this research), and then is adaptively adjusted to reach an optimal value for the user according to landmark graph constraints and sensor readings.
1 0 -1 -2 0
50
100
150
200
250
0
50
100
150
200
250
100
150
200
250
4 2 0 -2 14 12 10 8 6 0
50
Number of Samples
Figure 2: Repetitiveness and periodicity of users’ walking (The user walks with the phone in the hand without swinging).
2.3
Heading Estimation
Generally, the smartphone’s compass can provide the angle of its orientation relative to the perceived north, but it is affected by the ferromagnetic materials and phone’s poses. Therefore, some researchers use only the gyroscope to compute the user’s heading (Wang et al., 2012), which eliminates the magnetic effect on the compass. However, the gyroscope has the drift problem. An effective solution is using Kalman filter to combine the compass readings and gyroscope readings, which can eliminate the magnetic effect on the compass and the drift problem of the gyroscope (Shang et al., 2015). This combination can provide relatively accurate heading estimation when the phone is held in the hand with Y-axis consistent with users’ movement direction. However, it is not always the case since users may put their phones in any poses, making it difficult to retrieve the information related to users’ turning from the gyroscope readings. The main hypothesis of this research is that it is not necessary to compute the exact movement direction in corridor-rich indoor environments for indoor localization. This is because the user can only move in two directions in a corridor. In this paper, we make use of the landmark graph where the direction between two landmarks is constrained and pre-set. The compass and gyroscope are only used to provide coarse heading and detect whether there is a turn or corner. However, we adopt the Kalman filter to fuse the compass readings and gyroscope readings for providing heading information when the user is located in a big open space where there are few obstacles or no other constraints (e.g., a big room), similar to the work of Shang et al. (2015). 2.4
Landmark Detection & Landmark Graph Construction
Landmarks in this research refer to location points where users behave in a predictable and identifiable pattern or where sensor data present a distinct change pattern. Corners or turns, for instance, compel users to change their walking direction; a door imposes users to switch their motion states from walking to still. The locations of most landmarks like doors, elevators, stairs, corners and turns can be obtained from floor maps, which we assume are available since indoor maps are a basic requirement for location-based services and sensing applications. Figure 3 shows those landmarks that can be inferred from maps. Other landmarks like magnetic landmarks (e.g., the location of a metal equipment where the magnetometer readings present a distinct change pattern) and WiFi landmarks (e.g., the location of an AP where the
This contribution has been peer-reviewed. doi:10.5194/isprsarchives-XLI-B2-509-2016
510
The International Archives of the Photogrammetry, Remote Sensing and Spatial Information Sciences, Volume XLI-B2, 2016 XXIII ISPRS Congress, 12–19 July 2016, Prague, Czech Republic
smartphone has the strongest signal strength) can be gradually learned from sensor readings, which can be used to assist subsequent localization. The detection of landmarks is based on the distinct change pattern in one or more types of sensor readings. Specifically, the door landmarks are detected by utilizing accelerometer readings and compass readings. A door opening operation is often associated with a change in users’ motion state and a change in their walking direction. The corner landmarks are detected by using both compass readings and gyroscope readings. Only when both the variation in compass readings over a certain time and that in gyroscope readings over the same time period exceed an angle threshold and an angular velocity threshold, respectively, we think this point is likely a corner landmark. Magnetic landmarks are detected according to whether the average value of a window of magnetometer readings exceeds a pre-set threshold. The detection methods for corner landmarks and magnetic landmarks are the same as those in the work of Shang et al. (2015). The barometer data are used to detect both staircase landmarks and elevator landmarks, which can be distinguished from each other using the pressure derivatives (Gu et al., 2015).
Room 302 Room 309 Room 310
Room 301
15
Room 313
17 14
1
16
19 18
3 2
9
4 5
Stairs
13
7 6
8
10
Room 308
Room 307
Room 306
Corridor
11
12
Doors Room 309 Corners
Room 305
Room 304
Figure 3: Landmarks derived from maps
Then, we can construct the corresponding landmark graph using map information and outputs from the landmark detection component. A landmark graph consists of nodes (landmarks) and edges (accessible paths). A node is represented by a tuple of < ID, P roperty, Condition > where P roperty indicates whether it is a staircase landmark or other types of landmark and Condition denotes the detection condition of this landmark. Similarly, an edge is represented by a tuple of < ID1 , ID2 , Direction, Distance > where ID1 and ID2 are the identifiers of two landmarks that the edge connects, Direction is the direction of the path connecting these two landmarks relative to the perceived north, and Distance is the distance between them. Figure 4 gives an example of the landmark graph that consists of part of landmarks in figure 3.
1
(d12 , 12 )
(d 21 , 21 ) 2
(d13 , 13 )
3
(d 45 , 45 )
(d31 , 31 ) (d 41 , 41 ) (d14 , 14 )
(d58 , 58 )
5
(d85 , 85 )
(d54 , 54 )
8
(d 47 , 47 )
Dead Reckoning-based Location Estimation with Landmark Graph Constraints
The basic idea of DR is to infer the current position according to the moving direction, velocity and sampling interval, given the initial position. Suppose that (xt , yt , zt ) and (xt+1 , yt+1 , zt+1 ) are the locations of a user at time t and t + 1, respectively. dSt is the corresponding displacement and dθt+1 is the variation of the direction θ, then the equation set for estimating his or her real-time locations can be written as: xt+1 = xt + dSt sin θt yt+1 = yt + dSt cos θt (2) θt+1 = θt + dθt+1 z t+1 = zt + f (bt+1 − bt ) where f is a function determining the change in the height according to barometer readings b. DR method suffers from the problem of the accumulated error, which means that it needs to be periodically calibrated. In this paper, we make use of the constraints from the proposed landmark graph to solve this problem. Correspondingly, the equation set (2) can be rewritten as: xt+1 = xt + dSt sin(Ht (θcompass , θgyro , θgraph )) yt+1 = yt + dSt cos(Ht (θcompass , θgyro , θgraph )) (3) zt+1 = zt + f (bt+1 − bt ) where Ht is a function that offers the constrained walking direction by fusing compass readings θcompass , gyroscope readings θgyro and the direction θgraph provided by the landmark graph. The compass and gyroscope are jointly used to provide the coarse heading information in order to eliminate the influence of metal devices on the compass. Then, this coarse heading is compared with the direction stored in the landmark graph. When the variation between them is less than a heading threshold, the direction from the landmark graph is adopted as the user’s heading. This is especially useful in the corridor environments where the user can only moves in two directions. When the variation exceeds the pre-set threshold, the heading provided by the compass and gyroscope is used as the user’s heading.
20
The accumulated error of DR can be periodically eliminated when the user is detected to be at the location of a landmark, so as to maintain a certain accuracy. When there are more than one landmark within the user’s reach, we can determine which one to be used for calibrating his or her location according to the matching degree between his or her historical walking trajectory and the landmark graph. 3. 3.1
EXPERIMENTS AND RESULTS
Experimental Setup
15
The proposed indoor localization solution was evaluated by a series of experiments conducted within the Infrastructure Engineering building located at the Parkville campus of the University of Melbourne and the surroundings of this building. This office building consists of five floors, which is a typical office 14 environment, including elevators, staircases, corridors, office rooms and electronic equipments. The length of pre-set test path is about 163 meters, going through two floors of this building.
17 16
6
(d 74 , 74 ) 4
2.5
7
Figure 4: An example of landmark graphs
The device we used is a Samsung Galaxy S III phone equipped with the accelerometer, magnetometer, gyroscope, and barometer. The tester walked along the pre-set path with the phone in 11required to12rethe hand. During the experiments, the tester was port the pre-set markers they encountered to evaluate the location
This contribution has been peer-reviewed. doi:10.5194/isprsarchives-XLI-B2-509-2016
511
13
The International Archives of the Photogrammetry, Remote Sensing and Spatial Information Sciences, Volume XLI-B2, 2016 XXIII ISPRS Congress, 12–19 July 2016, Prague, Czech Republic
3.2
75
Heading (degree)
accuracy. The data recorded include outputs from the accelerometer, gyroscope, compass, and barometer. All these data were recorded with their corresponding timestamps so that we could align data from different sensors to jointly infer ground truth location points.
70
65
60
Accuracy Evaluation Method 55
e=
N X
N
X 0
ei =
L(pi ) − L(pi )
i=1
(4)
Number of Compass Samples 50 0
50
100
150
200
250
200
250
(a) Compass readings 1.5
1
Yaw (rad/s)
The accuracy evaluation method in the research of Shang et al. (2015) was used in this study to assess the location accuracy. The basic idea of this method is shown in figure 5, in which the interpolation method is used to obtain the actual locations between two makers according to sampling interval and timestamps. The distance between two markers was 2 meters in this study. After computing the localization error at each location point, the overall error can be calculated using the following formula:
0.5
0
i=1 -0.5
where L(pi ) is the location of the ith marker (including the vir0 tual markers generated by interpolating), and L(pi ) is the estimated location corresponding to the ith marker.
-1 0
50
100
150
Number of Gyroscope Samples
(b) Gyroscope readings
p'i-3
Virtual Markers by Interpolating
Estimated Locations
Timeline of Markers Timeline of Estimated Locations
pi-2
p'i-2
pi-1
p'i-1
pi
p'i
pi+1
p'i+1
Figure 5: The accuracy evaluation method.
3.3
Results
It is a prerequisite for DR-based localization methods to know the initial location, which can be done by manual input of users or by using other localization systems like WiFi fingerprinting-based systems. It is also feasible to infer the initial location by utilizing the constructed landmark graph and sensor data collected. However, the focus of this paper is not how to obtain the initial location, and hence we simply assume that the initial location is known.
Figure 6: The changes in the compass and gyroscope readings when the user walks along a straight path with the phone in the hand (without swinging) The DR method suffers from the accumulated error problem, which is illustrated in figure 7. In figure 7, the black line represents a part of the ground-truth path that the user walks on. The blue line with the dot marker is the corresponding result of DR using the compass to provide the heading, while the green line with the plus marker is that using the gyroscope reading for calculating the heading where the initial heading value is given by the compass. From this figure, we can see that the error of DR increases significantly with time, which means that landmarks or other spatial information are needed to bound the localization accuracy. 10 8 6 4
Y (meter)
pi-3
Actual Markers
2 0 -2 -4
Next, we analyze the performance of the proposed method, beginning with the explanation of why we need to constrain users’ walking direction, then presenting the localization result of using the landmark graph constraints.
-6
Using Compass Using Gyroscope Ground-truth Path
-8 -10 0
5
10
15
20
25
30
X (meter)
Figures 6(a) and 6(b) show that the readings for both the compass and the gyroscope fluctuate even if the user walks along a straight path. This fluctuation is especially significant when the user walks in electronic equipment-rich environments even if he or she does not take a turn. The error in the heading estimation would certainly result in an error in localization results. This problem can be addressed by constraining users’ heading when they are located in the limited environments. This is because with the constrained direction, the user’s heading remains unchanged when he or she walks along a straight path, which would not cause a localization error.
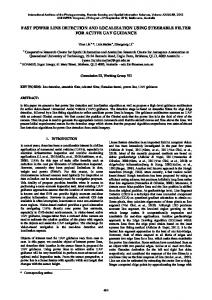
Figure 7: The accumulated error of the DR method Next, we compare the localization accuracy of the proposed method with that of the commonly-used landmarks+DR methods. Figure 8 shows the results of different localization methods, from which we can see that the proposed method outperforms the other two methods. Specifically, our method can achieve 73% accuracy with the error less than 2.5 meters, compared to 45% for the other two methods. When the accuracy reaches up to 100%, the corresponding error for our method is less than 3.5 meters, but the
This contribution has been peer-reviewed. doi:10.5194/isprsarchives-XLI-B2-509-2016
512
The International Archives of the Photogrammetry, Remote Sensing and Spatial Information Sciences, Volume XLI-B2, 2016 XXIII ISPRS Congress, 12–19 July 2016, Prague, Czech Republic
errors for the other two methods reach to 7.2 meters (Gyro + Acc + Landmarks) and 10 meters (Compass + Acc + Landmarks), respectively. 100%
Cho, E., Myers, S. A., Leskovec, J., 2011. Friendship and mobility: user movement in location-based social networks. In Proceedings of the 17th ACM SIGKDD international conference on Knowledge discovery and data mining, ACM, San Diego, California, USA; pp. 1082-1090.
90% 80% 70%
CDF
Boustani, A., Girod, L., Offenhuber, D., Britter, R., Wolf, M., Lee, D., Miles, S., B Biderman, A., Ratti, C., 2011. Investigation of the waste-removal chain through pervasive computing. IBM Journal of Research and Development, vol. 55, 11:1-11:11.
60% 50%
Dao, T.H., Jeong, S.R., Ahn, H., 2012. A novel recommendation model of location-based advertising: Context-Aware Collaborative Filtering using GA approach. Expert System Applications, vol. 39, 3731-3739.
40% 30% Compass + Acc + landmarks Gyro + Acc +landmarks The Proposed Method
20% 10% 1
2
3
4
5
6
7
8
9
10
Localization Error (meter)
Figure 8: Performance comparison of different methods 4.
CONCLUSION & DISCUSSION
We present a novel localization algorithm using the landmark graph. By constraining the heading between two landmarks and using detected landmarks for calibrating the accumulated error of DR, we achieve 73% accuracy with a positioning error less than 2.5 meters, which is good enough for a variety of indoor applications. However, there are still some limitations of the proposed algorithm to be solved in the near future. Firstly, we consider only the situation that the user carries his or her smartphone in the hand without significant swinging, which may not be always the case in real world. Secondly, the extraction of landmarks from maps is manually done in this research, which may introduce an error on determining the locations of landmarks. In addition, only the walking state is considered when conducting localization. In fact, users in different motion states have varying step lengths. For example, the step length for running is different from that for walking. In the future, we will consider different smartphone poses and users’ motions states, which will enable our algorithm more practical. We also explore how to automatically determine the locations of landmarks, including those that can be inferred from maps and those that are not be reflected by maps. In addition, the performance of our method can be further improved by developing more accurate step detection methods and step length estimation methods. 5.
ACKNOWLEDGMENTS
This work is jointly supported by the National Natural Science Foundation of China (Grant No. 41271440) and by the China Scholarship Council - University of Melbourne Research Scholarship (Grant No. CSC 201408420117). 6.
De Angelis, A., Nilsson, J., Skog, I., Handel, P., Carbone, P., 2010. Indoor positioning by ultrawide band radio aided inertial navigation. Metrology and Measurement Systems, vol. 17, 447460. Dhar, S., Varshney, U., 2011. Challenges and business models for mobile location-based services and advertising. ACM Communications, vol. 54, 121-128. Diaz-Vilarino, L., Khoshelham, K., Martinez-Sanchez, J., Arias, P., 2015. 3D modeling of building indoor spaces and closed doors from imagery and point clouds. Sensors, vol. 2, 3491-3512. Gu, F., Kealy, A., Khoshelham, K., Shang, J., 2015. User-Independent Motion State Recognition Using Smartphone Sensors. Sensors, vol. 15, 30636-30652. Lin, C.Y., Hung, M.T., 2014. A location-based personal task reminder for mobile users. Personal Ubiquitous Computing, vol. 18, 303-314. Jin, Y., Soh, W. S., Motani, M., Wong, W.C., 2013. A robust indoor pedestrian tracking system with sparse infrastructure support. Mobile Computing, IEEE Transactions on, vol. 12, 13921403. Renaudin, V., Yalak, O., Tome, P., Merminod, B., 2007. Indoor Navigation of Emergency Agents. European Journal of Navigation, vol. 5, 36-45. Shang, J., Gu, F., Hu, X., Kealy, A., 2015. APFiLoc: An InfrastructureFree Indoor Localization Method Fusing Smartphone Inertial Sensors, Landmarks and Map Information. Sensors, vol. 10, 2725127272. Shang, J., Hu, X., Gu, F., Wang, D., Yu, S., 2015. Improvement Schemes for Indoor Mobile Location Estimation: A Survey. Mathematical Problems in Engineering, vol. 2015, 1-32. Shang, J., Yu, S., Gu, F., Xu, Z., Zhu, L., 2011. A mobile guide system framework for museums based on local location-aware approach. In 2011 International Conference on Computer Science and Service System, IEEE, Nanjing, China; pp. 1935-1940. Stevenson, G., Ye, J., Dobson, S., Nixon, P., 2010. Loc8: a location model and extensible framework for programming with location. IEEE Pervasive Computing, vol. 1, 28-37.
REFERENCES
Becker, C., Durr, F., 2005. On location models for ubiquitous computing. Personal and Ubiquitous Computing, vol. 9, 20-31. Bihler, P., Imhoff, P., Cremers, A.B., 2011. SmartGuide-A Smartphone Museum Guide with Ultrasound Control. Procedia Computer Science, vol. 5, 586-592.
Thiagarajan, A., Ravindranath, L., Balakrishnan, H., Madden, S., Girod, L., 2011. Accurate, low-energy trajectory mapping for mobile devices. In Proceedings of the 8th USENIX conference on Networked systems design and implementation, USENIX Association, Boston, MA, USA; pp. 267-280.
This contribution has been peer-reviewed. doi:10.5194/isprsarchives-XLI-B2-509-2016
513
The International Archives of the Photogrammetry, Remote Sensing and Spatial Information Sciences, Volume XLI-B2, 2016 XXIII ISPRS Congress, 12–19 July 2016, Prague, Czech Republic
Wang, H., Sen, S., Elgohary, A., Farid, M., Youssef, M., Choudhury, R.R., 2012. No need to war-drive: unsupervised indoor localization. In Proceedings of the 10th international conference on Mobile systems, applications, and services, Ambleside, UK; pp. 197-210. Zorn, S., Rose, R., Goetz, A., Weigel, R., 2010. A novel technique for mobile phone localization for search and rescue applications. In The First International Conference on Indoor Positioning and Indoor Navigation (IPIN), Zurich, Switzerland; pp. 1-4.
This contribution has been peer-reviewed. doi:10.5194/isprsarchives-XLI-B2-509-2016
514