Efficient Assembly of Social Semantic Networks Benjamin Markines1,2 1
∗
Heather Roinestad1
Filippo Menczer1,2
Department of Computer Science, School of Informatics, Indiana University, Bloomington, Indiana, USA 2 Complex Networks Lagrange Laboratory, Institute for Scientific Interchange Foundation, Torino, Italy
ABSTRACT
Categories and Subject Descriptors
Social bookmarks allow Web users to actively annotate individual Web resources. Researchers are exploring the use of these annotations to create implicit links between online resources. We define an implicit link as a relationship between two online resources established by the Web community. An individual may create or reinforce a relationship between two resources by applying a common tag or organizing them in a common folder. This has led to the exploration of techniques for building networks of resources, categories, and people using the social annotations. In order for these techniques to move from the lab to the real world, efficient building and maintenance of these potentially large networks remains a major obstacle. Methods for assembling and indexing these large networks will allow researchers to run more rigorous assessments of their proposed techniques. Toward this goal we explore an approach from the sparse matrix literature and apply it to our system, GiveALink.org. We also investigate distributing the assembly, allowing us to grow the network with the body of resources, annotations, and users. Dividing the network is effective for assembling a global network where the implicit links are dependent on global properties. Additionally, we explore alternative implicit link measures that remove global dependencies and thus allow for the global network to be assembled incrementally, as each participant makes independent contributions. Finally we evaluate three scalable similarity measures, two of which require a revision of the data model underlying our social annotations.
H.1.2 [Models and Principles]: User/Machine Systems— Human information processing; H.3.4 [Information Storage and Retrieval]: Systems and Software—Information networks, Performance evaluation (efficiency and effectiveness); H.5.3 [Information Interfaces and Presentation]: Group and Organization Interfaces—Computer-supported cooperative work, Evaluation/methodology, Web-based interaction
∗Corresponding author. Email:
[email protected]
Permission to make digital or hard copies of all or part of this work for personal or classroom use is granted without fee provided that copies are not made or distributed for profit or commercial advantage and that copies bear this notice and the full citation on the first page. To copy otherwise, to republish, to post on servers or to redistribute to lists, requires prior specific permission and/or a fee. HT’08, June 19-21, 2008, Pittsburgh, Pennsylvania, USA. Copyright 2008 ACM 978-1-59593-985-2/08/06 ...$5.00.
General Terms Performance, Algorithms, Design, Experimentation
Keywords Similarity, Folksonomy, Web 2.0, Annotation, Aggregation, Collaborative Filtering, Tag, Resource
1.
INTRODUCTION
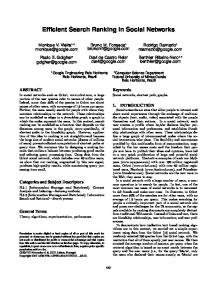
Social bookmarking tools allow Web users to store, share, and organize their Internet resources in a central online location. Many participants of these applications apply keywords or metadata to their Web resources, most commonly tags. Tagging [7] serves two main functions. First, it allows users to arrange their resources as they see fit for recalling in the future – in other words, bookmarking. Second, tagging allows the user to join or participate in a community by sharing personal resources and tags with others. Another way of organizing online resources is through hierarchical organization as in a bookmark manager. These bookmark managers are provided by all mainstream Web browsers. For many Web users, this is still the main mechanism for maintaining a personalized collection of online resources. Browser bookmarking has the added benefit of personal privacy, but requires an extra step for sharing or backing up. Either through tagging or bookmarking, Web users are providing an implicit link between Web resources. Figure 1 illustrates this phenomenon. When applying tags to their resources, users establish a relationship between resources sharing a keyword. When bookmarking, they provide a connection between resources that may be mined from the hierarchical organization. This research focuses on capturing these semantics and representing these relationships in a network. Although it is impossible to know the exact methods employed by current social bookmarking applications for search, it has been speculated that they simply match keywords in
Figure 1: Different kinds of links between Web resources, and examples of applications leveraging such links. The vertical axis represents the cues used to represent pages (text alone in the first generation of search engines, and hyperlinks as well in the current generation). The horizontal axis illustrates the collaborative dimension where traditionally only the authors can determine the content and associations between pages, while in social systems any information consumer may contribute an opinion. the query with the tags applied by users, and rank them in chronological order [10] or by counting the number of tags and usage frequencies [22]. If an effective similarity measure is used to capture the semantics between resources, then these relationships can be used to improve relevance in search results. Additionally, these relationships may provide an alternative way of navigating the Web. Rather than clicking on the links provided by the Web author, one may visit a related page established by the Web community. The construction of a global semantic similarity network will allow a system to go beyond simple keyword or tag matching. Whether one wants to represent relationships between users [5, 17], tags [1], or resources [14, 10, 4], large scale systems will require efficient techniques for building and maintaining these networks. Furthermore, these techniques can be used by researchers and developers to perform a deeper evaluation of proposed algorithms. In our discussion, we will introduce an architecture to build a semantic similarity network from individual profiles. We will describe the implementation and evaluation of building such a system using our online social site, GiveALink.org. This system goes beyond simple tagging and bookmarking by building a semantic similarity network from the donations of individuals’ bookmarks. The main contributions of this work are: • An indexed representation of a semantic similarity network for efficient retrieval in a live system. • A method for assembling a semantic similarity network based on a sparse matrix technique. • An incremental approach for updating a semantic similarity network where modifications to the global ma-
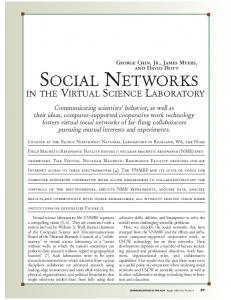
Figure 2: Users may organize their Web resources in a ‘flat’ tag space (left) or in a bookmark hierarchy (right). In both cases, our algorithm computes a similarity value for each pair of resources and for each user. This is then aggregated across all users and stored as a weight in the global semantic similarity network. trix are made efficiently. • An evaluation of different similarity networks grounded against a user tested method. The framework proposed here has been developed and is being deployed in GiveALink to build our resource by resource semantic similarity network. We define this semantic network in § 2, outlining the scalability issues that motivate the present work. § 3 provides a brief description of the previous method used for building such a network. § 4 presents the current framework for building the network with implementation details and timing results. § 5 provides a method we are exploring for assembling and modifying the network incrementally, as users participate in the system. § 6 explores different ways to represent social annotations of resources, and presents scalable similarity measures based on these representations.
2. 2.1
BACKGROUND AND MOTIVATION Semantic Similarity in GiveALink
GiveALink builds a global semantic similarity network to capture relationships among resources. The network is an undirected weighted graph. Nodes in this graph represent the resources, and edge weights the similarities. In the current GiveALink model [14], each user’s set of resources may be thought of as a tree. A typical tag space has a depth of one (not counting the user as a virtual root node), while a traditional hierarchical bookmark file can have an arbitrary number of levels. Figure 2 illustrates GiveALink’s view of the personal organization of the same Web resources by two different users. Both tags and folders are viewed as categories. The similarity computations currently use Lin’s [11] measure to calculate similarity between resources belonging to each user u. Let URL x be in category Fxu , URL y be in category Fyu , and the lowest common ancestor of x and y u be category Fa(x,y) . Also, let the size of any category F , |F | be the number of URLs in that category and all of its
2.2
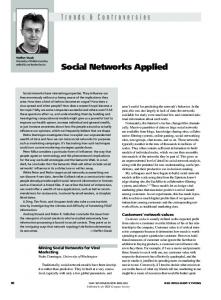
Figure 3: A superuser node is assumed to be the parent of each donated bookmark file (tree) for the purpose of capturing collaborative filtering. We will refer to this construction as the ‘super tree’.
The similarity measure introduced in § 2.1 has one major drawback, Equation 1 relies on |R|. This is a side effect of our technique used to capture collaborative filtering. Consequently, when a new bookmark donation enters the system, the entire semantic similarity network must be recomputed to reflect the change in the size of the super tree. This is also a result of the similarity measure s chosen, but this measure has proven effective in our prior work [14]. This raises the question — Does collaborative filtering warrant the additional complexity of rebuilding the network? Intuitively, we feel that it is important to consider the user’s profile. When a single person bookmarks two otherwise unrelated resources, we believe that there is a relationship between them because the user has an interest in both of them. In practice, this also helps a system alleviate the annotation sparsity problem by establishing relationships that may be ignored otherwise. According to our evaluations in § 5.2, considering the collaborative dimension is a worthwhile endeavor. Therefore it is necessary to devise ways to capture collaborative filtering in a scalable way.
3. subcategories. The size of the root category is |R|. Then the similarity between x and y according to user u is: “ |F u ” a(x,y) | 2 × log |R| su (x, y) = . (1) |Fyu | |Fxu | log |R| + log |R| This function produces similarity values in [0, 1]. If two URLs appear in the same category, their similarity is 1 because Fx = Fy = Fa(x,y) . When the lowest common ancestor of x and y is the root, the similarity is 0. One of the main features of GiveALink is the integration of social bookmarking with collaborative filtering in the similarity measure. Collaborative filtering is the idea that user preference patterns can be used to predict other users’ opinions. To capture collaborative filtering, we wish to compute a minimal yet non-zero value between any two resources bookmarked by a single user. This is achieved by placing each individual bookmark tree under a ‘superuser’ node as illustrated in Figure 3. Lin’s measure in Equation 1 is only appropriate for calculating the similarity of URL pairs according to a single user. To calculate the global similarity between URLs x and y, we sum the similarities reported by each user: s(x, y) =
N 1 X su (x, y). N u=1
(2)
If a user has both URLs x and y, then he reports su (x, y) according to Equation 1, otherwise he reports su (x, y) = 0. If a user has URL x in multiple locations, we calculate su (x, y) for all locations of x and report the highest value. It is important to point out that here N is the total number of users, not just those with su (x, y) 6= 0. Thus the more users share x and y, the higher s(x, y). The final similarity matrix represents a weighted undirected graph where the nodes are URLs and the weight of an edge is the similarity of the two connected URLs.
Algorithm Concerns
DONATION CENTRIC ASSEMBLY
As of January 2008, GiveALink’s collection included 1,883,722 Web resources (links), 520,856 categories, and 4,725 donations to the system. These donations come in the form of browser bookmarks or imports from del.icio.us. Originally, the similarity matrix was built by visiting each donation and accumulated in a separate global representation of the network. This network representation was required to be readily accessible because as each donation is processed, the relationships of resources (edge similarities) affected are unknown a priori. Algorithm 1 illustrates this method of assembling the semantic similarity network where r is a single resource and N the number of resources in the system. Additionally, let d be a single donation, D the set of all donations, and M the global similarity matrix. Algorithm 1 Initial approach to building the GiveALink semantic network N ⇐ number of Web resources Create N ×N Matrix M 2 for each d ∈ D do for each rx ∈ d do for each ry ∈ d do if rx 6= ry then Mx,y ⇐ Mx,y + sd (rx , ry ) end if end for end for end for The primary limitation is the storage of the network while aggregating the similarity values. The space complexity is O(N 2 ). Established tools such as the matrix template library (osl.iu.edu/research/mtl), the market matrix library (math.nist.gov/MatrixMarket/index.html), and the boost graph library (www.boost.org/libs/graph/doc/) were tested, but still suffer from the space complexity. With the emergence of these problems materializing with only 60,000 resources in the collection, alternative methods were developed to build our semantic similarity network.
4.
RESOURCE CENTRIC ASSEMBLY
In order to construct the network without consuming an enormous amount of memory, we draw upon a technique used in sparse matrix computation. Duff [6] introduces the concept of vector register windows for large scale matrix computations. For our purposes, we define each window to be a row in the matrix, representing all incident edges on a particular node. This technique limits linear space complexity to O(N ). At the conclusion of each row, the window is stored and then cleared. This solution represents a cache friendly method for assembling the network. Algorithm 2 details the method for building the GiveALink semantic similarity network. We need to define V to be the Vector Register Window and Dx to be the set of donations containing resource rx . Algorithm 2 Assembling the semantic similarity network using a vector register window for each resource rx do Initialize V to size |V | = N for each d ∈ Dx do for each ry ∈ d do Vy ⇐ Vy + sd (rx , ry ) end for end for Insert V into row x of M end for
4.1
Implementation
The technique of Algorithm 2 was implemented in C++. The hierarchical information captured from user donations was stored in a MySQL database. To optimize the implementation, we cached all the necessary hierarchical information into local Berkeley Databases. To run this implementation, we used Big Red,1 a resource available to the research community at Indiana University. The Big Red cluster consists of 768 nodes in which each node has two dual-core PowerPC 970 MP processors with 8GB of memory. We distributed the Web links among separate processes for two reasons. First, each resource and all of its incident nodes can be created independently of one another. Second, assembling the entire network on one node is impossible due to cluster runtime quotas. As a result, each node was in charge of building part of the graph followed by storing the ‘subgraph’ to an exclusive file unknown to the other processes. Each subgraph may be indexed such that given a Web resource, a list of incident nodes and their corresponding similarities are retrieved. Table 1 illustrates this representation. For our purposes we combined all of the subgraphs into a single text file for uploading to our database. Of course, one may choose not to combine the subgraphs at all.
4.2
Runtime Analysis
The failure to construct the network with one node on BigRed forced us to explore distributing the assembly onto separate processors. As stated earlier, each processor is in charge of building a part of the similarity network. Here we look at the different timings when dividing the work among 1 The Big Red Cluster, rc.uits.iu.edu/hps/research/bigred/index.shtml
x1 x2 x3 ... xN
Table 1: Subgraph Representation x2 s(x1 ,x2 ) x3 s(x1 ,x3 ) ... xN s(x1 ,xN ) x1 s(x2 ,x1 ) x3 s(x2 ,x3 ) ... xN s(x2 ,xN ) x1 s(x3 ,x1 ) x2 s(x3 ,x2 ) ... xN s(x3 ,xN ) ... x1 s(xN ,x1 ) x2 s(xN ,x2 ) ... xN −1 s(xN ,xN −1 )
Table 2: Real Runtimes in Hours Nodes Individual Combine Total 16 63.77 36.04 99.82 16.03 17.97 34.00 32 64 15.96 35.67 51.63 8.30 36.05 44.36 128
Table 3: System Runtimes in Nodes Individual Combine 16 13.78 12.40 32 3.01 5.51 5.74 11.19 64 128 1.48 11.07
Minutes Total 26.18 8.53 16.93 12.56
a varied number of cluster nodes. These numbers reflect a system where each worker in charge of building a subgraph receives exclusive access to the CPU core, but must share the large storage disk with all other users of the cluster. Thus we present the actual time it took to assemble the matrix in hours in Table 2 as well as the system time in minutes in Table 3. The columns are respectively the number of nodes, the maximum time a node took to complete a subgraph, the time to combine the subgraphs, and the sum. This distributed technique allows us to build a large semantic similarity network of about 1.9 million nodes and 18.9 billion edges in under 3 days. Because Big Red is a general use machine these numbers vary with system load, as evident from Tables 2 and 3. It is also important to note that it is completely possible that the nodes do not start the assembly simultaneously. For large systems such as del.icio.us, even the technique discussed in this section may not scale appropriately. (For GiveALink we define scale as successfully assembling the semantic similarity network within one week.) While the space problem is solved, the network assembly algorithm does have runtime complexity O(N 2 ), scaling quadratically with the number of resources. The next two sections discuss a technique where scalability is achieved by assembling/updating the network incrementally.
5.
INCREMENTAL ASSEMBLY
All of the techniques previously presented allow the network to be out of date once a user adds or changes a donation, until the similarities are recomputed. To maintain the similarity network in real time, we need a measure for a user’s contribution to the network that does not depend on global properties. A more agile technique for maintaining a large similarity network will also allow users to witness their contributions to the global network quickly, encouraging active participation. Toward this end let us explore
an incremental approach in which each user’s contribution to the global semantic similarity network may be computed independently.
5.1
Incremental Similarity Measure
The similarity measure introduced in § 2.1 relies on |R|, the size of the super tree. The addition of the superuser makes each user’s own contribution to the network dependent upon every other donation. As a result, each time a donation is added or modified, the entire network must be recomputed. If, however, the values each user contributes are independent of the donations of other users, the network could adapt incrementally to reflect changes as they occur. To define this measure, we need to eliminate two dependencies on global parameters: |R| in Equation 1, and N in Equation 2. With respect to the former, the superuser was originally introduced to make similarity values between any two bookmarks shared by a single user non-zero, thus capturing the notion of collaborative filtering. To preserve the collaborative filtering aspect of the similarity measure while removing the global dependency, we substitute |R| in Equation 1 with the size of the user’s bookmark tree |u| plus a constant, yielding ” “ |F u a(x,y) | 2 × log |u|+δ . (3) su (x, y) = |Fyu | |Fxu | log |u|+δ + log |u|+δ Here δ indicates that the user’s donation is missing information available in other bookmarks. A larger value for the constant will approximate the superuser. A constant equal to 0 means the removal of the collaborative filtering aspect, allowing similarities of 0 even when the user has both resources. The question is how to set δ. The second dependency is easily eliminated by removing the normalization factor N in the aggregation operation of Equation 2: s(x, y) =
N X
su (x, y).
(4)
u=1
We primarily use the similarities for ranking, therefore it is not necessary for the similarity values to be normalized between 0 and 1. Thus, we can store the sum s of the individual similarities, which can easily be updated in real time just for individual contributions from users with updated bookmarks.
5.2
Evaluation
For the purpose of setting δ to an appropriate value in Equation 3, we compare three networks induced by two different values of δ, along with the original measure of § 2.1 as a baseline. We choose to ground our results with a technique defined by Maguitman et al. [13] who extended Lin’s [11] information-theoretic measure to infer similarity from general ontologies. They conducted a user study comparing a proposed graph based similarity measure with Lin’s tree based similarity. The study was based on the data set provided by the human edited Open Directory Project (ODP, dmoz.org). During the study, the user was asked to choose which of two resources appeared more similar to a third. The user study verified that the graph based measure is a better indicator of semantic similarity than the tree based technique.
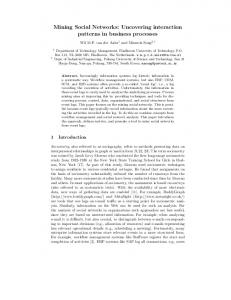
Figure 4: Kendall’s τ between each proposed similarity and Maguitman’s graph based similarity measure. The horizontal axis shows the various proposed similarity measures, while the vertical axis is the Kendall’s τ score. The values reflect correlations of 5 × 10⁸ similarities.
We use Maguitman et al.’s graph based similarity measure to induce a network for grounding our proposed measures. This network is the same data set used in their original user study based on the ODP. We use Equation 3 and set δ = 0 and δ = 106 to create two similarity networks. The value 106 is chosen as an approximation of the missing information from other users’ bookmarks, i.e., the size of the super tree. Additionally, we use the original measure defined in § 2.1 to induce a third network. These networks are then rank correlated with the grounding network using Kendall’s τ . If two rankings perfectly agree, τ = 1. Two rankings that are inverse of each other yield τ = −1. We look at rank correlation because it is natural to sort pairs of resources by their similarities, e.g. “gelato” is more similar to “ice cream” than to “cookie.” To compute Kendall’s τ efficiently we use a technique presented by Boldi et al. [3], which has a runtime complexity of O(N log N ). A network resulting in a higher correlation would suggest that the proposed measure is better at predicting the semantic similarity between resources. For the purposes of the experiment, we created a sample list of 3.2 × 10⁴ resources sorted by strength for use in our evaluations. We define the strength of resource ri as: X κ(ri ) = s(rj , ri ). (5) j
The strength of each resource in the sample list is taken from the original similarity matrix defined in § 2.1. Furthermore, the resource must have a corresponding node in our grounding network. Considering two weighted edges (similarities) from the proposed network, the corresponding edges are taken from the grounded network. If the order of the similarities for the edges agree, Kendall’s τ increases, and if they disagree, τ decreases. Figure 4 illustrates our findings. The results show that taking collaborative filtering into account provides a better indicator of semantic similarity, and that it is worth capturing. Additionally, the incremental similarity measure with
user u. For defining our proposed similarity measures, x represents a resource and X the tags associated with it. For example, X1u is the set of tags assigned by user u to resource x1 . First, we define a cosine similarity measure. Cosine similarity is computed locally for user u as |X1u ∩ X2u | . scos u (x1 , x2 ) = p |X1u | · |X2u |
(7)
If collaborative filtering is taken into account, an additional common tag is applied to each resource. For both cases, with and without collaborative filtering, the cosine similarity ignores the probabilities, thereby not depending on δ. Second, let us define a mutual information measure as Figure 5: On the left is an illustration of how GiveALink represents a user’s profile internally. The result of transforming this original representation into triples is on the right.
smi u (x1 , x2 ) =
TRIPLE SIMILARITY
So far, GiveALink’s approach to measuring similarity is based on a shallow hierarchy in the case of tagging systems, and in the case of browser bookmarks a structure with potentially many levels. However, many of the popular social bookmarking tools depend on a triple representation of the underlying data, also known as a folksonomy [15]. Each triple (u, t, r) represents a user u, a tag t, and a resource r. In this section, we explore measuring similarity between resources based on a triple representation of GiveALink’s corpus. For efficiency reasons, we define and evaluate similarity measures based on the incremental assembly discussed in § 5. To project GiveALink’s data into triples, we derive each triple from a user, a resource, and an annotation of that resource. Each ancestor folder or tag is considered an annotation of that resource. Figure 5 illustrates this conversion.
6.1
Similarity Measures
We now describe two established techniques from information retrieval in addition to a modified version of Equation 3 to handle the triple representation. The two measures were selected based on a preliminary study over the BibSonomy.org corpus. We consider variations of the measures with and without collaborative filtering. When collaborative filtering is not taken into account, the user profile remains unchanged during the similarity computation. When collaborative filtering is taken into account, we alter a user’s profile by adding a common tag to each resource. Furthermore, during the similarity computation, we add a constant δ to the size of a user’s profile, to account for missing information from other users as described earlier. For example, the probability of tag t for user u becomes p(t|u) =
|T (u, t)| |T (u)| + δ
(6)
where T (u, t) is the set of resources annotated with tag t by user u, while T (u) is the set of resources annotated by
X
p(t1 , t2 |u) log
t1 ∈X1u t2 ∈X2u
p(t1 , t2 |u) (8) p(t1 |u)p(t2 |u)
where p(t1 , t2 |u) is the joint probability of t1 and t2 . We define the joint probability between tag t1 and t2 as
δ = 106 seems to perform as well as the original, non-scalable measure.
6.
X
p(t1 , t2 |u) =
|T (u, t1 ) ∩ T (u, t2 )| |T (u)| + δ
(9)
where, if one recalls from Equation 6, T (u, t) is the set of resources tagged with t by u. When δ = 0 and no common tag is added to a user’s resources, collaborative filtering is absent. Finally let us extend the incremental version of Lin’s measure (Equation 3) to the non-hierarchical triple representation. Using the notation defined previously, we generalize Lin’s similarity as 2 log(mint∈X1u ∩X2u [p(t|u)]) . log(mint∈X1u [p(t|u)]) + log(mint∈X2u [p(t|u)]) (10) This generalization is equivalent to Equation 3 when the underlying structure is a hierarchy or the set of triples is a straight projection of a hierarchy as we have done here (cf. Figure 5). For typical social bookmarking systems, the behavior of this measure is unclear since Lin is designed for a hierarchy, assuming that each tag is subsumed by its parent. Each of the tree measures defined above gives a set of similarity values across the users. These are then aggregated according to Equation 4. slin u (x1 , x2 ) =
6.2
Evaluation
Analogously to § 5.2, we evaluate the measures relying on Maguitman et al.’s graph similarity induced from the ODP using Kendall’s τ . For building the networks based on the proposed similarity measures, we sort the Web resources by strength κ taking the top 2 × 10⁴ links. We also ensure that the resources considered are indexed by both GiveALink and the ODP. Finally, only users with fewer than 103 resources are considered because of the complexity of mutual information — O(N 2 T 2 ), where N is the number of resources and T the number of annotations or tags. This limitation means that some users with relevant information are not included in any of these similarity calculations. Bounding the number of links per user to 103 sets the number of profiles under consideration to 518 users, with a total of 134, 784 tags and 1, 578, 668 resources. Again, a higher value of Kendall’s τ indicates stronger agreement between the tested similarity measure on the
Figure 6: Kendall’s τ between each triple-based similarity measure and Maguitman’s graph-based similarity measure. The horizontal axis shows the various proposed similarity measures for varying values of δ. The vertical axis is the Kendall’s τ score. Cosine similarity has only two bars as it disregards δ. GiveALink data and the grounding similarity network in terms of the ranking of the edges by similarity, thus a better similarity measure. The evaluation considers similarity measures with various values of the parameter δ corresponding to different weights of the collaborative filtering component. For mutual information and Lin, the techniques based on probabilities (cf. Equations 8 and 10), we experimented with setting δ = 0 for no collaborative filtering and δ = 100 , δ = 103 , and δ = 106 for the missing information in other users’ annotations. Figure 6 shows our findings. Collaborative filtering improves all similarity measures, especially for the generalized Lin similarity. In spite of mutual information’s computational complexity, it does not appear to improve the results over Lin or cosine similarity with collaborative filtering. The collaborative versions of the measures perform similarly, except that as δ increases mutual information performs better. Cosine similarity performs surprisingly well for its simplicity compared to the other measures.
7. 7.1
RELATED WORK Semantic Similarity
Semantic similarity between Web sites refers to the degree of relatedness between them as perceived by human subjects. Search engine designers and researchers have made numerous attempts to automate the calculation of semantic similarity between Web pages through measures based on observable features, like content and hyperlinks. Studies conducted by Maguitman et al. [13] and Menczer [16] report, quite surprisingly, that measures relying heavily on content similarity (e.g. common words) are poor predictors of semantic similarity. On the other hand, measures that only take into consideration link similarity (common forward and backward edges), or scale content similarity by link similarity, estimate semantic similarity with greater accuracy.
7.2
Social Similarity
Social bookmarking is a way to manage bookmarks online, for easy access from multiple locations, and also to
share them among an interest community. A number of social bookmarking tools are reviewed by Hammond et al. [8, 12]. Such tools have facilitated the discovery of relationships between resources that might otherwise be unknown and difficult to infer. Measuring the relationships between Web sites using social annotations is an active research area. Cattuto et al. [4] use a variation of set overlap in the spirit of TF-IDF in order to build an adjacency matrix of Web resources. Wu et al. [22] explore a modified HITS technique to look for implicit links between Web resources. Hotho et al. [10] rank query results by applying a modified PageRank algorithm on an undirected tri-partite network. These techniques depend on global frequencies and their evaluations, based on relatively small corpora, have largely ignored the efficiency and scalability issues addressed in this paper. Although the present discussion has focused on computing similarities between resources, there is ongoing research in establishing relationships among tags [1, 9] and users [5, 17].
7.3
Collaborative Filtering
One of the main features of GiveALink is the integration of social bookmarking with collaborative filtering in our similarity measure. Collaborative filtering uses patterns in user preferences to make recommendations based on like users’ opinions: individuals who have shared tastes in the past will continue to do so. Examples include Ringo [20] and GroupLens [18] as well as e-commerce sites such as Amazon [21] and Netflix [2] that make personalized product recommendations. Despite the success and popularity of collaborative filtering, these techniques suffer from some well-known limitations [19]: the sparsity of user profiles, the difficulty in generating predictions about new items, and the latency associated with pre-computing similarity information. This latter issue is the one addressed in this paper: when a user submits a new profile, the data is not integrated into the system until the similarity scores are recomputed.
8.
CONCLUSION
Current research on social similarity mining has the potential to improve online search and recommendation systems. To move the similarity measures proposed in the literature to full scale systems, and to make their analyses more significant, efficient techniques must be developed for assembling and indexing these networks. In our discussion, we presented an architecture for combining individual profiles to build a large scale semantic similarity network containing almost 2 million nodes and 19 billion edges. The straightforward implementation of visiting each donation has the limitation of requiring a representation of the entire network throughout the assembly phase. This limitation led us to a resource centric approach using a vector register window introduced in the sparse matrix literature. Further optimizations were made by distributing the network building process. We looked at varying the number of nodes to distribute the assembly process, but the numbers we selected were arbitrary. One may simply set the number of nodes to be a ratio of the number of resources over a constant for automation. When a user shares a new annotation or modifies a bookmark, the similarities becomes outdated until the entire network is recomputed. To decrease the turnaround time for
updating the network, we presented several incremental approaches. We explored a set of similarity measures not dependent on global quantities. We evaluate the incremental approaches by running correlations between our proposed measures and a user verified method for computing semantic similarity. Our results show that capturing collaborative filtering provides a useful signal for defining similarities. The robustness of our results is still an issue. Also, the values of the δ parameter were arbitrarily selected for our experiment. To test different values of δ, we plan to rerun the experiment several times randomly selecting the edges for each iteration. From these results we can create confidence intervals and reach a deeper understanding of the proposed measure. As the number of resources grows, δ may need to be adjusted. A long-term social bookmarking system will require a combination of batch processing at regular intervals to adjust δ followed by continous incremental updates.
Acknowledgments Thanks to Mark Meiss for his implementation of Kendall’s τ , Ciro Cattuto for technical assistance, and the administrators of Indiana University’s Big Red cluster for their suggestions. This work was largely done at the Institute for Scientific Interchange Foundation (ISI) in Turin, Italy. We acknowledge generous support from the ISI and CRT Foundations. We also would like to extend a thank you to the TAGora project funded by the Future and Emerging Technologies program of the European Commission (IST-FET FP6-IST5-34721) for use of their servers.
9.
REFERENCES
[1] G. Begelman, P. Keller, and F. Smadja. Automated tag clustering: Improving search and exploration in the tag space. In Collaborative Web Tagging Workshop at WWW2006, Edinburgh, Scotland, 2006. [2] R. M. Bell and Y. Koren. Lessons from the Netflix prize challenge. SIGKDD Explor. Newsl., 9(2):75–79, 2007. [3] P. Boldi, M. Santini, and S. Vigna. Do your worst to make the best: Paradoxical effects in pagerank incremental computations. In S. Leonardi, editor, WAW, volume 3243 of Lecture Notes in Computer Science, pages 168–180. Springer, 2004. [4] C. Cattuto, A. Baldassarri, V. D. P. Servedio, and V. Loreto. Emergent community structure in social tagging systems. In Proceedings of the European Confeence on Complex Systems ECCS2007, Dresden, Germany, October 2007. [5] J. Diederich and T. Iofciu. Finding communities of practice from user profiles based on folksonomies. Proceedings of the 1st International Workshop on Building Technology Enhanced Learning solutions for Communities of Practice, 2006. [6] I. Duff, A. M. Erisman, and J. K. Reid. Direct Methods for Sparse Matrices. Oxford University Press, 1989. [7] G. W. Furnas, C. Fake, L. von Ahn, J. Schachter, S. Golder, K. Fox, M. Davis, C. Marlow, and M. Naaman. Why do tagging systems work? In CHI ’06: CHI ’06 extended abstracts on Human factors in computing systems, pages 36–39, New York, NY, USA, 2006. ACM Press.
[8] T. Hammond, T. Hannay, B. Lund, and J. Scott. Social Bookmarking Tools (I): A General Review. D-Lib Magazine, 11(4), 2005. [9] Y. Hassan-Montero and V. Herrero-Solana. Improving tag-clouds as visual information retrieval interfaces. In International Conference on Multidisciplinary Information Sciences and Technologies, 2006. [10] A. Hotho, R. J¨ aschke, C. Schmitz, and G. Stumme. Information retrieval in folksonomies: Search and ranking. In Y. Sure and J. Domingue, editors, The Semantic Web: Research and Applications, volume 4011, pages 411–426, 2006. [11] D. Lin. An information-theoretic definition of similarity. In Proc. 15th Intl. Conf. on Machine Learning, pages 296–304. Morgan Kaufmann, 1998. [12] B. Lund, T. Hammond, M. Flack, and T. Hannay. Social Bookmarking Tools (II): A Case Study Connotea. D-Lib Magazine, 11(4), 2005. [13] A. Maguitman, F. Menczer, H. Roinestad, and A. Vespignani. Algorithmic Detection of Semantic Similarity. In Proc. WWW2005, 2005. [14] B. Markines, L. Stoilova, and F. Menczer. Social bookmarks for collaborative search and recommendation. In Proc. AAAI 2006, 2006. [15] A. Mathes. Folksonomies - cooperative classification and communication through shared metadata. [16] F. Menczer. Mapping the semantics of Web text and links. In IEEE Internet Computing, volume 9(3), pages 18–27, May/June 2005. [17] P. Mika. Ontologies are us: A unified model of social networks and semantics. In Y. Gil, E. Motta, V. R. Benjamins, and M. A. Musen, editors, The Semantic Web - ISWC 2005, Proceedings of the 4th International Semantic Web Conference, ISWC 2005, Galway, Ireland, November 6-10, volume 3729 of Lecture Notes in Computer Science, pages 522–536, Heidelberg, 2005. Springer. [18] P. Resnick, N. Iacovou, M. Suchak, P. Bergstorm, and J. Riedl. GroupLens: An Open Architecture for Collaborative Filtering of Netnews. In Proc. ACM 1994 Conf. on Computer Supported Cooperative Work, pages 175–186. ACM, 1994. [19] B. M. Sarwar, G. Karypis, J. Konstan, and J. Riedl. Analysis of recommender algorithms for e-commerce. In Proc. 2nd ACM E-Commerce Conf. (EC’00), 2000. [20] U. Shardanand and P. Maes. Social Information Filtering: Algorithms for Automating “Word of Mouth”. In Proc. ACM CHI’95 Conf. on Human Factors in Computing Systems, pages 210–217, 1995. [21] B. Smith, G. Linden, and J. York. Amazon.com recommendations: item-to-item collaborative filtering. In Internet Computing, IEEE, 2003. [22] H. Wu, M. Zubair, and K. Maly. Harvesting social knowledge from folksonomies. In HYPERTEXT ’06: Proceedings of the seventeenth conference on Hypertext and hypermedia, pages 111–114, New York, NY, USA, 2006. ACM Press.