sensors Article
Efficient Banknote Recognition Based on Selection of Discriminative Regions with One-Dimensional Visible-Light Line Sensor Tuyen Danh Pham 1 , Young Ho Park 1 , Seung Yong Kwon 1 , Kang Ryoung Park 1, *, Dae Sik Jeong 1 and Sungsoo Yoon 2 1
2
*
Division of Electronics and Electrical Engineering, Dongguk University, 30 Pildong-ro 1-gil, Jung-gu, Seoul 100-715, Korea;
[email protected] (T.D.P.);
[email protected] (Y.H.P.);
[email protected] (S.Y.K.);
[email protected] (D.S.J.) Kisan Electronics, Sungsoo 2-ga 3-dong, Sungdong-gu, Seoul 133-831, Korea;
[email protected] Correspondence:
[email protected]; Tel.: +82-10-3111-7022; Fax: +82-2-2277-8735
Academic Editor: Vittorio M. N. Passaro Received: 11 January 2016; Accepted: 22 February 2016; Published: 4 March 2016
Abstract: Banknote papers are automatically recognized and classified in various machines, such as vending machines, automatic teller machines (ATM), and banknote-counting machines. Previous studies on automatic classification of banknotes have been based on the optical characteristics of banknote papers. On each banknote image, there are regions more distinguishable than others in terms of banknote types, sides, and directions. However, there has been little previous research on banknote recognition that has addressed the selection of distinguishable areas. To overcome this problem, we propose a method for recognizing banknotes by selecting more discriminative regions based on similarity mapping, using images captured by a one-dimensional visible light line sensor. Experimental results with various types of banknote databases show that our proposed method outperforms previous methods. Keywords: banknote recognition; selection of distinguishable areas; one-dimensional visible-light line sensor; various types of banknote databases
1. Introduction The accurate and reliable recognition of banknotes plays an important role in the growing popularity of payment facilities such as ATMs and currency-counting machines. There have been many studies on this classification functionality that have been based on the optical characteristics of banknotes. Most studies on classification of banknotes by denomination (e.g., $1, $5, $10, etc.) have been based on images of banknotes captured by visible-light sensors. In general, a banknote can appear in four directions on two sides, i.e., the forward and reverse images of the front and back sides, and the captured images of these input directions are used in recognition of banknotes. Previous studies using visible-light images of banknotes can be divided into those that used whole banknote images for recognition [1–6] and those that used certain regions of banknote images [7–12]. Wu et al. [1] proposed a banknote orientation recognition method that uses the average brightness of eight uniform rectangles on a banknote image as the input of the classifier using a three-layer back-propagation (BP) network. However, their experiments only focused on orientation recognition of one type of Chinese banknote—the Renminbi (RMB) 100 Yuan note. A Chinese banknote recognition method using a three-layer neural network (NN) was proposed by Zhang et al. [2]. This method uses linear transforms of gray images to reduce the effect of noise and uses the edge characteristics of the transformed image as the input vectors to the NN classifier. This method was applied to Sri Lankan banknote recognition in [3]. A BP network was used as the classifier in research by Gai et al. [4]. In this Sensors 2016, 16, 328; doi:10.3390/s16030328
www.mdpi.com/journal/sensors
Sensors 2016, 16, 328
2 of 18
research, recognition features were extracted by applying generalized Gaussian density (GGD) to the capture of the statistical characteristics of quaternion wavelet transform (QWT) coefficients on banknote images. To recognize multiple banknotes, Hassanpour and Farahabadi considered the texture characteristics of paper currencies as a random process and used hidden Markov model (HMM) for classification [6]. The Indian banknote recognition method proposed by Sharma et al. [5] uses a local binary pattern (LBP) operator to extract features from banknote images and classifies banknote types using Euclidean distances with template images. In studies concerning regions of banknotes, not all the image data that a banknote provides have been used for recognition; only certain areas on banknote images have been selected and used. This helps to reduce the amount of input data required and puts the focus on regions of banknotes that have high degrees of discrimination. A Bangladeshi banknote recognition system was proposed using axis symmetric masks to select regions of banknote images before feeding information into a multilayer perceptron network to reduce the network size and adapt it to banknote flipping [7]. Axis-symmetrical masks were also applied to the neuro-recognition system proposed by Takeda and Nishikage [8] for analysis of Euro currency using two image sensors. Takeda et al. also proposed a mask optimization technique using a genetic algorithm (GA) [10] that could be used to select good masks using the sum of the pixels uncovered by masks, called the slab value [9], as the input to the recognition neural network. Component-based banknote recognition with speeded-up robust features (SURF) was proposed by Hasanuzzaman et al. [11]. In this method, components that provide specific information about banknotes, such as denomination numbers, portraits, and building textures, are cropped and considered to be reference regions. In the multi-currency classification method proposed by Youn et al. [12], multi-template correlation matching is used to determine the discriminant areas of each banknote that are highly correlated among banknotes of the same types and poorly correlated among those of different types. Another approach to extracting classification features involves using statistical procedures such as principal component analysis (PCA) [13–16] or canonical analysis (CA) [17] to reduce the size of the feature vector. In research using learning vector quantization (LVQ) as the classifier, input feature vectors have been extracted by PCA from banknote data acquired by various type of sensors, such as sensors of various wavelengths [13], or point and line sensors [14]. The banknote recognition method proposed by Rong et al. [15] for a rail transit automatic fare collection system employs PCA to extract features and build matching templates from banknote data acquired by various sensors, such as magnetic, ultraviolet (UV) fluorescence and infrared (IR) sensors. In the hierarchical recognition method proposed by Park et al. [16], United States dollar (USD) banknotes were classified by front or back size and their forward or backward directions using a support vector machine (SVM) and then recognized by denomination ($1, $2, $5, etc.) using a K-mean algorithm based on the PCA features extracted from sub-sampled banknote images. In research by Choi et al. [17], CA was used for size reduction and to increase the discriminating power of features extracted from Korean won images using wavelet transform. There have also been studies combining both of the above feature extraction approaches. The Indian currency recognition method proposed by Vishnu and Omman [18] selects five regions of interest (ROI): the textures of center numerals, shapes, Reserve Bank of India (RBI) seals, latent images, and micro letters on scanned banknote images. PCA is subsequently used for dimensionality reduction of the extracted features. Finally, the recognition results are validated using a classifier implemented with WEKA software [18]. Texture-based analysis is also used in the Indian banknote recognition method proposed by Verma et al. [19]. In this method, linear discriminant analysis (LDA) is applied to ROIs containing textures on banknote images for feature reduction, and SVM is applied for classification. Here, the ROI selection is conducted with the help of a set of external tools called Mazda. In the smartphone-based US banknote recognition system proposed by Grijalva et al. [20], regions of interest are located in the right parts of banknote images. From these regions, weight vectors are extracted using PCA and are compared with those of a training set using the Mahalanobis distance to
Sensors 2016, 16, 328
3 of 18
determine the denomination of an input banknote. Although ROIs were defined in [20], it is uncertain whether the selected areas on banknote images are indeed those with highest discriminating power for recognition purposes. To overcome these limitations, we propose a banknote recognition method that uses a combination of both of the feature extraction approaches mentioned above. From the sub-sampled banknote images, we select areas that have high degrees of similarity from among banknotes in the same class and high degrees of difference among those in different classes. The discriminant features are then extracted from the selected data using PCA, and the banknote type is determined by the classifier based on K-means algorithm. Our method is novel in the following respects: (1)
(2) (3)
(4)
Using the sub-sampled banknote region from the captured image, the local areas that have high discriminating power are selected using a similarity map. This map is obtained based on the ratio of correlation map values, considering between-class and in-class dissimilarities among banknote images. Optimally reduced features for recognition are obtained from the selected local areas based on PCA, which reduces both the noise components and the processing time. The performance of our method has been measured using both normal circulated banknotes and test notes, and the effectiveness of our method has been confirmed in the harsh testing environment of banknote recognition. Through experiments with various types of banknotes—US dollars (USD), South African rand (ZAR), Angolan kwanza (AOA) and Malawian kwacha (MWK)—we have confirmed that our method can be applied irrespective of the type of banknote.
Table 1 presents a comparison between our research and previous studies. The remainder of this paper is organized as follows: Section 2 presents the details of the proposed banknote recognition method. Experimental results are presented in Section 3, and conclusions drawn from the results are presented in Section 4. Table 1. Comparison of proposed and previous methods. Category
Method 1.
2. Using the whole banknote image
3. 4.
1.
2. Using local regions on banknote image
3.
4.
Using average brightness values of eight uniform rectangles on banknote images as the input for BP network [1]. Edge characteristic of linear transformed banknote image was used as the input for three layer NN classifier [2,3]. Using HMM to model textures of banknote as a random process [6]. Using GGD to extract statistical features from QWT coefficients [4].
Using symmetric masks on banknote images to select input features for the NN classifiers [7,8]. Optimizing masks for selecting features using GA algorithm [10]. Using SURF based on class-specific components of textures on banknote images [11]. Determination of discriminant areas on banknotes by multi-template correlation matching [12].
Strength
Weakness 1.
1. 2.
Simple in feature extraction method [1]. Make use of all of the available recognition features on banknote image.
2.
3.
1. 1.
2.
Help to reduce the size of input data to the classifier and reduce processing time. High-discriminating-power regions on banknote images could be located [10–12].
2.
Only focused on orientation recognition of a banknote type—Renminbi (RMB) 100 Yuan [1]. Possibility of redundancy in the input data to the classifiers. Need for additional feature extraction or representation method because of large-size images could reduce classification speed (HMM [6], QWT [4]).
Fixed recognition regions on banknote images were not the optimal discriminative areas [7,8]. Difficulty in application of embedded systems with limited resources due to usage of complex features (SURF [11]).
Sensors 2016, 16, 328
4 of 18
Table 1. Cont. Sensors 2016, 16, 328 Category 1.
Category
Using statistical analysis to extract features Using from statistical banknote analysis to image
2. 1.
3.2.
extract 3. features from banknote 4. image
1.4.
1.
Combining 2. two feature extraction Combining methods: 2. two feature local region extraction 3. methods: definition local region and definition and 3. statistical statistical analysis analysis 4. 4.
4 of 18
Method Strength Using PCA on data acquired by Table 1. Cont. various sensors and LVQ for classification [13,14]. Applying PCA for feature 1. Help Strength to reduce the size Method extraction from banknote data of input data to the Using PCA data acquired by acquired by on various sensors: IR, classifier. various sensors and LVQ for UV, magnetic, fluorescence [15]. 2. Can be applied to classification [13,14]. Using PCA for feature feature extraction from Applying PCA for feature 1. Help reduce the extraction, SVMbanknote for datatoacquired bysize of extraction from data input data to the classifier. acquired by variousand sensors: IR, pre-classification, K-means multiple sensors 2. Can be applied to feature UV,denomination magnetic, fluorescence [15]. for recognition [13–15]. from data extraction Using PCA for feature extraction, [16]. acquired by multiple SVM for pre-classification, and sensors [13–15]. Using CA on features extracted K-means for denomination by wavelet transform [17]. recognition [16]. ROIs selected five by Usingwere CA on featuresfrom extracted wavelet transform [17]. security features on Indian banknote image. PCA was used for dimensionality reduction ROIs were selected from five of data extracted from ROI [18]. security features on Indian banknote image. PCA was used Using LDA for feature for dimensionality of reduction on ROIsreduction containing Input feature to the data extracted from ROI [18]. textures cropped from Indian classifiers was reduced in Using LDA for feature reduction banknote image [19]. on ROIs containing textures dimensionality and Using PCA forIndian feature Input feature to the classifiers was cropped from banknote optimized by statistical reduced in dimensionality and extraction image [19].from the region on analysis. by statistical analysis. optimized Using PCA for feature extraction the right part of detected from the region the right part banknote imageon [20]. of detected banknote image [20]. Using feature extraction Using feature extraction method method onbanknote PCA on areas based onbased PCA on banknote areas selected selected by similarity mapby (proposedmap method). similarity (proposed method).
Weakness
Weakness
Additional processing time and resources required for feature extraction by statistical analysis (memory for PCA eigenvector Additional processing time and data). resources required for feature extraction by statistical analysis (memory for PCA eigenvector data).
1. 1.
2. 2.
3. 3.
4.
4.
Using large-size scanned color banknote images that are difficult to apply scanned on Using large-size color banknote images embedded systems [18].that are difficult to had apply ROI selection toon be embedded systems [18]. conducted with the help of ROI selection had to be external tool (Mazda [19]). conducted with the help of The selected region for external tool (Mazda [19]). recognition the right The selectedon region for part recognition the right part of banknoteon image is not of banknote image is not definitely optimal [20]. definitely optimal [20]. Calculation of similarity map Calculation of similarity ismap necessary (proposed is necessary method). (proposed method).
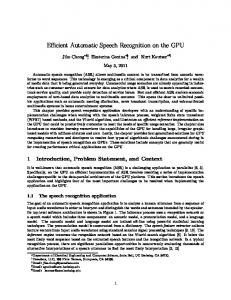
2. Proposed ProposedMethods Methods 2.1. Overview Overview of of the the Proposed Proposed System System 2.1. Figure 11 is The pre-processing step Figure is an an overview overview of of the the proposed proposed banknote banknote recognition recognition system. system. The pre-processing step for acquired banknote images is as follows. A banknote region is segmented from the input image for acquired banknote images is as follows. A banknote region is segmented from the input image and sub-sampled sub-sampled to 12pixels pixels to to reduce reduce the the processing processing time. time. In In the the second second step, step, from from the the and to aa size size of of 64 64 ˆ × 12 sub-sampled banknote image, the recognition region with the high discriminating power is selected sub-sampled banknote image, the recognition region with the high discriminating power is selected using aa similarity optimally reduced feature vector is extracted fromfrom the data using similaritymap. map.Consequently, Consequently,the the optimally reduced feature vector is extracted the selected with with the similarity map using PCA.PCA. Finally, the banknote type and direction of the of input data selected the similarity map using Finally, the banknote typethe and the direction the image are determined using a K-means algorithm based on the PCA features. input image are determined using a K-means algorithm based on the PCA features.
Figure 1. Flowchart of proposed method. Figure 1. Flowchart of proposed method.
Sensors 2016, 16, 328
5 of 18
2.2. Acquisition of16,Banknote Image, Region Segmentation and Normalization Sensors 2016, 328
5 of 18
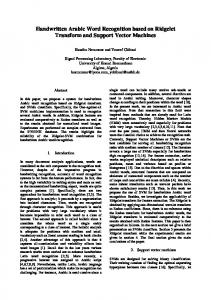
In 2.2. thisAcquisition study, weofused a commercial machine [21]. Figure 2 shows the set-up Banknote Image, Regionbanknote-counting Segmentation and Normalization Sensors 2016,As 16, 328 5 of 18 of our research. shown in Figure 2a, if we input the banknotes into the banknote-counting machine, In this study, we used a commercial banknote-counting machine [21]. Figure 2 shows the the image data of each banknote can be automatically acquired as shown in Figure 2b. Because of the 2.2. Acquisition of Banknote Image, Region Segmentation and Normalization set-up of our research. As shown in Figure 2a, if we input the banknotes into the banknote-counting limitations of the size and cost of the counting machine, a conventional two-dimensional (area) machine, the image data of each banknote can be automatically acquired as shown in Figure 2b. image In this study, we used a commercial banknote-counting machine [21]. Figure 2 shows the sensor is not used. One line image is captured at each trigger time as the input banknote is Because of the limitations of the size and cost of the counting machine, a conventionalmoving set-up of our research. As shown in Figure 2a, if we input the banknotes into the banknote-counting (area) imagethe sensor is not used. One line captured atis each trigger time as throughtwo-dimensional the roller inside machine at aimage highisspeed and being by a machine, thedevice image data of eachcounting banknote can be automatically acquired as shown in illuminated Figure 2b. the input banknote is moving through the roller device inside the counting machine at a high speed light-emitting The line sensor 1584 pixels and isatriggered to capture Becausediode of the(LED). limitations of the sizehas anda resolution cost of theofcounting machine, conventional and is being illuminated by a light-emitting diode (LED). The line sensor has a resolution of 1584 image sensor is not used. is captured at each trigger time as light is 464 linetwo-dimensional images for each(area) moving input banknote. AOne 1584line ˆ image 464 pixel banknote image of visible pixels and is triggered to capture 464 line images for each moving input banknote. A 1584 × 464 the input banknote is moving through the roller device inside the counting machine at a high speed acquired by banknote concatenating the line light images. pixel image of visible is acquired by concatenating the line images. and is being illuminated by a light-emitting diode (LED). The line sensor has a resolution of 1584 pixels and is triggered to capture 464 line images for each moving input banknote. A 1584 × 464 pixel banknote image of visible light is acquired by concatenating the line images.
(a)
(b)
Figure 2. Examples of the set-up of our research: (a) Input banknotes. (b) Acquisition of image data.
Figure 2. Examples of the set-up of our research: (a) Input banknotes. (b) Acquisition of image data.
(a) (b) When entering the recognition system, a banknote can be exposed in one of the following four Figure 2. Examples of the set-up of our research: (a) Input banknotes. (b) Acquisition of image data. directions: the front in the forward direction (the “A direction”) or backward (the following “B When entering the side recognition system, a banknote can be exposed in direction one of the direction”), the back side in the forward direction (the “C direction”) or backward direction (the “D four directions: fronttheside in the forward directioncan (the “A direction”) or backward direction Whenthe entering recognition system, a banknote be exposed in one of the following four direction”). In this study, we classified banknotes in terms of type (e.g., $1, $5, $10) and direction. directions: the front side in the forward direction (the “A direction”) or backward direction (the “B (the “B direction”), the back side in the forward direction (the “C direction”) or backward direction Therefore, there are four classes corresponding to four directions for each type of banknote. To direction”), the in the direction (the “C direction”) or backward (the “D (the “D address direction”). Inback this side study, weforward classified banknotes inbanknote terms ofarea type $1,direction $5, $10) and direction. the problems of displacement and rotation of the in(e.g., the captured image [16], direction”). In this study, we classified banknotes in terms of type (e.g., $1, $5, $10) and direction. Therefore, arecommercial four classes corresponding to fourbuilt directions each type of banknote. we there use the corner detection algorithm into thefor counting machine to locate To theaddress Therefore, there are four classes corresponding to four directions for each type of banknote. To banknote area and exclude therotation background area from the area captured banknote image, as shown in the problems of displacement and of the banknote in the captured image [16], we address the problems of displacement and rotation of the banknote area in the captured image [16], use the Figure 3. Thedetection segmentedalgorithm banknote images are the thencounting sub-sampled to have the samethe size of 64 × 12area and commercial corner built into machine to locate banknote we use the commercial corner detection algorithm built into the counting machine to locate the to reduce the effect of noise and redundant data and to increase the processing speed. banknote area and area exclude thethe background from the captured banknote in excludepixels the background from capturedarea banknote image, as shown in image, Figureas3. shown The segmented Examples of original banknote images, corresponding banknote area segmented images, and Figure 3. The segmented banknote images arethe thensame sub-sampled to ˆ have the sametosize of 64the × 12effect of banknote images are then sub-sampled to have size of 64 12 pixels reduce sub-sampled images are shown in Figure 3. pixels to reduce the effect of noise and redundant data and to increase the processing speed. noise and redundant data and to increase the processing speed. Examples of original banknote images, Examples of original banknote images, corresponding banknote area segmented images, and corresponding banknote area segmented images, and sub-sampled images are shown in Figure 3. sub-sampled images are shown in Figure 3.
(a)
(b)
(a)
(b)
(c)
(d)
(c)
(d)
(e)
(f)
(e)
(f)
Figure 3. Cont.
Sensors 2016, 16, 328
6 of 18
Sensors 2016, 16, 328
6 of 18
(g)
(h)
(i)
(j)
(k)
(l)
Figure 3. Examples of input images for four banknote directions: (a) A direction; (b) B direction; (c) C
Figure 3. Examples of input images for four banknote directions: (a) A direction; (b) B direction; direction; (d) D direction; (e–h) Corresponding banknote areas segmented from the images in (a–d), (c) C direction; (d)(i–l) D direction; (e–h) banknote areas segmented from the images respectively; Corresponding 64 ×Corresponding 12-pixel sub-sampled images of the banknote area segmented in (a–d),images respectively; (i–l) Corresponding 64 ˆ 12-pixel sub-sampled images of the banknote area in (e–h), respectively. segmented images in (e–h), respectively. 2.3. Similarity Map
2.3. Similarity In Map a sub-sampled banknote image, there are areas that are mostly similar regardless of the banknote type and areas that are more distinguishable among different types of banknotes. To
In properly a sub-sampled image, there arefor areas that are mostly similar select the banknote highly discriminative regions recognition of banknote type, weregardless propose a of the banknote type and that are more amongamong different types of banknotes. To properly method basedareas on the calculation of distinguishable the ratio of the similarity sub-sampled banknote images in highly the different classes and regions in the same This method results intype, a 64 we × 12-pixel binary mask based select the discriminative for class. recognition of banknote propose a method called a similarity thatofcan obtained from a training data set using the following procedure. on the calculation of themap ratio thebesimilarity among sub-sampled banknote images in the different First, we generate a reference banknote image for each class by averaging all the banknote classes and in the same class. This method results in a 64 ˆ 12-pixel binary mask called a similarity images belonging to the same class. An example of a reference image of a recent US $100 banknote map that can be obtained from a training data set using the following procedure. in the front-forward direction is shown in Figure 4a. Based on the reference images generated, we First, we generate a reference banknote image for each bytoaveraging the banknote calculate the correlation maps for each input banknote withclass respect the class toall which it belongs images belonging totraining the same class.theAn example of a reference image of a recent US $100 banknote in the in the set using following formulas: front-forward direction is shown in Figure calculate (i , j )reference images generated, we M (i4a. , j ) Based I (i , j )on Rthe (1) the correlation maps for each input banknote with respect to the class to which it belongs in the training with set using the following formulas: I (i, j ) I ˇ I (i, j ˇ) 1 ˇ Mpi, jq “ ˇ I 1 pi, jq´ I R pi, jq
with
R (i, j )
R (i, j ) R
(2)
(3)
Ipi,jqR ´ µ I I pi, jq “ where I(i, j) and R(i, j) are the gray-scale values of theσpixel at position (i, j) of the input image and I 1
(1)
(2)
reference image, respectively; µI and σI are the mean and standard deviation values of the input Rpi, jq ´ µ R image; and µR and σR are the mean and deviation values of the reference image. If the R1 pi,standard jq “ (3) σR class, the correlation map is defined as input banknote image and reference image are in the same an j) in-class correlation map, denoted values by MIC(i, it is defined between-class where I(i, and R(i, j) are the gray-scale ofj);theotherwise, pixel at position (i, j)asofathe input image and correlation map, denoted µ by and MBC(i,σ j).are Bythe taking theand average imagesdeviation of all thevalues in-classofand reference image, respectively; mean standard the input I I between-class correlation maps of all the training banknote images in each class, we obtain the image; and µ R and σ R are the mean and standard deviation values of the reference image. If the input in-class and between-class correlation maps of each class, denoted by M IC (i , j ) and M BC (i , j ) ,
banknote image and reference image are in the same class, the correlation map is defined as an in-class respectively. Examples of visualized between-class and in-class correlation maps of recent US$100 correlation map, denoted by M IC (i, j); otherwise, it is defined as a between-class correlation map, banknotes in the front-forward direction are shown in Figure 4b,c. denoted byIn Mthe j). step, By taking the average of is allcalculated the in-class and between-class correlation BC (i, next the similarity map ofimages each class by determining the pixel-wise maps ofratio all of thebetween-class training banknote images in each class, obtain(4). theIf in-class and and in-class correlation maps, usingwe Equation a pixel has an between-class in-class mapmaps value of equal to class, zero, its similarity is assigned valueExamples among those of correlation each denoted bymap M ICvalue pi, jq and M BC pi,the jq,maximum respectively. of visualized the other calculated pixels. An example of a visualized similarity map for a front-forward US$100 between-class and in-class correlation maps of recent US$100 banknotes in the front-forward direction banknote image is shown in Figure 4d. are shown in Figure 4b,c. In the next step, the similarity map of each class is calculated by determining the pixel-wise ratio of between-class and in-class correlation maps, using Equation (4). If a pixel has an in-class map value equal to zero, its similarity map value is assigned the maximum value among those of the other calculated pixels. An example of a visualized similarity map for a front-forward US$100 banknote image is shown in Figure 4d.
Sensors 2016, 16, 328
7 of 18
Sensors 2016, 16, 328
7 of 18
Sensors 2016, 16, 328
7 of 18
MM BC (i ,pi,j )jq SSpi, (i, jjq ) “ BC (4) (4) M ij,)jq j) IC MM (i ,(pi, ICBC S (i , j ) (4) M ICwhere (i , j ) the dissimilarity of banknotes from the Using Equation (4), we can determine the areas Using Equation (4), we can determine the areas where the dissimilarity of banknotes from the different classes is than that that of of the thesame sameclass. class.These These areas regions have high different classes is higher higher than areas areare thethe regions thatthat have high Using Equation (4), we can determine the areas where the dissimilarity of banknotes from the discriminating power for banknote images and are represented by the bright pixels in the similarity discriminating power for banknote images are class. represented theare bright in that the similarity different classes is higher than that of theand same These by areas the pixels regions have high map, scaled to the gray values, as shown in Figure 4. map, scaled to the gray values, as shown in Figure 4. discriminating power for banknote images and are represented by the bright pixels in the similarity map, scaled to the gray values, as shown in Figure 4.
(a) (a) (b) (b)
(c) (c)
(d) (d) Figure 4. Examples of correlation maps and similarity map of front-forward recent US$100 banknote
Figure 4. Examples of correlation maps and similarity map of front-forward recent US$100 image: Referenceofimage; (b) maps Between-class correlation map; (c) In-class correlation map; Figure(a) 4.image: Examples correlation similarity map of front-forward recent US$100 banknote banknote (a) Reference image; and (b) Between-class correlation map; (c) In-class correlation (d) Similarity map. image: (a) Reference image; (b) Between-class correlation map; (c) In-class correlation map; map; (d) Similarity map. (d) Similarity map.
Finally, we average the similarity maps of all the banknote classes to obtain the final similarity Finally, wewe average the maps banknote classes obtainthe the final similarity map. To select the banknote areas corresponding tothe the banknote bright pixels on the similarity map, we use Finally, average thesimilarity similarity maps of of all all the classes totoobtain final similarity map. ToTo select thethe banknote corresponding the bright the map, the thresholding method, soareas that the histogram oftothe similarity mapon isondivided by half, the we higher map. select banknote areas corresponding to the brightpixels pixels thesimilarity similarity map, weuse usethe thresholding method, so that the histogram of the similarity map is divided by half, the higher map map values are assigned “1”, and the lower values are assigned “0”. The resulting binary similarity the thresholding method, so that the histogram of the similarity map is divided by half, the higher values are assigned “1”, and the lower values are assigned “0”. The resulting binary similarity map map image is considered to be a mask for selecting the pixels at white mask positions map values are assigned “1”, and the lower values are assigned “0”. The resulting binary similarity image considered to besimilarity a mask for selecting thethe pixels at white mask positions (corresponding bright map on sub-sampled banknote These used to mapisimage isto considered to be a values) mask for selecting the pixels at image. white (corresponding mask are positions in(corresponding recognition ofmap thebright banknote type. The number of banknote pixels selected forbanknote use inare recognition is roughly bright similarity values) on themap sub-sampled image. These used in recognition to similarity values) on the sub-sampled image. These are used of half of the original sub-sampled image (approximately (64in ×selected 12)/2 = 384 This half procedure and inbanknote recognition of the banknote type. The number for of pixels for pixels). use in recognition roughly the type. The number of pixels selected use recognition is roughly ofisthe original examples of each intermediate stage are illustrated in Figure 5. half of the original sub-sampled image (approximately (64 × 12)/2 384 pixels). and Thisexamples procedureofand sub-sampled image (approximately (64 ˆ 12)/2 = 384 pixels). This= procedure each examples ofstage each are intermediate are illustrated in Figure 5. intermediate illustratedstage in Figure 5.
Figure 5. Example of average similarity map obtained from similarity maps of all USD classes and binary mask obtained from similarity mapmap for feature selection. Figure 5. Example average similarity map obtained from classes and Figure 5. Example ofofaverage similarity obtained from similarity similaritymaps mapsofofallallUSD USD classes and binary mask obtainedfrom fromsimilarity similaritymap mapfor for feature feature selection. selection. binary mask obtained
Sensors 2016, 16, 328
8 of 18
2.4. Feature Extraction by PCA and Classification by K-Means Algorithm 2.4.1. PCA Method and PCA-Based K-Means Algorithm To further reduce the number of dimensions of the input vector, we apply the PCA method to banknote data selected using the similarity map in the previous step. PCA is a statistical procedure for representing the data in a lower-dimensional space by projecting original data onto the eigenvectors corresponding to the largest eigenvalues of the covariance matrix. The procedure for conducting PCA in our research is similar to that used in the eigenface method [20,22]. First, we calculate the covariance matrix of the mean-subtracted training data using the following formula: C“
1 XXT N
(5)
” ıT where X “ px1 ´ µq px2 ´ µq ... px N ´ µ q is the µ mean-subtracted vector from the input data xi (i = 1, . . . ,N) and N is the number of original data values. From the covariance matrix C, we calculate the eigenvalues and eigenvectors of C. The N eigenvalues [λ1 , λ2 , . . . , λ N ] are sorted in descending order, and their corresponding eigenvectors are arranged row by row to form the matrix V, as follows: » — — V“— –
v1 v2 ... vN
fi ffi ffi ffi fl
(6)
where vi is the eigenvector corresponding to eigenvalue λi , i = 1, . . . , N. Matrix V is of size N ˆ N. If we need to reduce the input data size to M smaller than N, the projection of X onto the first M eigenvectors’ directions is conducted, and results in Y, which consists of the coefficients of the principal components of X, as shown in the following equation: » — — Y “ VM X “ — –
v1 v2 ... vM
fi » ffi — ffi — ffi — fl –
px1 ´ µq px2 ´ µq ... px N ´ µq
fi ffi ffi ffi fl
(7)
The sizes of V M , X, and Y are M ˆ N, N ˆ 1, and M ˆ 1, respectively. As a result, the banknote data are represented by the PCA coefficients in lower dimensionality, and we use these coefficients as inputs to the classifier in the next step. The features extracted by PCA are used for classification of the banknote type and direction. The number of classes is predefined as the number of denominations to be recognized multiplied by four directions. When a banknote is input into the system, its recognition features are extracted, and the type and direction are determined based on the Euclidean distance to the class centers (vectors), which are obtained using a K-means clustering algorithm [23]. For example, in the case of USD, the number of classes is 68, which equals 17 types of banknotes ˆ4 directions (A, B, C, and D). Therefore, there are 68 class centers in the training result for USD. Using the extracted features of an input banknote, the distances between this PCA feature vector and the 68 center vectors are calculated, and the banknote is determined to belong to the class with the nearest center to the banknote’s feature (the nearest centroid classifier [24]). 2.4.2. Determination of Number of PCA Dimensions used for Feature Extraction Method A typical nearest-centroid-based classifier uses the shortest distance between the input vector and the center vectors as the class assignment criterion. However, there are cases in which the class
Sensors 2016, 16, 328
9 of 18
assignment is not certain, e.g., when the input vector is located at nearly the central position between two class Sensors 2016,centers. 16, 328 In such a case, the difference between the shortest and second-shortest distances 9 of of 18 Sensorsvector 2016, 16, 9 of 18 input to328 the class centers is small. In this study, we considered both the shortest distance, referred to as the 1st distance, the1st second-shortest referred to asdistance, the 2nd distance, the distance, referred to and as the distance, anddistance, the second-shortest referred to toevaluate as the 2nd distance, referred to as the 1st distance, and the second-shortest distance, referred to as the 2nd certainty and effectiveness of the classification results. distance, to evaluate the certainty and effectiveness of the classification results. distance, evaluate certainty and effectiveness of and the classification results. scatter the 1st distances the differences between the 1st and 2nd First,to we draw athe plot of First,of we draw a scatter plot ofcases the 1st and the differences the 1st andhave 2nd of the genuine acceptance cases USD,asasshown shown Figure 6. between The system must distances the genuine acceptance ofofdistances USD, in in Figure 6. The system must have the distances of the genuine acceptance cases of USD, as shown in Figure 6. The system must have the ability to reject unrecognized cases. simulate rejectedcases, cases,we weuse usethe the test test notes notes the on ability to reject thethe unrecognized cases. ToTo simulate thetherejected ability to reject the unrecognized cases. To simulate the rejected cases, we use the test notes on which the patterns were modified, as shown in Figure 7. Because Because the the test test notes notes are unrecognized, unrecognized, which the patterns modified,class as shown Figureare 7. greater Becausethan the those test notes are unrecognized, center in vectors are greater than those of genuine genuine banknotes. their distances to allwere the banknote center vectors of banknotes. their distances to all the banknote class center vectors are greater than those of genuine Therefore, their 1st distances are greater, and the positions of the test note cases on thebanknotes. matching Therefore, theirplot 1st are distances arefrom greater, and the positions of the test note cases the matching scatter away those of the accepted banknote cases.on Figure 6 shows distance scatter plot arefarfar away from those of genuine the genuine accepted banknote cases. Figure 6 distance scatter plot are far away from those of the genuine accepted banknote cases. Figure 6 an example of a scatter plot of matching distances of real USD banknotes and test notes. shows an example of a scatter plot of matching distances of real USD banknotes and test notes. shows an example of a scatter plot of matching distances of real USD banknotes and test notes.
(a) (a)
(b) (b)
Figure 6. Scatter plots of matching distances of real USD banknotes and test notes obtained using 388 Figure Scatter plots plotsof ofmatching matchingdistances distancesofofreal real USD banknotes and notes obtained using Figure 6. 6. Scatter USD and testtest notes obtained using 388 similarity map pixels and (a) 20 PCA dimensions; (b) 388 banknotes PCA dimensions. 388 similarity map pixels and (a) 20 PCA dimensions; (b) 388 PCA dimensions. similarity map pixels and (a) 20 PCA dimensions; (b) 388 PCA dimensions.
(a) (a)
(b) (b)
(c) (c)
(d) (d)
Figure 7. Examples of test notes (a) A direction; (b) B direction; (c) C direction; (d) D direction. Figure 7. 7. Examples Examples of of test test notes notes (a) (a) A A direction; direction; (b) (b) BB direction; direction; (c) (c) CCdirection; direction;(d) (d)D Ddirection. direction. Figure
It can be seen from Figure 6 that the matching score distributions of banknotes and test notes It can be in seen 6 that matching scorewith distributions of banknotes test notes are separated thefrom plotsFigure and that thethe degree of varies the dimensionality of and the extracted It can be seen from Figure 6 that the matching score distributions of banknotes and test notes are separated in the applying plots anda that the degree of varies withonthe dimensionality of the the test extracted PCA features. When threshold for rejection based matching distances, notes are separated in the plots and that the degree of varies with the dimensionality of the extracted PCA features. When applying a threshold for rejection based on matching distances, the test must be rejected and, consequently, the error cases and uncertain banknote cases (banknotesnotes that mustdamaged, be rejectedsoiled, and, consequently, erroralso casesbeandrejected. uncertainIfbanknote casesdistributions (banknotes that are faded, etc.)thewill the score of are damaged, soiled, faded, etc.) will also be rejected. If the score distributions of genuine-acceptance banknotes and test notes are well separated, the uncertain and error cases are genuine-acceptance banknotes and test notes are well separated, the uncertain and error cases are easier to reject, and the recognition results are more reliable. To evaluate the separation between easier matching to reject, and thedistributions, recognition results are morethe reliable. To evaluate the separation between these score we calculate distributions’ scatter values based on these matching score distributions, we calculate the distributions’ scatter values based on
Sensors 2016, 16, 328
10 of 18
PCA features. When applying a threshold for rejection based on matching distances, the test notes must be rejected and, consequently, the error cases and uncertain banknote cases (banknotes that are damaged, soiled, faded, etc.) will also be rejected. If the score distributions of genuine-acceptance banknotes and test notes are well separated, the uncertain and error cases are easier to reject, and the recognition results are more reliable. To evaluate the separation between these matching score distributions, we calculate the distributions’ scatter values based on distribution centers using Fisher’s criterion in LDA [23]. For each test, we obtain two distances dX and dY , namely the 1st distance and the difference between the 1st and 2nd distance. The center of each distribution is at the position (µ X , µY ). The measure of scatter of the matching distance distribution is equivalent to a variance and is calculated as follows: Nÿ ´1 S“ rpd Xi ´ µ X q2 ` pdYi ´ µY q2 s (8) i “0
where N is the number of samples in the distribution. The scatter values of the accepted cases and rejected cases are denoted by S A and SR , respectively. Using the Fisher criterion in LDA, our goal is to find the optimal number of PCA dimensions for banknote feature extraction so that the following ratio (called the F-ratio) is maximized: F“
SB pµ ´ µ RX q2 ` pµ AY ´ µ RY q2 “ AX SW S A ´ SR
(9)
where SB and SW are the between-class scatter and within-class scatter, respectively, and (µ AX , µ AY ) and (µ RX , µ RY ) are the centers of the acceptance and rejection distributions, respectively. 3. Experimental Results In this study, we used a database consisting of 99,236 images captured from 49,618 USD banknotes on both sides. The images in the database include the four directions of 17 types of banknotes: $1, $2, $5, recent $5, most recent $5, $10, recent $10, most recent $10, $20, recent $20, most recent $20, $50, recent $50, most recent $50, $100, recent $100 and most recent $100. The number of images in each banknote class is shown in Table 2. In our experimental database of USD banknote images, both the number of images and the number of classes are comparatively larger than those in previous studies, as shown in Table 3. Table 2. Numbers of banknote images in experimental USD database. Type of Banknote $1 $2 $5 Recent $5 Most Recent $5 $10 Recent $10 Most Recent $10 $20 Recent $20 Most Recent $20 $50 Recent $50 Most Recent $50 $100 Recent $100 Most Recent $100
A Direction
B Direction
C Direction
D Direction
2018 1626 849 1208 1795 1498 1258 1564 1651 1063 1965 1270 1397 1479 1011 1964 1250
2016 1660 834 1218 1797 1509 1277 1565 1647 1069 1959 1262 1343 1573 1126 1761 1136
2018 1626 849 1208 1795 1498 1258 1564 1651 1063 1965 1270 1397 1479 1011 1964 1250
2016 1660 834 1218 1797 1509 1277 1565 1647 1069 1959 1262 1343 1573 1126 1761 1136
Sensors 2016, 16, 328
11 of 18
Table 3. Numbers of images and classes in the experimental databases used in previous studies and in this study.
Study Number of Images Number of Classes 11 of 18 [4] 15,000 24 [13] 3600 24 Table 3. Numbers of images the experimental databases [14] and classes in 3570 24 used in previous studies and [16] 61,240 64 in this study. [25] 65,700 48 This Study study 99,236 68Classes Number of Images Number of
Sensors 2016, 16, 328
[4]
15,000
24
From the selected banknote image data, we extracted the classification features using PCA. In [13] 3600 24 3570 24dimensionality of the extracted this step, the reliability of [14] the classification results is affected by the 61,240 2.4. Therefore, in 64 subsequent experiments, we PCA feature vector, as [16] explained in Section [25] 65,700 48 determined the optimal ThisPCA study dimensionality 99,236 that yields the best 68 classification accuracy and reliability in term of maximization of the F-ratio given by Equation (9). A USD test note database consisting of 2794 images was collected for our rejection test experiments. We considered test notes First, we accepted calculated theofsimilarity and applied half-histogram thresholding to obtain the and false cases banknotesmap to belong to the same distribution, such that the remaining maskdistribution for selectingconsists the discriminative areasaccepted in a 64 ˆcases. 12-pixel Using the of only genuine Thesub-sampled experimental banknote results forimage. the F-ratio calculation classification accuracy for selected various numbers PCA of dimensions shown in to resulting binaryand mask shown in Figure 5, we 388 gray of values the pixels are corresponding Figure 8. The rate was calculated based on unsupervised K-meansclassification. clustering for 68 classes in the white areas of error the mask from the sub-sampled image for banknote the USD banknote database. From the selected banknote image data, we extracted the classification features using PCA. In this It can be seen from the Figure 8 that although there were no classification errors in the cases in step, the reliability of the classification results is affected by the dimensionality of the extracted PCA which 20, 40, or 60 PCA dimensions were used for feature extraction, the separations between the feature vector, as explained in Section 2.4. Therefore, in subsequent experiments, we determined distributions of genuine accepted cases and rejected cases were not good in terms of low ratios the optimal PCA dimensionality that yields the best classification accuracy and reliability in term of between each distribution’s scatter measures. The scatter plot of the matching distances when 20 maximization of the F-ratio given by Equation (9). USD test reached note database consisting of0.001275 2794 images PCA dimensions were used is shown in Figure 6a.AThe F-ratio a maximum value of was collected for our rejection experiments. We considered notes and false accepted cases of at a dimensionality of 160. test As the number of extracted featurestest increases, much more processing banknotes belong to the same such that the use remaining consists for of only time istorequired. Therefore, wedistribution, considered two cases—the of 80 or distribution 160 PCA dimensions feature extraction—in subsequent experiments conducted to evaluate the recognition accuracy genuine accepted cases. The experimental results for the F-ratio calculation and classification accuracy achieved. Scatter of plots of dimensions the distancesare for shown the casesinofFigure extraction of 80 andrate 160 was PCAcalculated dimensionsbased for on for various numbers PCA 8. The error banknote and test note matchingfor tests shown Figure unsupervised K-means clustering 68are classes ininthe USD9.banknote database.
Figure 8. Example of average similaritymap map obtained obtained from maps of all classes and and Figure 8. Example of average similarity fromsimilarity similarity maps of USD all USD classes binary obtained from similaritymap mapfor forfeature feature selection. selection. binary maskmask obtained from similarity
It can be seen from the Figure 8 that although there were no classification errors in the cases in which 20, 40, or 60 PCA dimensions were used for feature extraction, the separations between the distributions of genuine accepted cases and rejected cases were not good in terms of low ratios between each distribution’s scatter measures. The scatter plot of the matching distances when 20 PCA dimensions were used is shown in Figure 6a. The F-ratio reached a maximum value of 0.001275 at a dimensionality of 160. As the number of extracted features increases, much more processing time is required. Therefore, we considered two cases—the use of 80 or 160 PCA dimensions for feature extraction—in subsequent experiments conducted to evaluate the recognition accuracy achieved. Scatter plots of the distances for the cases of extraction of 80 and 160 PCA dimensions for banknote and test note matching tests are shown in Figure 9.
Sensors 2016, 16, 328 Sensors 2016, 16, 328
12 of 18 12 of 18
(a)
(b) Figure 9. Scatter plot of matching distances of real USD banknotes and test notes using 388 similarity Figure 9. Scatter plot of matching distances of real USD banknotes and test notes using 388 similarity map pixels and (a) 80 PCA dimensions; (b) 160 PCA dimensions. map pixels and (a) 80 PCA dimensions; (b) 160 PCA dimensions.
With the parameters for banknote feature extraction determined, we evaluated the accuracy of With the parameters formethod banknote extraction determined, we evaluated the accuracy the proposed recognition infeature comparison to the accuracy reported for methods usedofinthe proposed recognition method in comparison to the accuracy reported for methods used in previous previous studies, as shown in Table 4. When we used 80 or 160 PCA dimensions for feature studies, as shown Tableno 4. changes When weinused or 160 PCA dimensions for feature thereand were extraction, thereinwere the 80 error rates and rejection rates, whichextraction, were 0.002% no0.004%. changes in rejected the errorcases ratescorrespond and rejection rates, which were 0.002% rejected cases The to the banknotes for which theand 1st 0.004%. matchingThe distances were correspond tothe the1st banknotes which the 1stthe matching distances were 1st threshold higher than thresholdfor and for which differences between the higher 1st andthan 2nd the distances were and for which the2nd differences between thethreshold 1st and 2nd distances werethat lower the 2nd result threshold. lower than the threshold. The 2nd is used to ensure thethan recognition is reliable, as explained in Section 2.4.2. Figure 9, the positions rejectedascases on theinscatter plots The 2nd threshold is used to ensure thatInthe recognition result isof reliable, explained Section 2.4.2. in the gray areas. Because thecases totalon error and false rejection rate wasareas. 0.006%, the correct Inare Figure 9, the positions of rejected the scatter plots are in the gray Because the total recognition rate of our method was 99.994%. error and false rejection rate was 0.006%, the correct recognition rate of our method was 99.994%. Table4.4.Comparison Comparisonof ofrecognition recognition accuracy accuracy of Table of the the proposed proposedmethod methodand andprevious previousstudies. studies.
Recognition Experimental USD Banknote Experimental USD Banknote Error Rate (%) Rejection Rate (%) Method Image Database Recognition Method Error Rate (%) Rejection Rate (%) Image Database [4] 15,000 images/24 classes 0.120 0.580 [4] 15,000 images/24 classes 0.120 0.580 [16] 61,240 images/64 classes 0.114 0.000 [16] 61,240 images/64 classes 0.114 0.000 Proposed 99,236 images/68 classes 0.002 0.004 Proposed method method 99,236 images/68 classes 0.002 0.004
Sensors 2016, 16, 328 Sensors 2016, 16, 328
13 of 18 13 of 18
It be seen seen from Table 4 that although the numbers of banknote images and classes in our It can can be our Sensors 2016, 16, 328 from Table 4 that although the numbers of banknote images and classes 13 in of 18 USD database were greater than in other studies, the recognition accuracy of our method was USD database were greater than in other studies, the recognition accuracy of our method was higher higher that in previous inlow terms ofrecognition low falseofrates recognition rates rates. and classes rejection rates. Itthan can be seen from Table 4 thatof although the numbers banknote images and in our than that in previous studies instudies terms false and rejection Consequently, Consequently, we can confirm that our proposed method outperforms the previous previously databasethat were than in other studies, the accuracy of our method wasfor weUSD can confirm ourgreater proposed method outperforms therecognition previous previously proposed methods proposed methods for USD banknote higher than that in previous studiesrecognition. in terms of low false recognition rates and rejection rates. USD banknote recognition. The case our method is in 10, the uppermost uppermost image Consequently, we can confirm proposed method outperforms the previous previously The false false recognition recognition case for forthat our our method is shown shown in Figure Figure 10, in in which which the image is the original banknote image and the middle and lower images are the deskewed image and the proposed methods for USD banknote recognition. is the original banknote image and the middle and lower images are the deskewed image and the 64 × 12-pixel sub-sampled image upper respectively. banknote on the left was The false recognition case forof ourthe method isimage, shown in Figure 10, inThe which the uppermost image 64 ˆ 12-pixel sub-sampled image of the upper image, respectively. The banknote on the left was is the original belonging banknote image and and lower images the deskewed image and the misclassified classthe of middle the banknote banknote on the the right.are This because misclassified as as belonging to to the the class of the on right. This error error case case occurred occurred because 64image × 12-pixel sub-sampled image of the upper image, respectively. The banknote on the left was the was captured from a folded banknote, as seen in Figure 10. the image was captured from a folded banknote, as seen in Figure 10. misclassified as belonging to the class of the banknote on the right. This error case occurred because the image was captured from a folded banknote, as seen in Figure 10.
Figure 10. 10. False False recognition recognition case case of of USD USD banknote: banknote: (a) (a) Input Input banknote; banknote; (b) (b) False False recognized recognized class. Figure class. Figure 10. False recognition case of USD banknote: (a) Input banknote; (b) False recognized class.
Figure 11 presents illustrations of rejection cases in our experiments in which the images are 10. Although arranged in the manner as in Figure input banknote images correctly Figure 11same presents illustrations of rejection cases inthese our experiments in which thewere images are their scores were tootoo high, so their distributions on theon scatter in Figure recognized, their matching scores were high, so these their distributions the plots scatter plots in9 arranged in the matching same manner as in Figure 10. Although input banknote images were correctly were in9the rejection region, where the 1st distances greater thangreater the 1stthan threshold. can be seen Figure were in thematching rejection region, where 1stare distances are thescatter 1stItthreshold. recognized, their scores were toothe high, so their distributions on the plots in It 911were inthe theupper where theto1st distances greater than the 1st threshold. It to in Figure Figure corresponded images of images a are folded similar tosimilar the false can be seen inthat Figure 11rejection thatcase theregion, upper case corresponded to ofbanknote, a folded banknote, can be seen in Figure 11 that the upper case corresponded to images of a folded banknote, similar to the false recognition case in 10. The remainder of the images rejectedwas images was captured from a recognition case in Figure 10.Figure The remainder of the rejected captured from a severely the false recognition case inwith Figure 10.corner, The remainder ofand the rejectedThese imagesresulted was captured from severely damaged banknote a tear, folded corner, writing patterns. These ina1st damaged banknote with a tear, folded and writing patterns. inresulted 1st distances banknote with folded corner, and writing These resulted in 1st distances todamaged theclasses genuine classes ofa tear, these banknote features being higher than the 1st rejection to severely the genuine of these banknote features being higher thanpatterns. the 1st rejection threshold and distances to the genuine classes of these banknote features being higher than the 1st rejection threshold andthe consequently therejected images by being consequently images being the rejected system. by the system. threshold and consequently the images being rejected by the system. In subsequent we applied the proposed experiments, applied method to other countries’ banknote In subsequent experiments, we applied the proposed method to other countries’ banknote image databases types of currency. databases to to confirm confirm the the performance performance of of our our method method for for different different types of paper paper currency. image databases to confirm the performance of our method for different types of paper currency. The banknotes used in these experiments were South African rand (ZAR), Angolan kwanza kwanza (AOA) (AOA) The banknotes used in these experiments were South African rand (ZAR), Angolan kwanza (AOA) and Malawian kwacha (MWK). The numbers of banknote images and classes in the experimental and Malawian kwacha (MWK). The numbers of banknote images and classes in the experimental databases are shown in Table 5. Figure 12 shows some examples of banknote images for each type databases are shown in Table 5. Figure 12 shows some examples of banknote images for each type of currency. currency. of currency.
(a) (a) Figure 11. Cont.
Sensors 2016, 16, 328
14 of 18
Sensors 2016, 16, 328
14 of 18
Sensors 2016, 16, 328
14 of 18
(b) Figure 11. Rejection cases in USD banknote image database: (a) Case 1; (b) Case 2. Figure 11. Rejection cases in USD banknote image database: (a) Case 1; (b) Case 2.
Table 5. Numbers of banknote images and classes in the experimental databases of Angolan kwanza (AOA), Malawian kwacha (MWK) and South African rand (ZAR). Currency
Number of Images
Number of Classes
AOA 1366 36 (b) MWK 2464(a) 24 ZAR 760 40 Figure 11. Rejection cases in USD banknote image database: (a) Case 1; (b) Case 2.
(b) (a)
(c) (b)
Figure 12. Examples of banknote images in the experimental databases: (a) Angolan kwanza (AOA); (b) Malawian kwacha (MWK); (c) South African rand (ZAR). Table 5. Numbers of banknote images and classes in the experimental databases of Angolan kwanza (AOA), Malawian kwacha (MWK) and South African rand (ZAR).
Currency AOA MWK ZAR
Number of Images 1366 2464 (c) 760
Number of Classes 36 24 40
Figure 12. Examples of banknote images in the experimental databases: (a) Angolan kwanza (AOA); Figure 12. Examples of banknote images in the experimental databases: (a) Angolan kwanza (AOA); (b) Malawian kwacha (MWK); (c) South African rand (ZAR). (b)Because Malawian (MWK);to(c) South African rand (ZAR). testkwacha notes similar those used in the USD experiments were not available for the AOA,
MWKTable and 5.ZAR currencies, we tested of these databases using the same Numbers of banknote imagesthe andrecognition classes in theaccuracy experimental databases of Angolan kwanza parameters those for USD (MWK) recognition. In addition, because there has been previous research Because test notes similar to those used in therand USD experiments werenonot available for the (AOA), as Malawian kwacha and South African (ZAR). on recognition of paper banknotes from Angola, Malawi, or South Africa, we were not able AOA, MWK and ZAR currencies, we tested the recognition accuracy of these databases usingtothe Currency Number of Images Number of compare the accuracy of our method with any methods applied toClasses these currencies previous same parameters as those for USD recognition. In addition, because there has beeninno previous AOA correctly recognized 1366 36 studies. Our proposed method 100% of the banknote images in the AOA and research on recognition of paper banknotes from Angola, Malawi, or South Africa, we were not able MWK 2464 ZAR databases and 99.675% of the banknotes in the MWK database.24The experimental results for the to compare the accuracy ofZAR our method with 760any methods applied 40 to these currencies in previous Because test notes similar to those used in the USD experiments were not available for the AOA, MWK and ZAR currencies, we tested the recognition accuracy of these databases using the same parameters as those for USD recognition. In addition, because there has been no previous research on recognition of paper banknotes from Angola, Malawi, or South Africa, we were not able to
Sensors 2016, 16, 328
15 of 18
similarity maps and the recognition error rates for the AOA, MWK and ZAR databases are given in Sensors Table 2016, 6. 16, 328
15 of 18
Table 6. Experimental results for the AOA, MWK, and ZAR banknote image databases.
studies. Our proposed method correctly recognized 100% of the banknote images in the AOA and Sensors 2016, 16, 32816, 328 Similarity Map 15(%) of 18 Sensors 2016, 15 of 18 Currency Binary MaskThe experimental Error Rate ZAR databases and 99.675% of the banknotes in the MWK database. results for SensorsSensors 2016, 16, 32816, 328 15 of 18 2016, 15 of 18 Sensors 2016, 16, 328and the recognition error rates for the AOA, MWK and ZAR databases are Sensors 2016, 16, 328 15given of 1815 of 18 the AOA similarity maps 0.000 similarity mapsmaps and the errorerror rates rates for the MWKMWK and ZAR databases are given in in similarity andrecognition the recognition forAOA, the AOA, and ZAR databases are given in Table 6.mapsmaps similarity and the errorerror rates rates for the MWKMWK and ZAR databases are given in in similarity andrecognition the recognition forAOA, the AOA, and ZAR databases are given Table 6. Table 6. similarity andrecognition the recognition forAOA, the AOA, and ZAR databases are given similarity and the error error rates rates for the MWKMWK and ZAR databases are given in in MWK 0.325 Table 6. maps Table 6. maps 6.Table 6. Experimental results for the AOA, MWK, and ZAR banknote image databases. TableTable 6. TableTable 6. Experimental results for thefor AOA, MWK,MWK, and ZAR imageimage databases. 6. Experimental results the AOA, and banknote ZAR banknote databases. ZAR TableTable 0.000 6. Experimental resultsresults for thefor AOA, MWK,MWK, and ZAR imageimage databases. 6. Experimental the AOA, and banknote ZAR banknote databases. Currency Similarity Map Binary Mask Errordatabases. Rate (%) 6. Experimental results the AOA, and ZAR banknote TableTable 6. Experimental results for thefor AOA, MWK,MWK, and ZAR banknote imageimage databases. Currency Similarity Map Binary Mask ErrorError Rate Rate (%) (%) Currency Similarity Map Binary Mask Currency Similarity Map Map Binary MaskMask ErrorError Rate Rate (%) (%) Currency Similarity Binary From the imagesSimilarity of the similarity maps and the resulting masks shown in Table 6,0.000 most of the Currency Similarity Binary Error Rate (%) Currency Map Map Binary MaskMask Error Rate (%) AOA AOA 0.000 AOA 0.000 AOA 0.000 AOA 0.000 selected areas for recognition in the MWK and ZAR banknote images were on the two sides. The AOAAOA 0.000 0.000 MWKMWK recognition area in the AOA banknote images was located in the middle of the images.0.325 The0.325 reason MWKMWK 0.3250.325 MWK 0.325 forMWK these results is that the patterns on these banknotes, such as numbers, seals, photos, and MWK 0.325 0.325 ZAR 0.000 ZAR 0.000 portraits, are asymmetrically distributed. In the cases of MWK and ZAR, the photo 0.000 and portrait ZAR ZAR 0.000 ZAR ZAR 0.000 ZARprinted far to the two sides of the banknotes, while on AOA banknotes, 0.000 patterns are the 0.000 feature From the images of the similarity maps and the resulting masks shown in Table 6, most of the the images of in thethe similarity the resulting showndenominations in Table 6, most of the patterns From are more different middle maps areas, and depending on themasks banknotes’ and From the images of the similarity maps and the resulting masks shown in Table 6, most of theofThe From the images of the similarity maps and the resulting masks shown in Table 6, most the selected areas for recognition in the MWK and ZAR banknote images were on the two sides. The selected areas for recognition in the MWK and ZAR banknote images were on the two sides. directions. As a result, the high-discriminating-power regions for AOA, MWK, and ZAR banknote From therecognition images the similarity maps andresulting the resulting masks shown in Table 6, most the From theareas images ofrecognition theofsimilarity maps andZAR the masks shown in Table 6, most of theofThe selected areas for in the MWK and banknote images were on the two sides. The selected for in the MWK and ZAR banknote images were on the two sides. From the images of the similarity maps and the resulting masks shown in Table 6, most of recognition area in the banknote images was in the of the The reason recognition area inAOA the AOA banknote images was located inmiddle theimages middle ofimages. the images. The reason images were determined and are shown in Table 6.located selected areas for recognition in the MWK and ZAR banknote were on the two sides. The selected areas for recognition in the MWK and ZAR banknote images were on the two sides. The recognition area in the AOA banknote images was located insuch thein middle of the The reason recognition area inis the banknote images was located the middle ofimages. the The reason thethese selected areas for recognition inMWK the and ZAR banknote images were onimages. the two sides. for results iserror that theAOA patterns on MWK these banknotes, as numbers, seals, photos, and for these results that thethe patterns on these banknotes, such asof numbers, seals, photos, and Examples of cases in database are shown inmiddle Figure 13. The lower image with recognition area in the AOA banknote images was located in the middle of the images. The reason recognition area in the AOA banknote images was located in the the images. The reason for these results iseach that the patterns on images these banknotes, such asmiddle numbers, seals, photos, and for these results that thebanknote patterns on these banknotes, such as image. numbers, seals, photos, and The recognition area inisthe AOA was located inMWK the of thephoto images. The reason portraits, are asymmetrically distributed. In the cases of MWK and ZAR, the and portrait portraits, are asymmetrically distributed. In the cases of and ZAR, the photo and portrait smaller sizes for pair was sub-sampled from the upper banknote In this figure, the for these results is the that patterns the patterns on these banknotes, such as ZAR, numbers, seals, photos, and for these results isasymmetrically that on In these banknotes, such as numbers, seals, photos, and portraits, are asymmetrically distributed. the cases of MWK and ZAR, the photo and portrait portraits, are distributed. In the cases of MWK and the photo and portrait for these results isprinted that patterns on these banknotes, such as numbers, photos, and patterns are printed farthe tofar theto two sides of the banknotes, while onshown AOA banknotes, the portraits, feature patterns are the two sides of the banknotes, while onseals, AOA banknotes, thewere feature MK100 banknote images of the front side and forward back side in the leftphoto column portraits, are asymmetrically distributed. In the cases of MWK and ZAR, the and portrait portraits, are asymmetrically distributed. In the cases of MWK and ZAR, the photo and portrait patterns are more printed far to the two sides of the banknotes, while on AOA banknotes, the feature patterns are printed far the two sides the banknotes, while on AOA banknotes, theright feature are asymmetrically distributed. Inmiddle the cases ofof MWK andexamples ZAR, the photo and portrait patterns are patterns are different into areas, depending on the banknotes’ denominations patterns are more in the middle areas, depending on the banknotes’ denominations and misclassified as MK500 banknotes in the same direction, of which are shown in the patterns are printed far tothe the two sides the banknotes, while on AOA banknotes, theand feature patterns are printed fardifferent to the two sides of theof banknotes, while on AOA banknotes, the feature patterns are more different in the middle areas, depending on the banknotes’ denominations and patterns are more different in the middle areas, depending on the banknotes’ denominations and printed far to athe two sides of the banknotes, while on AOA banknotes, the feature patterns are more directions. As result, the high-discriminating-power regions for AOA, MWK, and ZAR banknote directions. As a result, the high-discriminating-power regions for AOA, MWK, and ZAR banknote column. It can be seen from the Figure 13 that in the areas selected for recognition by map in Table 6, patterns are more different inmiddle the middle depending on theAOA, banknotes’ denominations patterns areAsmore different in the areas,areas, depending onfor the banknotes’ denominations and and directions. a result, the high-discriminating-power regions AOA, MWK, and ZAR banknote directions. As a result, the high-discriminating-power regions for MWK, and ZAR banknote different in the middle areas,in depending onTable the andMK500 directions. As a result, images were determined are shown in 6.images were determined and are shown in banknotes’ Table 6.regions the images shapes of the sub-sampled ofdenominations the and banknotes are directions. As atextures result, the high-discriminating-power regions for AOA, MWK, and ZAR banknote directions. As a the result, theand high-discriminating-power forMK100 AOA, MWK, and ZAR banknote images were determined and are shown in Table 6. images were determined and are shown in Table 6. the high-discriminating-power regions for AOA, MWK, and ZAR banknote images were determined Examples of error cases in the MWK database are shown in Figure 13. The lower image with Examples of error cases in the MWK database are shown in Figure 13. The lower image with slightly similar to each other. This resulted in misclassification in these cases. However, the banknote images were determined and are shown in database Table 6. shown images were determined andcases are shown in Table 6. are Examples ofineach error cases in the MWK database in Figure 13. The lower image with Examples of error in the MWK are shown in Figure 13. The lower image with and aresizes shown Table 6.ZAR smaller for pair was sub-sampled from the upper banknote image. In this figure, the smaller sizes for each pair was sub-sampled from the upper banknote image. In this figure, the images in the AOA and databases were correctly recognized with error rates of 0%, so we can Examples of each error cases inMWK the MWK database are shown in Figure 13. The lower image with Examples of each error caseswas in the database are shown in Figure 13. The lower image with smaller sizes for pair sub-sampled from the upper banknote image. In this figure, the smaller sizes for pair was sub-sampled from the upper banknote image. In this figure, the Examples of error cases in the MWK database are shown in Figure 13. The lower image with MK100 banknote images ofwas theofsub-sampled front side and forward back side shown in the left column were MK100 images the can front andfrom forward back side shown inIn the left column confirm thatbanknote oureach proposed method beside applied to paper currencies from various countries andwere smaller sizes for each pair was sub-sampled the upper banknote image. In this figure, the smaller sizes for pair from the upper banknote image. this figure, the MK100 banknote images of the front side and forward back side of shown inIn the left column were MK100 banknote images of the front side and forward back side shown in theshown left column were smaller sizes for each pair was sub-sampled from thedirection, upper banknote image. this figure, MK100 misclassified as MK500 banknotes inofthe direction, examples which are shown inthe the right misclassified as MK500 banknotes insame the same examples of which are in the right achieve good performance inthe terms matching accuracy. MK100 banknote images of the front side and forward back side shown in the left column were MK100 banknote images of front side and forward back side shown in the left column were misclassified as MK500 banknotes inFigure the same direction, examples ofmethod. which are shown inmap the right misclassified asbethe MK500 banknotes inthat the same direction, examples ofrecognition which are shown inin the banknote images of front side and forward back side shown infor the left column were column. can seen from the Figure 13 theinareas selected recognition by map inthe Table 6, right column. Itbe can seen from the 13in that the recognition areas selected for bymisclassified Table 6, WeIt also measured the processing time for our This experiment was misclassified as MK500 banknotes in the same direction, examples of which are shown in the right misclassified as MK500 banknotes in the same direction, examples of which are shown in right column. It can be seen from the Figure 13 that in the areas selected for recognition by map in Table 6, column. It can be seen from the Figure 13 that in the areas selected for recognition by map in Table 6, as MK500 banknotes in the same direction, examples of which are shown in the right column. It can be the shapes of the textures in the sub-sampled images of MK100 and MK500 banknotes the of theUSD textures in the images of the and MK500 banknotes conducted using the banknote image database andareas a the desktop personal computer with column. Itbe can be seen from the Figure 13 that inareas the selected for recognition by(PC) map inare Table 6, column. Itshapes can seen from the Figure 13sub-sampled that in the selected for MK100 recognition by map in Table 6,a are the shapes of the textures in the sub-sampled images of the MK100 and MK500 banknotes are the shapes of the textures in the sub-sampled images of the MK100 and MK500 banknotes are seen from the Figure that in theresulted areas selected for recognition by incases. Table 6, the shapes the slightly similar toand each other. This in misclassification in these cases. However, the banknote slightly similar to413 each other. This resulted in misclassification inmap these However, the of banknote 2.33shapes GHz CPU GB of memory. In these experiments, we compared the time required when the shapes of the textures in the sub-sampled images of the MK100 and MK500 banknotes are the of the textures in the sub-sampled images of the MK100 and MK500 banknotes are slightly similar to each This resulted in misclassification inbanknotes these cases. However, the banknote slightly similar to other. each other. This resulted in misclassification in these cases. However, the banknote textures in the sub-sampled images of the MK100 and MK500 are slightly similar toso each images in the AOA and ZAR databases were correctly recognized with error rates of 0%, so we can images in the AOA and ZAR databases were correctly recognized with error rates ofdimensions 0%, we can using 80 and 160 PCA dimensions for the feature extraction process. When 160 PCA slightly similar to each other. This resulted in misclassification in these cases. However, the banknote slightly similar to each other. This resulted in misclassification in these cases. However, the banknote images in the AOA and ZAR databases were correctly recognized with error rates of 0%, so we can images in the AOA and ZAR databases were correctly recognized with error rates of 0%, so we and can other. This resulted inproposed misclassification in these cases. banknote images in the When AOAand and confirm our proposed method can be applied to However, paper currencies from various countries that our method can be applied to paper currencies from various countries wereconfirm used, the system was able to process approximately 442the images/s (1000/2.26 ms). the images the AOA and ZAR databases were correctly recognized error rates ofso 0%, we and can images inthat thein AOA and ZAR databases were correctly recognized with with error rates of 0%, weso can confirm that our proposed method can be applied to paper currencies from various countries and confirm that our proposed method can be applied to paper currencies from various countries ZAR databases were correctly recognized with error rates ofpaper 0%, we can confirm that our countries proposed achieve good performance in terms of matching accuracy. achieve good performance inmethod terms of matching accuracy. number of extracted features by PCA was reduced by half, thesocurrencies processing speedvarious increased toand 568 and confirm that our proposed can be applied to from confirm that our proposed method can be applied to paper currencies from various countries achieve good performance in terms of matching accuracy. achieve good performance incurrencies terms of matching accuracy. method can be applied tothe paper from various countries and achieve good performance We also measured processing time for our recognition method. This experiment wasinwas Wesecond also measured the processing time for our recognition method. This experiment images per (1000/1.76 ms). Therefore, we used 80 PCA dimensions for final decisions using achieve good performance in terms of matching accuracy. achieve good performance in terms of matching accuracy. We also measured the processing time for our recognition method. This experiment was We also measured the processing time for our recognition method. This experiment terms of matching accuracy. conducted using themeasured USD banknote image database and aand desktop personal computer with a was conducted using thethe USD banknote image database a desktop personal computer (PC) with a our We banknote recognition method. The average processing times aremethod. shown inThis Table 7. (PC) We also the processing time for our recognition method. This experiment was also measured processing time for our recognition experiment was conducted using the USD banknote image database and a desktop personal computer (PC) with awhen conducted using the USD banknote image database and a desktop personal computer (PC) with a 2.33 GHz CPU and 4 GB of memory. In these experiments, we compared the time required when 2.33 GHz CPU and 4 GB of memory. In these experiments, we compared the time required conducted using the USD banknote image database and a desktop personal computer (PC) with conducted using the USD banknote image database and a desktop personal computer (PC) with a 2.33 GHz CPU and 4and GB memory. Inthe these experiments, we compared the time required whenwhena 2.33 GHz CPU 4ofGB of memory. In these experiments, we compared the time required using 80 and 160 PCA dimensions for feature extraction process. When 160 PCA dimensions using 80 and 160 PCA dimensions for the feature extraction process. When 160 PCA dimensions 2.33 GHz CPU 4ofGB of memory. In these experiments, we compared the time required 2.33 GHz CPU andPCA 4and GB memory. Inthe these experiments, we compared the time required whenwhen using 80 and 160 dimensions forto feature extraction process. When 160 PCA dimensions using 80 and 160 PCA dimensions for the feature extraction When 160 PCA dimensions werewere used, the160 system was able to for process approximately 442process. images/s (1000/2.26 ms). When the the used, the system was able process approximately 442process. images/s (1000/2.26 ms). When using 80 and 160 PCA dimensions for the feature extraction process. When 160 PCA dimensions using 80 and PCA dimensions the feature extraction When 160 PCA dimensions were used, the system was able to process approximately 442 images/s (1000/2.26 ms).increased When the were used, the system was able to process approximately 442 images/s (1000/2.26 ms). When the number of extracted features by PCA was reduced by half, the processing speed increased to 568 number of extracted features by PCA was reduced by half, the processing speed to 568 were used, the system was able to process approximately 442 images/s (1000/2.26 ms). When the were used, the system was able to process approximately 442 images/s (1000/2.26 ms). When the number of extracted features by PCA was reduced byused half, the processing speed increased to 568to number of extracted features by PCA was reduced by half, the processing speed increased 568 images per second (1000/1.76 ms). Therefore, we used 80 PCA dimensions for final decisions using images per second (1000/1.76 ms). Therefore, we 80 PCA dimensions for final decisions using number of extracted features by PCA was reduced by half, thedimensions processing speed increased 568 number of extracted features by PCA was reduced byused half, the processing speed increased to 568to images per second (1000/1.76 ms). Therefore, we used 80 PCA dimensions for final decisions using images per second (1000/1.76 ms). Therefore, we 80 PCA for final decisions using our banknote recognition method. The average processing times are shown in Table 7. our banknote recognition method. The average processing times are shown in Table 7. images per second (1000/1.76 ms). Therefore, we used 80 PCA dimensions for final decisions using images per second (1000/1.76 ms). Therefore, we used 80 PCA dimensions for final decisions using our banknote recognition method. The average processing timestimes are shown in Table 7. 7. our banknote recognition method. The average processing are shown in Table our banknote recognition method. The average processing are shown in Table 7. our banknote recognition method. The average processing timestimes are shown in Table 7.
Figure 13. 13. False False recognition recognition cases cases in in MWK MWK banknote banknote image image database: database: (a) Input banknote; banknote; (b) (b) False False Figure (a) Input recognized class. recognized class.
Figure 13. False recognition cases cases in MWK banknote imageimage database: (a) Input banknote; (b) False Figure 13. False recognition in MWK banknote database: (a) Input banknote; (b) False Figure 13. False recognition cases cases in MWK banknote imageimage database: (a) Input banknote; (b) False Figure 13. False recognition in MWK banknote database: (a) Input banknote; (b) False recognized class. recognized class. Figure 13. False recognition in MWK banknote database: (a) Input banknote; (b) False Figure 13. False recognition cases cases in MWK banknote imageimage database: (a) Input banknote; (b) False recognized class. recognized class.
Sensors 2016, 16, 328
16 of 18
We also measured the processing time for our recognition method. This experiment was conducted using the USD banknote image database and a desktop personal computer (PC) with a 2.33 GHz CPU and 4 GB of memory. In these experiments, we compared the time required when using 80 and 160 PCA dimensions for the feature extraction process. When 160 PCA dimensions were used, the system was able to process approximately 442 images/s (1000/2.26 ms). When the number of extracted features by PCA was reduced by half, the processing speed increased to 568 images per second (1000/1.76 ms). Therefore, we used 80 PCA dimensions for final decisions using our banknote recognition method. The average processing times are shown in Table 7. Table 7. Processing time of the proposed recognition method on desktop computer (unit: ms). Number of PCA Dimensions
Sub-Sampling
Feature Extraction
160 80 (Proposed)
1.23 1.23
0.78 0.40
K-Means Matching
Total Processing Time
0.25 0.13
2.26 1.76
In a previous study [16] in which a higher-powered PC (3.5-GHz CPU, 8 GB of memory) was used, up to 5.83 ms was required to recognize an image. Our proposed method required less processing time for the following reasons. First, because we used deskewed banknote images of smaller sizes (up to 400 ˆ 120 pixels, compared to 1212 ˆ 246 in [16]), the sub-sampling time was reduced. Second, the number of extracted features used for recognition in our method was smaller (80 dimensions, compared to 192 in [16]). Therefore, the feature extraction and matching processes required less time than with the method used in [16]. In addition, we measured the processing time of a banknote-counting machine using a Texas Instruments (TI) digital media processor (chip). This machine required approximately 1 ms to process and recognize one input banknote using our proposed method with 80 PCA features extracted from a visible-light banknote image. We also calculated the total memory usage required to employ our proposed method with a counting machine with limited resources. The measurement details are given in Table 8. The total memory usage was 931,924 Bytes for our method. Our proposed method outperformed the USD recognition method described in [16] in terms of both processing time (15.6 ms) and memory usage (1.6 MB). Table 8. Calculation of memory usage of our proposed method. Category
Data Size
Data Type
Memory Usage (Bytes)
Original image Deskewed image Sub-sampled image Similarity map Selected region by similarity map PCA transform matrix Extracted PCA features K-means centers
1584 ˆ 464 400 ˆ 120 64 ˆ 12 388 388 80 ˆ 388 80 80 ˆ 68
BYTE BYTE BYTE Integer BYTE Integer Integer Integer
734,976 48,000 768 1552 388 124,160 320 21,760
Total
931,924
4. Conclusions In this paper, we propose an efficient banknote recognition method based on the selection of the high-discriminating-power regions of banknote images captured by visible-light sensors. The recognition regions are determined by calculating the ratio between the in-class similarity and between-class similarity of banknote images. Our experimental results show that using a PCA-based K-means algorithm as the classifier, our proposed method was able to recognize various paper
Sensors 2016, 16, 328
17 of 18
currencies by denomination and input direction with high accuracy, as indicated by low error rates and rejection rates. With the help of a test note database that represents rejection cases, we were also able to evaluate the reliability of our method based on the measurement of scatter between genuine acceptance and rejection score distributions. In future work, we plan to combine our recognition method with the evaluation of fitness for recirculation of banknotes to properly reject poor-quality banknotes that are difficult to recognize. In addition, we intend to extend our method for recognizing paper currencies from multiple countries, rather than recognition of denominations and directions of banknotes only from an individual country. Acknowledgments: This research was supported by a grant from the Advanced Technology Center R&D Program funded by the Ministry of Trade, Industry & Energy of Korea (10039011). Author Contributions: Tuyen Danh Pham and Kang Ryoung Park designed the overall system and made the banknote feature extraction algorithm. In addition, they wrote and revised the paper. Young Ho Park and Seung Yong Kwon implemented the banknote recognition algorithm. Dae Sik Jeong and Sungsoo Yoon helped with the dataset collection and experiments. Conflicts of Interest: The authors declare no conflict of interest.
References 1. 2.
3.
4. 5. 6. 7.
8.
9.
10. 11.
12. 13.
Wu, Q.; Zhang, Y.; Ma, Z.; Wang, Z.; Jin, B. A Banknote Orientation Recognition Method with BP Network. In Proceedings of the WRI Global Congress on Intelligent Systems, Xiamen, China, 19–21 May 2009; pp. 3–7. Zhang, E.-H.; Jiang, B.; Duan, J.-H.; Bian, Z.-Z. Research on Paper Currency Recognition by Neural Networks. In Proceedings of the International Conference on Machine Learning and Cybernetics, Xi’an, China, 2–5 November 2003; pp. 2193–2197. Gunaratna, D.A.K.S.; Kodikara, N.D.; Premaratne, H.L. ANN based currency recognition system using compressed gray scale and application for Sri Lankan currency notes-SLCRec. Proc. World Acad. Sci., Eng. Technol. 2008, 35, 235–240. Gai, S.; Yang, G.; Wan, M. Employing quaternion wavelet transform for banknote classification. Neurocomputing 2013, 118, 171–178. [CrossRef] Sharma, B.; Kaur, A. Recognition of Indian paper currency based on LBP. Int. J. Comput. Appl. 2012, 59, 24–27. [CrossRef] Hassanpour, H.; Farahabadi, P.M. Using hidden markov models for paper currency recognition. Expert Syst. Appl. 2009, 36, 10105–10111. [CrossRef] Jahangir, N.; Chowdhury, A.R. Bangladeshi Banknote Recognition by Neural Network with Axis Symmetrical Masks. In Proceedings of the 10th International Conference on Computer and Information Technology, Dhaka, Bangladesh, 27–29 December 2007; pp. 1–5. Takeda, F.; Nishikage, T. Multiple Kinds of Paper Currency Recognition Using Neural Network and Application for Euro Currency. In Proceedings of the IEEE-INNS-ENNS International Joint Conference on Neural Networks, Como, Italy, 24–27 July 2000; pp. 143–147. Takeda, F.; Omatu, S.; Onami, S. Recognition System of US Dollars Using a Neural Network with Random Masks. In Proceedings of the International Joint Conference on Neural Networks, Nagoya, Japan, 25–29 October 1993; pp. 2033–2036. Takeda, F.; Nishikage, T.; Omatu, S. Banknote recognition by means of optimized masks, neural networks and genetic algorithms. Eng. Appl. Artif. Intell. 1999, 12, 175–184. [CrossRef] Hasanuzzaman, F.M.; Yang, X.; Tian, Y. Robust and Effective Component-based Banknote Recognition by SURF Features. In Proceedings of the 20th Annual Wireless and Optical Communications Conference, Newark, NJ, USA, 15–16 April 2011; pp. 1–6. Youn, S.; Choi, E.; Baek, Y.; Lee, C. Efficient multi-currency classification of CIS banknotes. Neurocomputing 2015, 156, 22–32. [CrossRef] Ahmadi, A.; Omatu, S.; Kosaka, T. A PCA Based Method for Improving the Reliability of Bank Note Classifier Machines. In Proceedings of the 3rd International Symposium on Image and Signal Processing and Analysis, Rome, Italy, 18–20 September 2003; pp. 494–499.
Sensors 2016, 16, 328
14.
15.
16.
17.
18. 19.
20.
21. 22. 23. 24. 25.
18 of 18
Omatu, S.; Yoshioka, M.; Kosaka, Y. Reliable Banknote Classification Using Neural Networks. In Proceedings of the 3rd International Conference on Advanced Engineering Computing and Applications in Sciences, Sliema, Malta, 11–16 October 2009; pp. 35–40. Rong, Z.; Xiangxian, C.; Zhifeng, T.; Jidong, B. Design of Bill Acceptor for Automatic Fare Collection of Rail Transit. In Proceedings of the Enterprise Systems Conference, Shanghai, China, 2–3 August 2014; pp. 179–183. Park, Y.H.; Kwon, S.Y.; Pham, T.D.; Park, K.R.; Jeong, D.S.; Yoon, S. A high performance banknote recognition system based on a one-dimensional visible light line sensor. Sensors 2015, 15, 14093–14115. [CrossRef] [PubMed] Choi, E.; Lee, J.; Yoon, J. Feature Extraction for Bank Note Classification Using Wavelet Transform. In Proceedings of the 18th International Conference on Pattern Recognition, Hong Kong, China, 20–24 August 2006; pp. 934–937. Vishnu, R.; Omman, B. Principal Features for Indian Currency Recognition. In Proceedings of the Annual IEEE India Conference, Pune, India, 11–13 December 2014; pp. 1–8. Verma, K.; Singh, B.K.; Agarwal, A. Indian Currency Recognition based on Texture Analysis. In Proceedings of the Nirma University International Conference on Engineering, Ahmedabad, Gujarat, India, 8–10 December 2011; pp. 1–5. Grijalva, F.; Rodriguez, J.C.; Larco, J.; Orozco, L. Smartphone Recognition of the U.S. Banknotes’ Denomination, for Visually Impaired People. In Proceedings of the IEEE ANDESCON, Bogota, Colombia, 15–17 September 2010; pp. 1–6. Smart K3. Available online: http://kisane.com/en/our-service/smart-k3/ (accessed on 11 February 2016). Turk, M.; Pentland, A. Eigenfaces for recognition. J. Cogn. Neurosci. 1991, 3, 71–86. [CrossRef] [PubMed] Duda, R.O.; Hart, P.E.; Stork, D.G. Pattern Classification, 2nd ed.; Wiley: New York, NY, USA, 2001. Nearest Centroid Classifier. Available online: https://en.wikipedia.org/w/index.php?title=Nearest_centroid _classifier&oldid=676582023 (accessed on 13 December 2015). Kagehiro, T.; Nagayoshi, H.; Sako, H. A Hierarchical Classification Method for US Bank Notes. In Proceedings of the IAPR Conference on Machine Vision Applications, Tsukuba Science City, Japan, 16–18 May 2005; pp. 206–209. © 2016 by the authors; licensee MDPI, Basel, Switzerland. This article is an open access article distributed under the terms and conditions of the Creative Commons by Attribution (CC-BY) license (http://creativecommons.org/licenses/by/4.0/).