Efficient Computation of Personal Aggregate Queries on Blogs Ka Cheung Sia and Junghoo Cho UCLA Los Angeles, CA 90095
Yun Chi
Belle L. Tseng
NEC Labs America Cupertino, CA 95014
Yahoo! Inc. Sunnyvale, CA 94089
[email protected]
[email protected]
{kcsia,cho}@cs.ucla.edu ABSTRACT
1.
There is an exploding amount of user-generated content on the Web due to the emergence of “Web 2.0” services, such as Blogger, MySpace, Flickr, and del.icio.us. The participation of a large number of users in sharing their opinion on the Web has inspired researchers to build an effective “information filter” by aggregating these independent opinions. However, given the diverse groups of users on the Web nowadays, the global aggregation of the information may not be of much interest to different groups of users. In this paper, we explore the possibility of computing personalized aggregation over the opinions expressed on the Web based on a user’s indication of trust over the information sources. The hope is that by employing such “personalized” aggregation, we can make the recommendation more likely to be interesting to the users. We address the challenging scalability issues by proposing an efficient method, that utilizes two core techniques: Non-Negative Matrix Factorization and Threshold Algorithm, to compute personalized aggregations when there are potentially millions of users and millions of sources within a system. We show that, through experiments on real-life dataset, our personalized aggregation approach indeed makes a significant difference in the items that are recommended and it reduces the query computational cost significantly, often more than 75%, while the result of personalized aggregation is kept accurate enough.
The amount of user-generated content on the Web is exploding as the broadband internet connection becomes ubiquitous and many “Web 2.0” services, such as Blogger, MySpace, Flickr, and del.icio.us, make it extremely easy even for a novice user to post and share their own creation on the Web. These user-generated contents are the expression of individuals’ opinion on various issues and items around them. For example, a technical blogger may write his own opinion on a new and highly-anticipated gadget on his blog, and a del.icio.us user may “bookmark” a page if she finds the page worth a later visit. The participation of a large number of users in sharing their opinion on the Web has inspired researchers to build an effective “information filter” by aggregating these independent opinions. For example, del.icio.us and Digg – two popular online bookmarking sites – count how many times a page is “bookmarked” or “digged” by their users, and prominently show the most popular pages on their front page. The hope of these aggregation services is that by leveraging the independent judgement of millions of users, we can tap into the wisdom of the crowds and make a good collective judgement on what items and/or topics are truly interesting. Such aggregation service is shown to be effective in finding the popular and interesting items from the Web. However, this approach suffers from two shortcomings: (1) a particular user’s interest may be significantly different from the interest of the general publics. (2) it may be vulnerable to spam. For example, a group of users can collaborate to promote pages for their own benefit to the front page of Digg. Also, given the diverse groups of users on the Web nowadays, a Web page that has been recommended by a particular group of users may not be of much interest to different groups of users. In this paper, to address the above-mentioned problems, we explore the possibility of computing personalized aggregation of the opinions expressed on the Web. Under our approach, we assume that each user indicates how much the user “trusts” each information source1 — either explicitly or implicitly. Then as each source “mentions” or “endorses” different items2 over time, users get personalized recommendation of items based on how many times each item is endorsed by their trusted sources. By employing this “personalized” aggregation, we can make the recommendation more likely to align with the user’s interest and less vulnerable to spam created by untrusted sources. In fact, in our experiments, we ob-
Categories and Subject Descriptors H.3.3 [Information Search and Retrieval]: Information filtering; H.3.4 [Systems and Software]: Performance evaluation (efficiency and effectiveness)
General Terms Algorithms, Experimentation
Keywords Persoanlized Recommendation, Aggregate Queries, Matrix Factorization, Web-mining.
Permission to make digital or hard copies of all or part of this work for personal or classroom use is granted without fee provided that copies are not made or distributed for profit or commercial advantage and that copies bear this notice and the full citation on the first page. To copy otherwise, to republish, to post on servers or to redistribute to lists, requires prior specific permission and/or a fee. KDD’08, August 24-27, 2008, Las Vegas, Nevada, USA. Copyright 2008 ACM 978-1-60558-193-4/08/08 ...$5.00.
INTRODUCTION
1 An information source can be any independent source of information, such as a blog page maintained by a particular blogger, or the bookmark page maintained by a particular del.icio.us user. 2 An item can be any potential object of interest, such as a Web page mentioned on blogs, or a hot topic or gadget being discussed on blogs.
serve that our personalized aggregation approach indeed makes a significant difference in the items that are recommended and captures the user’s interest much better than a overall aggregation service. Although such an idea can be extremely effective, one important challenge in providing personalized aggregation is the problem of scalability. Given that there are potentially millions of users who may use the system and millions of sources to get the opinions from, computing the personalized aggregation every time when a user requests incurs significant computational cost as we will see later. The main focus of this paper is to address this scalability issue. Roughly, our idea for addressing this challenge is to model the personalized aggregation problem as matrix multiplication and apply an effective matrix decomposition method to reduce the multiplication cost. As we will show, our approach for personalized aggregation reduces the computational cost significantly, often more than 75%, while the result of personalized aggregation is kept accurate enough. The rest of the paper is organized as follows. In Section 2, we formulate the personalized aggregation as the problem of weighted sum computation and present two basic methods to perform this computation. We then present a matrix representation of this problem and propose an efficient method to support personalized aggregations. In Section 3, we will describe the experiments with real dataset to show the impact of personalization and the efficiency of our proposed method. Finally, we give concluding remarks and a brief discussion of some possible future investigations in Section 5 after we briefly go over related work in Section 4.
2. FRAMEWORK In this paper, we assume that we want to compute personalized recommendations for n users (U = {u1 , u2 , . . . , un }) by aggregating opinions from m different individual bloggers (B = {b1 , b2 , . . . , bm }). While our method is general enough, we focus on blogs to make our discussion more concrete. It is straightforward to apply our framework to other application domain. We assume that each user ui has expressed his level of “trust” on each blogger bj as the trust score T (ui , bj ). We refer to the set of trust scores that the user ui places on bloggers b1 , . . . , bm T~i = hT (ui , b1 ), T (ui , b2 ), . . . , T (ui , bm )i as the trust vector of ui . These trust scores may be provided explicitly by the users (e.g., users may subscribe to a list of blog RSS feeds, indicating their interest and/or trust in those blogs) or the trust scores may be estimated by analyzing the past behavior of the users (e.g., by monitoring how frequently a user reads articles from each blog). We assume that there are l items of interest (O = {o1 , o2 , . . . , ol }) that bloggers mention and that can potentially be recommend to the users. The exact definition of an item is application dependent. For example, for a system that recommends Web pages, an item will be a Web page, and for a system that recommends electronic gadgets, an item will be an electronic gadget that is mentioned on the blogs. Whenever a blogger bj mentions an item ok on his blog and expresses his opinion, we assume that he provides a certain degree of “endorsement” for ok , represented as the endorsement score E(bj , ok ). For example, when a blogger bj includes a link to the Web page ok in one of his articles, we may assume that bj is giving the endorsement score 1 for ok . The set of all endorsement scores for the item ok by the bloggers b1 , . . . , bm ~ k = hE(b1 , ok ), E(b2 , ok ), . . . , E(bm , ok )i E is referred to as the endorsement vector of the item ok .
Under this notation, our problem of computing personalized aggregate recommendation can be stated as follows: P ROBLEM 1 For each user ui and each item ok , we want to compute the personalized endorsement score R(ui , ok ) R(ui , ok ) =
m X
T (ui , bj )E(bj , ok ),
(1)
j=1
and return items with the highest personalized scores to the user. Equation 1 can be restated using the following vector notation: ~k. R(ui , ok ) = T~i · E
2
In order to compute the personalized endorsement score for each user, we have to maintain the trust score T (ui , bj ) for every (ui , bj ) pair and the endorsement score E(bj , ok ) for every ok endorsed by bj . We may record these scores in the following two tables: • Trust(user_id, blog_id, score) • Endorsement (blog_id, item, score) Each tuple in the Trust table records a user’s trust score on a blogger in the score attribute. Each tuple in the Endorsement table records the endorsement score by a blogger for an item in the score attribute. Given the above two tables, computing the items with highest personalized endorsement scores for user ui can be expressed as the following SQL query Q1: Q1: SELECT t.item, sum(t.score*e.score) AS score FROM Endorsement e, Trust t WHERE e.blog_id = t.blog_id AND t.user_id = ui GROUP BY t.item ORDER BY score DESC LIMIT 20
Here, we assumed that we want to return the top-20 items, using the syntax ORDER BY score DESC LIMIT 20, for the user ui .
2.1
OTF and VIEW
One simple way of returning the items with the top personalized endorsement scores is to compute the answer for the query Q1 on-the-fly when the user wants personalized recommendation. This approach is illustrated in Figure 1(a) and is referred to as OTF (short for on-the-fly). Under OTF, we maintain one global Endorsement table, where a new tuple is inserted (or an existing tuple is updated) whenever a blogger posts a new article and provides an endorsement for an item. Using this global Endorsement table, we then execute Q1 by joining the table with a user’s trust scores in the Trust table when the user asks for recommendation. Unfortunately, repeatedly executing Q1 for every user’s request can be prohibitively expensive. Because there are millions of bloggers who keep posting new articles (and thus providing new endorsements), and a user may trust a large number of bloggers and have many non-zero entries in his trust vector, the join in Q1 may involve millions of tuples, which will be too expensive to perform on the fly. Alternatively, to avoid this runtime query execution cost, we may proactively precompute the personalized endorsement scores for every user. That is, for each user ui , we maintain his personalized endorsement score table • PersonalizedEndorsement(item, score) as we show in Figure 1(b). Under this approach, whenever a blogger bj provides a new endorsement for the item ok , all PersonalizedEndorsement tables for the users with non-zero trust on bj are
blog 1
...
blog 2
blog n
blog 1
...
blog 2
blog 1
...
blog 2
blog n
blog n
Update
Update user, blog
blog , item
Update
Trust table
Endorsement table
item, score
item, score
item, score
...
user group 1
item, score
item, score
user group r
Personalized Endorsement
Query
Query
Query
...
... user 1
user 2
user m
user 1
(a) OTF
user 2
... user m
user 1
user 2
(b) VIEW
user m
(c) NMF
Figure 1: The graphical illustration of three different methods updated to reflect this new endorsement. We refer to this approach as VIEW, since this approach maintains a materialized view of personalized endorsement scores for every user. Under this VIEW approach, a user’s personalized endorsement scores are always precomputed and are available in the user’s PersonalizedEndorsement table, so the user’s request for recommendation can be handled quickly. We simply need to look up the top-scored items from the user’s PersonalizedEndorsement table. However, maintaining the Personalized Endorsement tables will incur significant update cost, because whenever there is a new update on a blog with a large number of trusting users, all corresponding PersonalizedEndorsement tables should be updated.
2.2 Matrix representation In the previous section, we described the two baseline approaches for computing the personalized endorsement scores: OTF and VIEW. The main problem of OTF is that the query execution cost is too high due to a join between two large tables. The main problem of VIEW, on the other hand, is that the maintenance cost of the PersonalizedEndorsement tables is too high because one new endorsement may trigger updates on a large number of tables. In this section, we investigate how we can minimize both the table update cost and the query computation cost. In order to develop an approach with lower costs, we first reformulate the execution of query Q1 as a matrix multiplication problem. It is easy to see that the trust scores in the Trust table can be viewed as an (n × m) matrix T , where each entry (i, j) represents the user ui ’s trust score on the blog bj . Similarly, the endorsement scores in the Endorsement table can be viewed as an (m × l) matrix E, where each entry (j, k) represents the blogger bj ’s endorsement score for the item ok . Then from the definition of the personalized endorsement score R(ui , ok ) in Equation 1, we see that R(ui , ok ) can be computed from the matrix multiplication of T and E: P ROPOSITION 1 The personalized endorsement score of the item ok for the user ui , R(ui , ok ), is the (i, k) entry of the matrix multiplication of T and E. That is, R(ui , ok ) = (T E)(i,k) , where M(i,k) represents the (i, k) entry of the matrix M .
(2) 2
We use the following example to illustrate this matrix interpretation of the problem. E XAMPLE 1 Suppose that there are three users, four bloggers and three items. The user ui ’s trust score on the blogger bj is given in the trust matrix T in Figure 2. For example, the value of the (1,2) entry, 0.8, indicates that u1 trusts b2 with the score 0.8. Also, the blogger bj ’s endorsement for the item ok is given in the endorsement matrix E in the figure. For example, the value, 2, of the (4,2)
T u1 u2 u3
b1 .8 .2 0
b2 .8 .2 0
b3 0 .6 .5
E b1 b2 b3 b4
b4 0 .6 .5
o1 3 0 1 1
o2 2 3 0 2
o3 0 0 1 3
Figure 2: Trust matrix T and endorsement matrix E TE u1 u2 u3
o1 2.4 1.8 1
o2 4 2.2 1
o3 0 2.4 2
Figure 3: The result of the matrix multiplication T E entry, indicates that the blogger b4 endorses the item o2 with the score 2. Note that each row in the trust matrix T corresponds to the trust vector T~i of the user ui . Also each column in the endorsement ma~ k of the item ok . trix E corresponds to the endorsement vector E ~ ~ Given that R(ui , ok ) = Ti · Ek , we see that R(ui , ok ) is simply the (i, k) entry of the matrix multiplication T E. That is, computing the personalized endorsement score R(ui , ok ) is equivalent to performing the matrix multiplication of T and E. In Figure 3 we show the result of this multiplication. 2 Given this matrix formulation, OTF can be viewed as follows: We maintain separate T and E matrices as new endorsements are provided by the bloggers by updating the E matrix. Then, when the users request their personalized endorsement scores, we perform the multiplication of T and E on the fly. The cost for updating the E matrix, therefore, will be low, because a new endorsement from a blogger incurs an update to a single entry in the matrix E; when the blogger bj provides the endorsement for ok , only the (j, k) entry of the E matrix will be updated. The computation cost of the personalized endorsement scores, on the other hand, will be very high because of the high cost of the multiplication of two large matrices. The other VIEW approach can also be seen as the following matrix operations: We maintain the single matrix T E as new endorsements are provided by the bloggers by updating the appropriate entries in T E. Since all personalized scores R(ui , ok ) are precomputed in the matrix T E and are readily available, the cost for answering a user’s request for R(ui , ok ) will be low. On the other hand, the cost for maintaining the matrix T E will be high, because a single endorsement from a blogger may trigger multiple updates on a large number of entries in the T E matrix. For example, an endorsement from bj who have 1,000 trusting users will incur updates to 1,000 entries in the T E matrix. The above two extreme approaches, either precomputing the entire matrix multiplication T E or performing it lazily at the user’s request suggests exploring a possible middle ground, where we perform part of the multiplication proactively before the user’s request
and finish the rest of the multiplication on the fly. In the next section, we will see that finding this middle ground is equivalent to finding a good low-rank decomposition of the matrix T .
2.3 Matrix decomposition for efficient computation To understand how matrix decomposition can be used to find the middle ground, we consider the trust matrix T in Figure 2 of Example 1. From the trust table, we observe that even though there are three users with different trust vectors, the user u2 ’s vector T~2 is simply a linear combination of T~1 and T~3 . That is, T~2 = 0.25 T~1 + 1.2 T~3 .
(3)
~ k , we observe that R(u2 , ok ) Now, given that R(u2 , ok ) = T~2 · E can actually be computed from R(u1 , ok ) and R(u3 , ok ). That is, ~k R(u2 , ok ) = T~2 · E ~k = (0.25 T~1 + 1.2 T~3 ) · E
Here, each row of the second matrix H corresponds to the trust vector of the two “representative” users, u1 and u3 . Each row of the first matrix W then represents how each user ui ’s trust vector can be obtained from the trust vectors of the two representative users. For example, the first row of W is 1 for the first entry, indicating that u1 ’s trust vector is identical to the trust vector of the first representative user. The second row has 0.25 and 1.2 as its entries, indicating that the trust vector of u2 is the the linear combination of the trust vectors of the two representative users, weighted by 0.25 and 1.2, respectively. Given this decomposition, we see that maintaining the PersonalizedEndorsement tables for the two representative users u1 and u3 is equivalent to precomputing the multiplication of H and E. Note that each row of the HE matrix has the R(ui , ok ) scores of each of the two representative users. Then during the query time, we compute R(ui , ok ) of ui by multiplying the precomputed HE with W as follows: TE
=
~ k + 1.2T~3 · E ~k = 0.25T~1 · E =
= 0.25R(u1 , ok ) + 1.2R(u3 , ok ) This observation hints a possible modification to the VIEW approach: instead of maintaining one PersonalizedEndorsement table for every user, maintain the table only for the two “representative users,” u1 and u3 . The personalized endorsement score for u2 is then computed indirectly by combining the personalized scores for u1 and u3 . This modification to the VIEW approach has the following two merits in terms of its update and the query computation cost: 1. Update cost: The update cost for the PersonalizedEndorsement tables is significantly reduced from the VIEW approach. That is, according to the trust matrix T in Figure 2, every blogger bj is trusted by two users (i.e., for every column bj in T , there are two non-zero entries). Therefore, under the VIEW approach, a new endorsement by the blogger bj will trigger updates to two Endorsement tables. In contrast, under our modified approach, we maintain only two PersonalizedEndorsement tables for u1 and u3 . Now, because bj is trusted by only one of u1 or u3 , a new endorsement by bj will trigger just a single update to one of the two PersonalizedEndorsement tables. 2. Query computation cost: The computation cost for personalized endorsement scores of the modified approach is also significantly lower than that of OTF. Under OTF, the computation of R(ui , ok ) values involves the multiplication of T and E matrices. Under the modified approach, in contrast, R(ui , ok ) scores for the user u1 and u3 have already been precomputed. For the remaining user u2 , the computation of R(u2 , ok ) can also be done cheaply by taking the weighted sum of R(u1 , ok ) and R(u3 , ok ). In short, the query computation cost of the modified approach is significantly lower than that of OTF and is close to the cost of VIEW. Our modified approach to computing R(ui , ok ) can be viewed as the following matrix decomposition of T into W and H:
0
.8 @ .2 0
.8 .2 0
0 .6 .5
T 1
0 .6 A .5
= =
WH 0 1 @ .25 0
1 „ 0 .8 1.2 A 0 1
.8 0
0 .5
0 .5
«
=
(W H)E 0 1 @ .25 0
= W (HE) 10 „ 0 B .8 1.2 A @ 0 1
0
1 „ 0 2.4 1.2 A 1 1
1 @ .25 0
0 .5
.8 0
4 1
0 2
0 .5
«
3 B 0 @ 1 1 0
2 3 0 2
11 0 0 CC 1 AA 3
«
The main benefit of this approach comes from the fact that the number of rows in H is much smaller than the number of rows in T , so we need to maintain a much smaller number of PersonalizedEndorsement tables. More formally, we reduce both the update and the query computation cost for personalized endorsement scores by decomposing the (n × m) matrix T into (n × r) and (r × m) matrices W and H where r ≪ n and by precomputing the multiplication HE. In general, this process of matrix decomposition have the following intuitive interpretation: We first identify the representative groups of users who have similar trust vectors, so that we can precompute the personalized endorsement scores for each representative user group. Then during the query time, we compute the personalized endorsement scores of each user by combining their scores on the representative user groups. In Figure 1(c) we graphically illustrate this interpretation. Note that in the figure, note that we maintain one PersonalizedEndorsement table per user group not per every user. Since the number of user groups is much smaller than the number of users, this approach is likely to lead to significant improvement in the update and the query computation cost compared to to VIEW and OTF.
2.4
SVD and NMF
Our previous discussion shows that we can reduce the costs of multiplication by finding a way to decompose (n × m) matrix T into (n × r) matrix W and (r × m) matrix H where r ≪ min{n, m}. Since r corresponds to the number of “representative” user groups for which we maintain separate PersonalizedEndorsement tables, we would like to find a decomposition W H such that r is minimal. Unfortunately, it is known that the minimum r value for the decomposition W H is the rank of the matrix T . That is, for a matrix T whose rank is close to min{n, m}, it is not possible to obtain a decomposition W H with a low r value. Given that exact decomposition is almost impossible , we relax our goal to find the closest approximation of the trust matrix T with W H for a given r value. D ESIDERATA 1 Given the desired rank r of the matrix decompo-
sition of T , find the W and H such that W H is closest to T : T ≈ WH
2
One well-known method for low-rank matrix approximation is Singular Value Decomposition (SVD). If we use SVD to decompose matrix T into two orthogonal matrices, the decomposition is guaranteed to be the best in terms of the Forbenius norm, at any given rank approximation. Unfortunately, the decomposed matrices W and H incur significant update and query execution cost due to the high density of the the matrices; almost all entries in the W and H are non-zero, which can be interpreted that every blogger bj is trusted by every representative user group and that every user ui belongs to every representative user group to a certain extent. Therefore, an update from the blogger bj incurs updates to the PersonalizedEndorsement table of almost every user group. Also, the computation of R(ui , ok ) for the user ui , requires us to combine the scores from almost all PersonalizedEndorsement tables. This high update and query cost resulting from the SVD decomposition led us to introduce the second desiderata for the matrix decomposition: D ESIDERATA 2 Given the desired rank r of the matrix decomposition of T , find the W and H, T ≈ W H, such that matrices W and H are as sparse as possible. 2 Intuitively, by making most of the entries of W and H zero, we are trying to identify the user groups such that that each blog bj is trusted by only a small number of groups and each user ui belongs to only a small number of groups. We find that Non-negative Matrix Factorization (NMF) is one of the methods with both properties. In fact, NMF allows us to specify the desired sparsity of the resulting matrix W and H for a given rank value r. Later in Section 3, we will provide the experimental comparison between SVD and NMF, in terms of their approximation accuracy and the sparsity of the decomposed matrices. In the rest of this paper, we refer to our approach of using NMF for the matrix decomposition and the R(ui , ok ) computation as the NMF method.
2.5 Efficient computation of top-K items Once the PersonalizedEndorsement tables are precomputed for every user group using our NMF method, we can compute R(ui , ok ) for ui by combining the scores from the tables ui belongs to. In most case, as the query Q1 suggests, users are interested in a top-K items with the highest endorsement scores, not every item endorsed by bloggers. This suggests another possibility for optimization under our NMF method. Instead of computing R(ui , ok ) for every item ok , we compute R(ui , ok ) only for the items that are likely to have high scores. More specifically, from each PersonalizedEndorsement table that ui belongs to, we obtain only those items with high R(ui , ok ) scores in each table. We then compute the personalized R(ui , ok ) values only among these items and return the top-K. This way, we can further reduce the execution cost of Q1 because we read only a few tuples from each PersonalizedEndorsement table, avoiding scanning most of the tuples in the tables. In [1], Fagin et.al. proposed an algorithm, called Threshold Algorithm, suitable for this optimization. Through a careful analysis of the algorithm, the authors have shown that we can indeed compute the correct top-K items optimally, by looking at just the top few entries from each PersonalizedEndorsement table. More formally, they have shown that when the score of an item oi is computed by by a monotone aggregate function t(oi ) = t(x1 , . . . , xm ), where x1 , . . . , xm are the basis scores from which the final score is computed, we only have to read the top items with the highest x1 , . . . , xm scores until a certain threshold condition is met.
See [1] for more detailed description of the algorithm. In our later experiment section, we implement Threshold Algorithm for the top-K item computation and report the performance numbers with this optimization. Note that the optimization based on the Threshold Algorithm does not involve any approximation, because the returned top-K items are guaranteed to be the correct top-K item.
2.6
Hybrid approach
The NMF method brings advantages by approximating and decomposing a dense user-blog trust matrix into fewer number of user groups; hence, we do not need to update a large number of PersonalizedEndorsement tables or to aggregate a large number of tuples in the Endorsement table at query time. However, the user-blog trust matrix may not be dense over all users and blogs. In a real world dataset, some users may only trust a few blogs, while some blogs may only have a few followers. For this kind of users and blogs, the two baselines, OTF and VIEW, can already handle the personal aggregate query efficiently. As shown in the literature [2] (and also in the experiments afterwards), the user-blog trust matrix (also referred as the subscription matrix) is usually skewed and shows a power-law like distribution. Figure 5 shows a a subscription matrix with rows and columns as the blogs and users respectively. When the rows and columns of the matrix are ordered by the number of non-zero entries, it may be divided roughly into three regions as illustrated in Figure 4. In the figure, the region marked as “1. OTF” corresponds to the users that subscribe to just a small number of blogs. The other two regions, “2. VIEW” and “3. NMF”, correspond to the users who subscribe to a large number of blogs, where “2. VIEW” indicates the blogs with just a few subscribers and “3. NMF” indicates the blogs with many subscribers. Based on such division of users and blogs, we can apply different methods to process aggregate queries. For the region “1. OTF”, OTF is efficient enough; since the users in the region subscribes to a small number of blogs, personalized endorsement is computed from just a small number of blogs. For the other two regions, the query computation cost can be high if OTF is used, since these users subscribe to a large number of blogs. Fortunately, for the region “2. VIEW”, we can use VIEW method to pre-compute the PersonalizedEndorsement table for each user whenever there is a new endorsement from each blog; the blogs in this region are subscribed by a small number of users, so an update from a blog in this region triggers updates to just a few PersonalizedEndorsement tables. The third region “3. NMF”, however, incurs too much cost if either OTF or VIEW method is used, so we apply NMF method to this region to reduce the query computation cost. Later in Section 3, we experimentally investigate how the relative size of the three regions impacts the query and update performance of the overall system. Under such partitioning scheme, whenever new users or blogs are added, they can first be handled in region “1.OTF” and “2.VIEW” because they are assumed to have smaller number of subscriptions and subscribers respectively, for which the query cost and update cost are low. Either periodically or after the subscription data has changed from the previous version beyond a threshold, the trust matrix is repartitioned and the region “3.NMF” is recomputed again to update these changes. In this paper, we assume the trust matrix is fairly stable and will leave the study of handling dynamic subscription matrix as future work.
3.
EXPERIMENTS
In this section, we evaluate the effectiveness of the proposed NMF method. In Section 3.1, we first describe the dataset used
Blogs with more followers
2. VIEW 1. OTF 3. NMF
Users with wider specturm of interest
Figure 4: Three different regions of the user-blog trust matrix.
487,694 RSS feeds between October 2006 and July 2007 and analyzed their contents. Again, we consider that when the item oi appears in an article posted by the blogger bj , the blogger “endorses” the item. Still, an important decision that we have to make is what constitutes an item. For our experiments, we explored two possibilities – the URLs appearing on blog articles and the keywords appearing on the blog articles – but due to space limit, we report our results obtained from keywords. This choice of item may be interpreted as identifying “popular buzzwords” within the subscribed blogs for each user. To assign the endorsement score for every keyword appearing in the blog articles, we extracted only the nouns from the articles using a basic NLP part-of-speech tagger and used the standard tf.idf score of those nouns, where idf is calculated from all the blog entries published on the same day. There are other methods like n-grams technique and KL-divergence with background corpus [4] to extract key phrases from blog articles to improve the quality of recommendation, we apply the tf.idf method for simplicity and focus our work on the query optimization in this paper.
3.2 Figure 5: Subscription matrix with rows and columns ordered by the number of subscribers and subscriptions respectively. for our experiments. Then in Section 3.2, we investigate how much difference personalization makes in the recommendation quality by comparing recommended items with or without personalization. In Sections 3.3 and 3.4, we evaluate the effectiveness of the NMF method by measuring the accuracy of the NMF method in approximating the top-k popular items (Section 3.3) and by comparing the query and update cost of the NMF method to the other two baseline methods(Section 3.4). Finally in Section 3.5, we measure how different choices of parameters affect the performance of the NMF method.
3.1 Description of dataset Trust matrix We obtained the users’ trust information on the blogs, by collecting a snapshot of the user-blog subscription data from Bloglines [3]. Bloglines is a Web-based online RSS reader, where users can specify the list of RSS feeds that they are interested in, so that they can access new articles from the subscribed blogs at a single location. This subscription dataset contained 91,366 users who subscribed to 487,694 distinct RSS feeds on the Web.3 . On average, one user subscribed to 30 distinct RSS feeds, leading to a total of 2.7 million user-blog subscription pairs. Figure 5 shows the collected subscription matrix, where the users and the feeds are sorted by their number of subscriptions and subscribers, respectively. The subscription pattern follows a power-law distribution as reported in similar previous studies [2]. The matrix is indeed very sparse, with most of the subscription pairs located in the lower-right-hand corner (This may not be noticeable because of the printing issue). There were 24,340 users with more than 30 subscriptions and 10,152 blogs with more than 30 subscribers, which correspond to the box in the lower-right corner in Figure 5. This region consists of roughly 1 million subscription pairs inside. Since the Bloglines users do not indicate their level of interest over the feeds, the subscription matrix is a degenerate version of the user-blog trust matrix having values of either zero or one. Endorsement matrix In order to obtain the endorsement matrix for our experiments, we have collected all articles posted at the 3
We only consider the users with public profile.
Does personalization make a difference?
To quantitatively show how much difference personalization makes in overall recommendation, we first present the top few recommended items when they are computed globally by aggregating the endorsements from all bloggers with equal weights and when they are computed individually for each user by weighting the endorsements with each user’s trust vector. Table 1 shows the list of top 10 recommended keywords among all RSS feeds and for three sample users in the week between 2007-01-07 and 2007-01-13. This is the week when Apple Inc. announced its iphone. From this list we can see that personalizing the aggregation based on a user’s interest does make a big difference in terms of the recommendation. Globally, the announcement of iphone by Apple was indeed very popular among bloggers and showed up as one of the top-10 recommended keywords. This globally popular event, however, was essentially filtered out for the recommendations for the user 90550 and the user 91017, whose interests seem to be less technology oriented, but more towards media/entertainment (user 90550) and politics (user 91017). As another data point, we also show the same list computed in the week between 2007-04-01 and 2007-04-07. The global top keywords, again, pick up an important event close to the week (Easter holiday), while top keywords for individual users are less sensitive to the change of global trend and continue to be related to their personal interests. In order to quantitatively measure the difference of the recommended keywords among the users, we compute the following metrics. Let LG be the set of global top-20 keywords and Li be the set of top-20 keywords of the user i. Then the average overlap between the global recommendation P and the individual recommendations can be measured by n1 |LG ∩ Li | and the overlap of the recomP 2 mendations among the users can be measured by n(n−1) i6=j |Li ∩ Lj |, where n is the number of users. When we measured these overlaps, they were 1.12 and 1.13, respectively, for the top-1000 users with the largest number of subscriptions, indicating that the recommended keyword lists shared only one keywords, on average.4 We show the shared-keyword count distributions in Figure 6(a) and 6(b). As we can see, even among users with large number of subscriptions (that are likely to have overlapping interest), their personalized answers differ significantly from the global answer and also among the users themselves. 4 These numbers were even smaller for the users with fewer subscriptions.
user 91017
Original subscription matrix 60
sales iphone apple manager iraq management development software business phone
yorker iraq bush president views avenue dept troops saddam iran
easter news google sales business description york police security quality
2007-04-01 to 2007-04-07 bush angeles iraq google campaign kibbutz president premiere slashdottit entourage money photo/gus chicago ruelas plans shop zell reuters mccain actress
yorker views rock theatre critic iran paul fiction southern stage
50
Distribution of number of overlapping keywords 2.5
10
Users
SVD approximation (100 rank) 60 50
10
NMF approximation (r=100) 60 50
Counts [pairs]
Counts
200
10
5 of the pair−wise number of overlapping keywords x Distribution 10
1.5
1
0.5
50 0
0
5 10 15 Number of overlapped keywords
20
0
0
5
10
30
Users
150 100
40
20
2
250
30
Users
350 300
40
20
450 400
30 20
Table 1: Global and individual list of top keywords during the week of 2007-01-07 to 2007-01-13 and 2007-04-01 to 2007-0407. 500
40
Feeds
user 90550
Feeds
user 90439
2007-01-07 to 2007-01-13 cattle brazil beef iguazu iphone reuters chicago search iraq vegas bush argentina apple kibbutz companies video prices cathartik quarter google
Feeds
Global
15
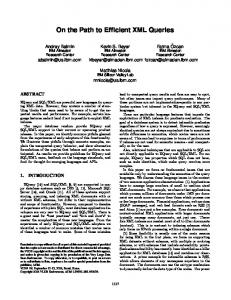
Figure 7: Visual comparison of the accuracy of subscription matrix approximation. the sub-matrices decomposed from SVD contain almost 100% nonzero entries. To make the accuracy of the approximation easier to see visually, we plot the density map of the subscription matrix (only the dense region) comparing the original subscription matrix, the SVD, and the NMF approximations in Figure 7. From the figure, we can see that both NMF and SVD leads to very close approximation of the original subscription matrix.
20
Number of overlapped keywords
Rank 80 90 100 110 120
(a) Compare with (b) Pairwise Global Figure 6: Distribution of the number of overlapping top-20 keywords among top 1000 users.
3.3 Accuracy of approximation The NMF method attempts to compute the aggregation quickly at the cost of losing the accuracy of the aggregation. In this section, we investigate accuracy of the approximated result computed by the NMF method. We first compare NMF with SVD on how close they can approximate the original matrix when both are approximated to the same rank.5 Since NMF does not necessarily produce orthogonal matrices as the output, when SVD approximation is done to rank-r, we choose n × r and r × m to be the size of W and H from NMF, for a fair comparison with r rank SVD approximation. In Table 2, we report the accuracy of these two methods. The first column shows the rank of the approximated matrix. The second column shows the Frobenius norm of the difference between the original matrix and the SVD-approximated matrix (i.e., |T − U SV T |) and the third column shows the Frobenius norm under the NMF approximation (i.e., |T − W H|). From this result, we can see that SVD and NMF both results in roughly the same accuracy in terms of the Frobenius norm; NMF approximation is only 1% worse than that of SVD; however, NMF significantly outperforms SVD in terms of the sparsity (the percentage of non-zero entries) of the decomposed matrices. From the third column of the table, we see that NMF gives an average sparsity of 23% in W and 13% in H, while 5 SVD is proven to provide the best approximation under the Frobenius norm for a given rank.
SVD norm 848.5 841.6 835.1 829.0 823.2
NMF norm (sparsity of W, H) 856.9 (25.0%,14.4%) 850.1 (24.7%,13.6%) 844.6 (23.2%,13.3%) 837.9 (22.7%,12.9%) 833.0 (21.5%,12.7%)
Table 2: Comparison of the accuracy and sparsity between SVD and NMF at different rank approximation. In addition to measuring the accuracy in terms of subscription matrix approximation, we investigate NMF’s accuracy in terms of the top-20 recommended items to the users. To quantify this, suppose Ai and Ti are the top-k recommended items computed with and without using the NMF approximation method for the user ui . Then we measure the degree of overlap between the correct and i . When we computed this approximated recommendations, AiT∩T i overlap for the top of the top 1000 users (those with most number of subscriptions) and took the average, we observed that 70% of recommended items were shared between the two lists. In Figure 8, we show this overlap varies as we change k in the top-k. From the figure, we can see that the higher-ranked items, that are considered more important to the users, are more likely to be approximated by the NMF method. For example, the top-ranked item was recommended by the NMF method in about 90% of the cases.
3.4
Efficiency of the the NMF method
We now compare the update and query performance of NMF with two other baselines, OTF and VIEW. To compare their update performance, we assume that we monitor the blogs for one week from 2007-01-07 to 2007-01-13 and as new items appear in the blogs, we update the Endorsement table in OTF, the PersonalizedEndorsement table of users in VIEW, and the group tables in NMF. From this measurement, we see that the total number of updates for OTF, VIEW, and NMF are roughly 222K, 23.6M, and
boundary (feeds, users)
NMF approximation accruacy as a function of item rank 1 0.9 0.8
Probability
0.7 0.6 0.5 0.4 0.3 0.2 0.1 0 0
5
10
15
std 3.60s 0.53s
> > > > >
30, > 30, > 30, > 30, > 30, >
25 30 35 40 45
10, 152 × 28, 236 10, 152 × 24, 340 10, 152 × 21, 182 10, 152 × 18, 600 10, 152 × 16, 392
1,070,130 (0.37%) 1,004,908 (0.41%) 944,385 (0.44%) 885,581 (0.47%) 834,423 (0.50%)
> > > > >
25, > 30, > 35, > 40, > 45, >
30 30 30 30 30
12, 470 × 24, 340 10.152 × 24, 340 8, 514 × 24, 340 7, 275 × 24, 340 6, 315 × 24, 340
1,060,292 (0.35%) 1,004,908 (0.41%) 958,789 (0.46%) 918,483 (0.52%) 883,324 (0.57%)
Table 4: Characteristics of different sizes of NMF region.
Figure 8: Approximation accuracy as a function of rank avg 2.05s 0.46s
# subscription pairs (sparsity)
20
Rank
Method OTF NMF
size (m × n)
max 84.42s 2.84s
min 0.037s 0.007s
the higher is the update cost because less feeds are benefited from the NMF method to reduce number of updates. This relationship suggests us to include less users but more feeds to be approximated by the NMF if update cost minimization is the desirable objective.
Table 3: Statistics of time taken by OTF and NMF (among the top 1000 users)
7
3
x 10
Relationship between update cost and choice of NMF region fixed users>30, varying feeds fixed feeds>30, varying users
3.2M, respectively, for the region where NMF approximation is applied. That is, while the update cost of NMF is higher than OTF, NMF still reduces the update cost by an order of magnitude compared to VIEW. In Table 3, we report the query response time of OTF and NMF for top-1000 users (with a large number of subscriptions). We do not report the result from VIEW here, because answering a query under VIEW is a simple table lookup. The response time of OTF is measured by running the Q1 in Section 2 on MySQL and that of NMF is measured by a python implementation of the NMF and Threshold Algorithm interfacing a MySQL 5.0.27 server (with 600MB main memory as index key cache) running on a AMD Dual Core Fedora machine with database files residing on a RAID disk. On average, the OTF method spends to answer a query 2.05s, while the NMF method spends 0.46s. From the table, we observe that the reduction in the query response time is even more significant when we compare the maximum response time; NMF reduces the maximum from 84.42s to 2.84s and allows that all users get results within a reasonable amount of time in an interactive setting. In summary, we can see the NMF method is a middle ground between OTF and VIEW by trading more update cost for a faster query response time.
3.5 Sensitivity analysis of NMF region size We have previously studied on an arbitrary choice (users with >30 subscriptions and feeds with >30 subscribers) of the dense subscription region to apply the NMF method. In this experiment, we empirically try different sizes of the NMF region and study its impact on the query cost, update cost, and approximation accuracy. Table 4 shows the size and sparsity of the NMF region under different choices of boundary. For each of these settings, we apply NMF with the same parameter r = 100. Figure 9 shows how the update cost (as the number of SQL update statements used to process one week of data) changes with the size of the NMF region. We observe that changing the NMF region size along the users and feeds dimension has opposite effect on the update cost. The blue solid line shows that when fewer users are included in the NMF region (i.e. more users are handled by the OTF method), the lower is the update cost because users handled by the OTF method do not require their PersonalizedEndorsement table to be maintained; hence, results in lowering the update cost. The red dashed line shows that when fewer feeds are included in the NMF region (i.e. more feeds are handled by the VIEW method),
Total Number of updates
2.9
2.8
2.7
2.6
2.5
2.4
>25
>30
>35
>40
>45
Threshold
Figure 9: The impact of NMF region size on update cost. Next, we examine the impact of the size of NMF region on the query efficiency and accuracy of approximation. Since our evaluation focus on the set of users with large number of subscriptions, changing the NMF boundary along the user dimension will not affect the group of users evaluated, so, we investigate only the change along the feed dimension that determines the proportion of feeds to be handled by VIEW and NMF method. Figure 10 shows the average approximation accuracy (with ±1 standard deviation) of the top 1000 users under different sizes of the NMF region. We observe that when fewer feeds are being approximated by the NMF method, the higher is the approximation accuracy because more feeds are now handled by the VIEW method without any approximation. Other than this, we also observe that the query response time remains similar regardless of the NMF region size. This can be explained by the fact that the Threshold Algorithm is combining from similar number of ordered lists because sparsity of the factorized matrices are similar when we use the same r parameter for different NMF region size. Based on the above observation, when we want to best leverage the advantage brought by the NMF method, we should aim at including fewer users but more feeds in the NMF region, so that we can reduces the update cost, while still giving good approximation accuracy.
4.
RELATED WORK
Our work span over several areas such as Web data mining, personalization and query optimization, the related literature roughly fall into the three categories: 1) Web mining for trends, 2) Web personalization and collaborative filtering, and 3) OLAP and query optimization of aggregates and ranking operations. Blogging activates have brought to the Web a huge amount of user-generated content. There have been research efforts [4, 5, 6,
Effect of NMF region size on approximation accuracy 1
Approximation accuracy
0.9
0.8
0.7
0.6
and effectiveness of our proposed solution. In particular, the NMF method is able to cut the query response time by 75% at the expense of paying reasonable amount of update cost, while maintaining an approximation accuracy of roughly 70%. Some interesting future directions include the investigating the optimal choice of the number of users and blogs to be included in the NMF approximation, the effect of matrix sparsity on query efficiency, and the application of NMF method in a distributed computing environment.
0.5
Acknowledgement
Approximation accuracy 0.4
>25
>30
>35 Feeds threshold
>40
>45
Figure 10: The impact of different size of NMF region on approximation accuracy. 7] on mining Web data for trends and information retrieval specific on blog data. For example, Gruhl et.al. [5] describes several techniques to find representative keywords and phrases (memes) that corresponds to discussion topics in the blogosphere and presents methods to trace the spreading of information among blogs. Wang et.al [7] has proposed method to correlate similar trends from multiple sources. The majority of the prior work on Web mining focus on finding a set of global trend by aggregating large number of sources; while our work further extend this idea to provide more personalization to improve user experience. There are significant amount of work on Web personalization and collaborative ranging from fast learning of accurate user profiles [8], personalized recommendation through collaborative filtering [9], and optimization of complex systems [10, 11]. Recently, Das et.al. [11] describe how Google News provides personalized news feed items. It addresses on the implementation of PLSI and EM algorithm using the map-reduce programming paradigm and user profile management within the Google cluster. We see there will be an interesting investigation to apply our method in a distributed environment to further improve the efficiency. Optimization of aggregation and ranking query have long been studied in the database community, especially in the OLAP context. Recently, Li et.al. [12] have introduced an extension to the SQL semantics to support custom clustering method using "group by" and to support general ranking function using "order by". Qu and Labrinids [13] describes how to optimize the scheduling process of a streaming database engine to accommodate different user preferences on freshness and accuracy of results. While some other previous work [14, 15, 16] on efficient aggregate query processing may differ from application domains and assumptions, we share the same line of thoughts to improve query processing through approximation and reusing partially computed results among queries. Our work benefits from two existing prior arts: 1)the core technique, Non-negative Matrix Factorization, had been applied by machine learning researchers in various application domains such as pattern recognition [17], computer vision [18] and clustering [19, 20]. 2) The Threshold Algorithm is an efficient method proposed by Fagin et.al. [1] to rank objects by merging from multiple sorted attribute lists.
5. CONCLUSION In this paper, we formalized the problem of personalized aggregation. We presented two baseline approaches and discussed their limitations. We then present a matrix representation of the problem and proposed a method that uses Non-negative Matrix Factorization and Threshold Algorithm to speed up the query processing and reduce the update cost. We showed, using experiments on real-life blog dataset, the significance of personalized aggregation
This work is partially supported by NSF grants, IIS-0534784 and IIS-0347993. Any opinions, findings, and conclusions or recommendations expressed in this material are those of the author(s) and do not necessarily reflect the views of the funding institutions.
6.
REFERENCES
[1] Ronald Fagin, Amnon Lotem, and Moni Naor. Optimal Aggregation Algorithms for Middleware. In Symposium on PODS, 2001. [2] Akshay Java, Pranam Kolari, Tim Finin, Anupam Joshi, and Tim Oates. Feeds That Matters: A Study of Bloglines Subscriptions. In ICWSM, Boulder, Colorado, USA, March 2007. [3] Bloglines. http://www.bloglines.com. [4] Natalie S. Glance, Matthew Hurst, and Takashi Tomokiyo. BlogPulse: Automated Trend Discovery for Weblogs. In WWW Conference, 2004. [5] D. Gruhl, R. Guha, David Liben-Nowell, and A. Tomkins. Information Diffusion Through Blogspace. In WWW Conference, 2004. [6] Qiaozhu Mei, Chao Liu, Hang Su, and ChengXiang Zhai. A Probabilistic Approach to Spatiotemporal Theme Pattern Mining in Weblogs. In WWW Conference, 2006. [7] Xuanhui Wang, ChengXiang Zhai, Xiao Hu, and Richard Sproat. Mining Correlated Bursty Topic Patterns from Coordinated Text Streams. In SIGKDD Conference, 2007. [8] Feng Qiu and Junghoo Cho. Automatic Identification of User Interest For Personalized Search. In WWW Conference, 2006. [9] Seung-Taek Park and David Pennock. Applying Collaborative Filtering Techniques to Movie Search for Better Ranking and Browsing. In SIGKDD Conference, 2007. [10] Georgia Koutrika and Yannis Ioannidis. Constrained Optimalities in Query Personalization. In SIGMOD Conference, 2005. [11] Abhinandan Das, Mayur Datar, and Ashutosh Garg. Google News Personalization: Scalable Online Collaborative Filtering. In WWW Conference, May 2007. [12] Chengkai Li, Min Wang, Lipyeow Lim, Haixun Wang, and Kevin Chen-Chuan Chang. Supporting Ranking and Clustering as Generalized Order-By and Group-By. In SIGMOD Conference, 2007. [13] Huiming Qu and Alexandros Labrinidis. Preference-Aware Query and Update Scheduling in Web-databases. In ICDE Conference, 2007. [14] Shouke Qin, Weining Qian, and Aoying Zhou. Approximately Processing Multi-granularity Aggregate Queries over Data Streams. In ICDE Conference, 2006. [15] Sailesh Krishnamurthy, Chung Wu, and Michael Franklin. On-the-fly Sharing for Streamed Aggregation. In SIGMOD Conference, 2006. [16] Chengkai Li, Kevin Chen-Chuan Chang, and Ihab Ilyas. Supporting Ad-hoc Ranking Aggregates. In SIGMOD Conference, 2006. [17] Chih-Jen Lin. Projected gradient methods for non-negative matrix factorization. Neural Computation, 19(10):2756–2779, October 2007. [18] Patrik Hoyer. Non-negative Matrix Factorization with Sparseness Constraints. Journal of Machine Learning Research, 5:1457–1469, 2004. [19] Wei Xu, Xin Liu, and Yihong Gong. Document Clustering Based On Non-Negative Matrix Factorization. In SIGIR Conference, 2003. [20] Chris Ding, Tao Li, Wei Peng, and Haesun Park. Orthogonal Nonnegative Matrix Tri-factorizations for Clustering. In SIGKDD Conference, 2006.