Efficient Estimation of Parameters of the Negative Binomial Distribution V. SAVANI AND A. A. ZHIGLJAVSKY Department of Mathematics, Cardiff University, Cardiff, CF24 4AG, U.K. e-mail:
[email protected],
[email protected] (Corresponding author)
Abstract In this paper we investigate a class of moment based estimators, called power method estimators, which can be almost as efficient as maximum likelihood estimators and achieve a lower asymptotic variance than the standard zero term method and method of moments estimators. We investigate different methods of implementing the power method in practice and examine the robustness and efficiency of the power method estimators. Key Words: Negative binomial distribution; estimating parameters; maximum likelihood method; efficiency of estimators; method of moments.
1
1. The Negative Binomial Distribution 1.1. Introduction The negative binomial distribution (NBD) has appeal in the modelling of many practical applications. A large amount of literature exists, for example, on using the NBD to model: animal populations (see e.g. Anscombe (1949), Kendall (1948a)); accident proneness (see e.g. Greenwood and Yule (1920), Arbous and Kerrich (1951)) and consumer buying behaviour (see e.g. Ehrenberg (1988)). The appeal of the NBD lies in the fact that it is a simple two parameter distribution that arises in various different ways (see e.g. Anscombe (1950), Johnson, Kotz, and Kemp (1992), Chapter 5) often allowing the parameters to have a natural interpretation (see Section 1.2). Furthermore, the NBD can be implemented as a distribution within stationary processes (see e.g. Anscombe (1950), Kendall (1948b)) thereby increasing the modelling potential of the distribution. The NBD model has been extended to the process setting in Lundberg (1964) and Grandell (1997) with applications to accident proneness, sickness and insurance in mind. NBD processes have also been considered in BarndorffNielsen and Yeo (1969) and Bondesson (1992), Chapter 2. This paper concentrates on fitting the NBD model to consumer purchase occasions, which is usually a primary variable for analysis in market research. The results of this paper, however, are general and can be applied to any source of data. The mixed Poisson process with Gamma structure distribution, which we call the Gamma-Poisson process, is a stationary process that assumes that events in any time interval of any length are NBD. Ehrenberg (1988) has shown that the Gamma-Poisson process provides a simple model for describing consumer purchase occasions within a market and can be used to obtain market forecasting measures. Detecting changes in stationarity and obtaining accurate forecasting measures require efficient estimation of parameters and this is the primary aim of this paper.
2
1.2. Parameterizations The NBD is a two parameter distribution which can be defined by its mean m (m > 0) and shape parameter k (k > 0). The probabilities of the NBD(m, k) are given by µ ¶x Γ(k + x) ³ m ´−k m x = 0, 1, 2, . . . . px = P(X = x) = 1+ x!Γ(k) k m+k
(1)
The parameter pair (m, k) is statistically preferred to many other parameterizations as the ˆ maximum likelihood estimators (m ˆ M L , kˆM L ) and all natural moment based estimators (m, ˆ k) ˆ = 0, given an independent and are asymptotically uncorrelated, so that limN →∞ Cov(m, ˆ k) identically distributed (i.i.d.) NBD sample (see Anscombe (1950)). The simplest derivation of the NBD is obtained by considering a sequence of i.i.d. Bernoulli random variables, each with a probability of success p. The probability of requiring x (x ∈ {0, 1, 2, . . .}) failures before observing k (k ∈ {0, 1, 2, . . .}) successes is then given by (1), with p = k/(m + k). The NBD with parameterization (p, k) and k restricted to the positive integers is sometimes called the P`olya distribution. Alternatively, the NBD may be derived by ‘heterogenous Poisson sampling’ (see e.g. Anscombe (1950), Grandell (1997)) and it is this derivation that is commonly used in market research. Suppose that the purchase of an item in a fixed time interval is Poisson distributed with unknown mean λj for consumer j. Assume that these means λj , within the population of individuals, follow the Gamma(a, k) distribution with probability density function given by p(y) =
1 y k−1 exp(−y/a), k a Γ(k)
a > 0, k > 0,
y > 0.
Then it is straightforward to show that the number of purchases made by a random individual has a NBD distribution with probability given by (1) and a = m/k. It is this derivation of the NBD that is the basis of the Gamma-Poisson process. A very common parametrization of the NBD in market research is denoted by (b, w). Here b = 1−p0 represents the probability for a random individual to make at least one purchase (b is often termed the penetration of the brand) and w = m/b (w > 1) denotes the mean ‘purchase frequency’ per buyer. 3
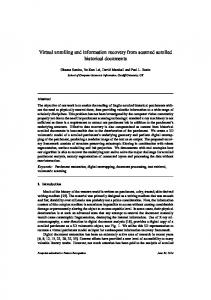
In this paper we include a slightly different parametrization, namely (b, w0 ) with w0 = 1/w. Its appeal lies in the fact that the corresponding parameter space is within the unit square (b, w0 ) ∈ [0, 1]2 , which makes it easier to make a visual comparison of different estimators for all parameter values of the NBD. Fig. 1 shows the contour levels of m, p and k within the (b, w0 )-parameter space. Note that the relationship p = 1/(1 + a) is independent of b and w0 so that the contour levels for a have the same shape as the contour levels of p. The NBD is only defined for the parameter pairs (b, w0 ) ∈ (0, 1)×(0, 1) such that w0 < −b/ log(1 − b) (shaded region in Fig. 1). The relationship w0 = −b/ log(1 − b) represents the limiting case of the distribution as k → ∞, when the NBD converges to the Poisson distribution with mean m. The NBD is not defined on the axis w0 = 0 (where m = ∞) and is degenerate on the axis b = 0 (as p0 = 1).
Figure 1: m, p and k versus (b, w0 ).
2. Maximum Likelihood Estimation Fisher (1941) and Haldane (1941) independently investigated parameter estimation for the NBD parameter pair (m, k) using maximum likelihood (ML). The ML estimator for m is simply given by the sample mean x¯, however there is no closed form solution for kˆM L (the 4
ML estimator of k) and the estimator kˆM L is defined as the solution, in z, to the equation ³
i−1 ∞ x¯ ´ X ni X 1 log 1 + = . z N j=0 z + j i=1
(2)
Here N denotes the sample size and ni denotes the observed frequency of i = 0, 1, 2, . . . within the sample. The variances of the ML estimators are the minimum possible asymptotic variances attainable in the class of all asymptotically normal estimators and therefore provide a lower bound for the moment based estimators. Fisher (1941) and Haldane (1941) independently derived expressions for the asymptotic variance of kˆM L , which is given by ³ ´ vM L = lim N V ar kˆM L = N →∞
2k(k + 1)(a + 1)2 ³ P ¡ a ¢j−1 j!Γ(k+2) ´ . a2 1 + 2 ∞ j=2 a+1 (j+1)Γ(k+j+1)
(3)
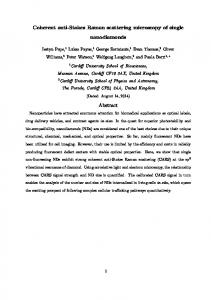
Here a = 1+m/k is the scale parameter of the gamma and NBD distributions as described in Section 1.2. Fig. 2 shows the contour levels of vM L and the asymptotic coefficient of variation √ vM L /k. The relative precision of kˆM L decreases rapidly as one approaches the boundary w0 = −b/ log(1 − b) or the axis b = 0.
(a)
Figure 2: Contour levels of (a) vM L and (b)
5
√
(b)
vM L /k.
Computing the ML estimator for k may be difficult; additionally, ML estimators are not robust with respect to violations of say the i.i.d. assumption. As an alternative, it is conventional to use moment based estimators for estimating k. These estimators were suggested and thoroughly studied in Anscombe (1950).
3. Generalized Moment Based Estimators In this section we describe a class of moment based estimation methods that can be used to estimate the parameter pair (m, k) from an i.i.d. NBD sample. Within this class of moment based estimators we show that it is theoretically possible to obtain estimators that achieve efficiency very close to that of ML estimators. In Section 4 we show how the parameter pair (m, k) can be efficiently estimated in practice. Note that if the NBD model is assumed to be true, then in practice it suffices to estimate just one of the parameter pairs (m, k), (a, k), (p, k) or (b, w) since they all have a one-toˆ with m one relationship. Since all moment based estimators (m, ˆ k), ˆ = x¯, are asymptotically uncorrelated given an i.i.d. sample, estimation in literature has mainly focused on estimating the shape parameter k. In our forthcoming paper we shall consider the problem of estimating parameters from a stationary NBD autoregressive (namely, INAR (1)) process. For such samples, it is very ˆ are much difficult to compute the ML estimator for k. Moment based estimators for (m, ˆ k) simpler than the ML estimators, although the estimators are no longer asymptotically uncorrelated. This provides additional motivation for considering moment based estimators. 3.1. Methods of Estimation The estimation of the parameters (m, k) requires the choice of two sample moments. A natural choice for the first moment is the sample mean x¯ which is both an efficient and an unbiased estimator for m. An additional moment is then required to estimate the shape P parameter k. Let us denote this moment by f¯ = N1 N i=1 f (xi ), where N denotes the sample
6
size. The estimator for k is obtained by equating the sample moment f¯ to its expected value, Ef (X), and solving the corresponding equation f¯ = Ef (X), with m replaced by m ˆ = x¯, for k. Anscombe (1950) has proved that if f (x) is any integrable convex or concave function on the non-negative integers then this equation for k will have at most one solution. In the present paper we consider three functions fj =
N 1 X fj (xi ) N i=1
for the estimation of k, with f1 (x) = x2 , f2 (x) = I[x=0] (where f2 (x) = 1 if x = 0 and f2 (x) = 0 if x 6= 0) and f3 (x) = cx with c > 0 (c 6= 1). The sample moments are f1 =
x2
N 1 X 2 x, = N i=1 i
n0 f2 = pb0 = , N
and
N 1 X xi c X c , f3 = c = N i=1
(4)
with Efj (X) given by Ef1 (X) = ak(a+1+ka),
Ef2 (X) = (a+1)−k
and
Ef3 (X) = (1+a−ac)−k .
(5)
Note that f3 is the empirical form of the factorial (or probability) generating function E[cX ]. Solving fj = Efj (X) for j = 1, 2, 3 we obtain the method of moments (MOM), zero term method (ZTM) and power method (PM) estimators of k respectively with estimators denoted by kˆM OM , kˆZT M and kˆP M (c) . No analytical solution exists for the PM and ZTM estimators and the estimator of k must be obtained numerically. Defining s2 = x2 − x¯2 , the MOM estimator is kˆM OM =
x¯2 . s2 − x¯
(6)
The PM estimator kˆP M (c) with c = 0 is equivalent to the ZTM estimator and as c → 1 the PM estimator becomes the MOM estimator. When comparing the asymptotic distribution and the asymptotic efficiency of different estimators of k it is therefore sufficient to consider only the PM method with c ∈ [0, 1], where the PM at c = 0 and c = 1 is defined to be the ZTM and MOM methods of estimation respectively.
7
3.2. Asymptotic Properties of Estimators The asymptotic distribution of the estimators can be derived by using a multivariate version of the so-called δ-method (see e.g. Serfling (1980), Chapter 3). It is well known that the P joint distribution of x¯ and the sample moments fj = N1 N i=1 f (xi ), for j = 1, 2, 3, follows a bivariate normal distribution as N → ∞. Therefore, the estimators of (m, k), (a, k), (p, k) and (b, w) also follow a bivariate normal distribution as N → ∞ (see Appendix). Note that when k is relatively large compared to m, the finite-sample distributions of the estimators are skewed and convergence to the asymptotic normal distribution is slow. The asymptotic variances of the sample moments are given by Var(¯ x) = E x¯2 − (E x¯)2 and Var(fj ) = Efj
2
− (Efj )2 , for j = 1, 2, 3. Each of the estimators (m, ˆ kˆM OM ), (m, ˆ kˆZT M )
and (m, ˆ kˆP M ), with m ˆ = x¯, asymptotically follow a bivariate normal distribution with mean ˆ = 0. For the PM we vector (m, k), limN →∞ N Var(m) ˆ = ka(a + 1) and limN →∞ N Cov(m, ˆ k) have lim N Var(kˆP M (c) ) = vP M (c) =
N →∞
−k
(1+a−ac2 ) r2k+2 −r2 −ka(a+1)(1−c)2 [r log(r) − r + 1]2
(7)
where r = 1+a−ac. The normalized variance of kˆ for the MOM and ZTM estimators are obtained by taking limc→1 vP M (c) and limc→0 vP M (c) respectively, to give ³ ´ 2k(k+1)(a+1)2 vM OM = lim N Var kˆM OM = N →∞ a2 ³ ´ (a+1)k+2 −(a+1)2 −ka(a+1) vZT M = lim N Var kˆZT M = . N →∞ [(a+1) log(a+1)−a]2
(8)
The MOM and ZTM estimators are asymptotically efficient in the following sense vM OM /vM L → 1 as k → ∞,
vZT M /vM L → 1 as k → 0.
(9)
In Savani and Zhigljavsky (2005), however, we prove that for any fixed m > 0 and k (0 < k < ∞) the PM can be more efficient than the MOM or ZTM. In fact, there always exists c˜, with 0 < c˜ < 1, such that vP M(˜ c) < min{vZT M , vM OM }. We let c∗ denote the value of c that minimizes vP M(c). Fig. 3 (a) shows the asymptotic normalized variances of the estimators for k when m = 1 and k = 1 using the ML, MOM, ZTM and PM with c ∈ [0, 1]. Note that vP M (c) is a 8
(a)
(b)
(c)
Figure 3: (a) vP M(c) versus c for m = 1 and k = 1 (ML, MOM, ZTM and PM). (b) Contour levels of c∗ . (c) Efficiency of PM at c∗ : vM L /vP M (c∗ ). continuous function in c and only has one minimum for c ∈ [0, 1]. This is true in general for all parameter values (b, w0 ). It is difficult to express c∗ analytically since the solution (with respect to c) of the equation ∂vP M(c)/∂c = 0 is intractable. The problem can, however, be solved numerically and Fig. 3 (b) shows the contour levels of c∗ within the NBD parameter space. The value of c∗ is actually a continuous function of the parameters (b, w0 ). Fig. 3 (c) shows the asymptotic normalized efficiency of the PM at c∗ with respect to ML. The PM at c∗ is almost as efficient as ML although an efficiency of 1 is only achieved in the limit as c → 1, k → ∞ and as c → 0, k → 0, see (9). A comparison with Fig. 2 (b) notably reveals that areas of high efficiency with respect to ML relate to areas of a high coefficient √ of variation ( vM L /k) for k and vice versa.
4. Implementing the Power Method In this section we consider the problems of economically implementing the PM in practice to obtain robust and efficient estimators for the NBD parameters. The first problem we investigate is that of obtaining simple approximations for the optimum value c∗ that minimizes the asymptotic normalized variance vP M (c) with respect to c, 0 ≤ c ≤ 1. 9
In practice the computation or approximation of c∗ by minimizing vP M (c; m, k) requires knowledge of the NBD parameters (m, k) and these parameters are unknown in practice. The value of c∗ must therefore be estimated from data at hand by using preliminary, possibly ˜ and minimizing v (c; m, ˜ with respect to c. The estimated inefficient, estimators (m, ˜ k) ˜ k) PM value for c∗ may then be used to obtain ‘pseudo’ efficient estimators for the NBD parameters (m, k). 4.1. Approximating Optimum c - Method 1 The simplest and most economical method of implementing the PM is to apply a natural extension of the idea implied by Anscombe (1950), where the most efficient estimator amongst the MOM and ZTM estimators of k is chosen. In essence, the value of c∗ is approximated by c ∈ {0, 1} such that vP M (c) = min {vP M (0), vP M (1)}. Alternatively, one can choose between the more efficient among a set of estimators (m, ˆ kˆP M (c) ), obtained by using the PM at c for a given set of values of c ∈ [0, 1]. If we denote this set of values of c by A, then the value of c∗ is approximated by cA such that cA = argminc∈A vP M (c; m, k) and an efficient estimator for (m, k) is obtained by using the PM at cA . Fig. 4 shows the asymptotic efficiency of the PM at cA = argminc∈A vP M (c; m, k), relative to the PM at c∗ for two different sets of A. Fig. 4 (a) confirms that in all regions of the parameter space the MOM/ZTM estimator is less efficient than the PM estimator at c∗ , except in the limits as k → 0 and k → ∞ where the efficiency is the same. Fig. 4 (b) illustrates the effect of extending the set A; it is clear that the asymptotic efficiency of the PM using cA with A = {0, 51 , 25 , 53 , 45 , 1} is more efficient than using just the MOM and ZTM estimators. 4.2. Approximating Optimum c - Method 2 We note that the value of c∗ can be obtained by numerical minimization of vP M (c; b, w0 ). Using knowledge of these numerical values over the whole parameter space, regression tech10
(b) A = {0, 15 , 52 , 35 , 45 , 1}
(a) MOM/ZTM (A = {0, 1})
Figure 4: Asymptotic efficiency vP M (c∗ )/vP M (cA ) with cA = argminc∈A vP M (c; m, k). niques can be used to obtain an approximation for c∗ . We use vP M (c) as a function of the parameter pair (b, w0 ) as these parameters provide the simplest approximations. Fig. 5 shows the asymptotic efficiency of two such regression methods relative to the PM at c∗ . The first method (a) is a simple approximation independent of w0 and the second method (b) optimizes the regression for values of w0 < 0.65. The two methods are highly efficient with respect to the PM at c∗ . 4.3. Estimating Optimum c Both methods of approximating c∗ described above require the NBD parameters (m, k) or (b, w0 ). Since these parameters are unknown in practice, the approximated value for c∗ must be estimated from the data. The estimator for this approximated value may be obtained by plugging in preliminary, possibly inefficient, estimators of the NBD parameters for the values of (m, k) or (b, w0 ). The simplest preliminary estimates for the NBD parameters are either the MOM or ZTM estimates, although any estimator obtained using the PM at any given c ∈ [0, 1] may be used. Let us denote the preliminary estimators for the NBD parameters by (m, ˜ k˜P M (c) ). 11
(a)
(b)
Figure 5: Efficiency of the PM (vP M (c∗ )/vP M (ca )) with (a) ca = 0.125 + 0.7125b, (b) ca = (4.5253w02 −1.8543w0 +0.523)b2 + (3.0743w03 −2.43w02 +0.7115w0 +0.4255)b. For Method 1, the estimator cbA for cA is computed by minimizing vP M (c; m, ˜ k˜P M (c) ) over the set A. Note that the preliminary estimators (m, ˜ k˜P M (c) ) used in the minimization of vP M (c; m, ˜ k˜P M (c) ) over the set A are fixed. It would be incorrect to calculate (m, ˆ kˆP M (c) ) for each c ∈ A and to choose the value cA that minimizes vP M (c; m, ˆ kˆP M (c) ); this is because the different values of (m, ˆ kˆP M (c) ) make the variances incomparable. For Method 2, the preliminary estimates for (m, ˜ k˜P M (c) ) can be transformed to (˜b, w˜0 ) ˜ −k˜ and w˜0 = ˜b/m, using the equations ˜b = 1 − (1 + m/ ˜ k) ˜ under the assumption that the data are NBD. The values of (˜b, w˜0 ) can then be plugged directly into the regression equations to obtain an estimator cba for ca . 4.4. Typical NBD Parameter Estimates in Market Research Fig. 6 shows typical estimates of the NBD parameters, derived by using the MOM/ZTM, when modelling consumer purchase occasions for 50 different categories and the top 50 brands within each category. The contour levels in Fig. 6(b) clearly show that NBD parameters for a significant number of categories and some large brands are inefficiently estimated by using the MOM/ZTM, thereby justifying the use of the PM at suitable c. 12
Figure 6: Typical NBD values for purchase occasions for 50 categories (+) and their top 50 brands (•) derived using the MOM/ZTM. The contour levels in (b) show the asymptotic efficiency of the MOM/ZTM method with respect to ML. Data courtesy of ACNielsen BASES. 4.5. Robustness of Implementing the Power Method In order to obtain robust and efficient NBD estimators by implementing the PM, it is important that approximating the value of c∗ leads to a negligible loss of efficiency in the estimation of k. The value of c∗ may be approximated, for example, by the approximations cA or ca discussed earlier. Fig. 7 shows the variation in the approximated value of c∗ between three different approximation methods. Fig. 7(a) shows regions of cA ∈ {0, 0.2, 0.4, 0.6, 0.8, 1} where the value of c∗ is approximated by cA = argminc∈A vP M (c; m, k). The solid lines represent the boundaries for each cA that is depicted and the dotted lines show where cA = c∗ . Fig. 7(b) and Fig. 7(c) both show contour levels of ca for the two regression methods described in Section 4.2. We have already shown that estimating k using the PM at each of the three approximations for c∗ described above can achieve an efficiency very close to one with respect to using the PM at c∗ (see Fig. 4 (b), Fig. 5(a) and Fig. 5(b)). Even with the difference in the values of approximated c∗ , all three methods are highly efficient with respect to the PM at 13
(a) Figure 7:
(a) cA with A
(b) =
{0, 15 , 25 , 35 , 54 , 1}, (b) ca
(c) =
0.125 + 0.7125b and
(c) ca = (4.5253w02 −1.8543w0 +0.523)b2 + (3.0743w03 −2.43w02 +0.7115w0 +0.4255)b. c∗ and this highlights the insensitive nature of estimating k efficiently to gradual changes in the value of c. Since both ZTM estimators for (m, k) and (b, w0 ) are asymptotically uncorrelated, the ZTM estimators are the most convenient for estimating the approximations to c∗ . Note that the PM estimators for (b, w0 ) in general are correlated. To investigate the robustness of using the ZTM estimators as preliminary estimators we consider the worst (lowest) efficiency ˆ when considering all preliminary estimators (˜b, w˜0 ) within attainable in the estimation of k, an asymptotic 95% confidence ellipse centered at the true values (b, w0 ). Let us denote the worst value of c that gives this lowest efficiency by c× then c× = argmaxcˆ∈Cˆ {vP M (ˆ c; b, w0 )}. If A = {0, 51 , 25 , 35 , 45 , 1} and we estimate cA by cbA then Cˆ is the set of all cˆ = argminc∈A {vP M (c; ˜b, w˜0 )} with P(b = ˜b, w0 = w˜0 ) ≥ 0.05. If ca is estimated by cba then Cˆ is the set of all values of cˆ such that P(b = ˜b, w0 = w˜0 ) ≥ 0.05 and (a) cˆ= 0.125 + 0.7125˜b or 2 3 2 (b) cˆ= (4.5253w˜0 −1.8543w˜0 +0.523)˜b2 + (3.0743w˜0 −2.43w˜0 +0.7115w˜0 +0.4255)˜b.
Fig. 8 shows the minimum efficiency attainable, given by vP M (c∗ , b, w0 )/vP M (c× , b, w0 ), when estimating cA or ca by using preliminary ZTM estimators for a NBD sample of sizes N = 1, 000 and N = 10, 000. The black regions show regions of efficiency< 0.97, note however that this is a minimum possible efficiency and that this minimum efficiency occurs
14
Figure 8:
(A)
(B)
(C)
(a)
(b)
(c)
vP M (c∗ , b, w0 )/vP M (c× , b, w0 ) for sample sizes of N
ures A, B and C) and N mated by (a) cA with A
= =
=
1, 000 (fig-
10, 000 (figures a, b and c) and c∗ approxi{0, 51 , 25 , 35 , 45 , 1}, (b) ca
=
0.125 + 0.7125b and
(c) ca = (4.5253w02 −1.8543w0 +0.523)b2 + (3.0743w03 −2.43w02 +0.7115w0 +0.4255)b.
Black
regions show efficiency< 0.97. for a given significance level and sample size. The methods become more robust as the sample size increases and also as the significance level decreases. Fig. 8(a) shows the robustness when estimating cA by cbA with A = {0, 51 , 52 , 35 , 54 , 1}. This method is clearly most robust when cA = c∗ . Note, that for small b close to zero and large w0 close to 0.8, where the ZTM should be efficient, the PM method when using preliminary ZTM estimators can become less robust. This is not surprising, however, since the coefficient
15
of variation for kˆ even for ML in this area is exceptionally high (see Fig. 2(b)). Fig. 8(b) and Fig. 8(c) show that the corresponding regression methods become less robust when the true parameters are close to the boundary w0 = −b/ log(1 − b). In this region of the parameter space the coefficient of variation of kˆ is exceptionally high. The possible loss of efficiency for both regression methods is clearly negligible, except for at the boundary, and both methods may therefore be implemented in practice to obtain robust and efficient estimators of the NBD distribution. 4.6. Degenerate Samples For any c ∈ [0, 1], in the implementation of the power method there is a positive probability that the estimator for k has no valid positive solution when equating the sample moment to the corresponding theoretical moment, even though the sampling distribution is NBD.
Figure 9: From left to right: Probability of obtaining a degenerate sample with sample size N = 10, 000 using (a) MOM, (b) PM (c = 0.5) and (c) ZTM. Fig. 9 shows the probability of obtaining a sample that generates an invalid estimator for k using a sample size of N = 10, 000 within the (k, w0 ) parameter space for the MOM, PM (c = 0.5) and ZTM estimators. The probability is calculated using the fact that asymptotically (N → ∞) the estimators follow a bivariate normal distribution (see Section 3.2) and that X < exp (−¯ an invalid estimator is obtained when x¯ > s2 , cc x(1 − c)) and pˆ0 < exp (−¯ x) for the MOM, PM and ZTM respectively. 16
In literature (see e.g. Anscombe (1950)) it is often assumed that, when an invalid estimator for k is obtained, the Poisson distribution may be fitted and kˆ = ∞. The probability of obtaining an invalid estimator kˆ increases as the NBD converges to the Poisson distribution and the Poisson approximation to the NBD therefore seems reasonable. If forecasting measures are sensitive to changes in the value of k then care must be taken, since an invalid estimator kˆ may be obtained even for small values of k, albeit with a small probability.
5. Simulation Study In this section we consider the results of a simulation study comprising R = 1, 000 sample runs of the NBD distribution with sample size N = 10, 000 for various parameters (m, k) with m ∈ {0.1, 0.5, 1, 5, 10} and k ∈ {0.01, 0.25, 0.5, 1, 3, 5}. The efficiency of estimators of k are investigated by comparing the coefficient of variation for the ML, MOM, PM at c∗ and ZTM estimators. The robustness of implementing the PM in practice when using preliminary ZTM estimators is investigated by showing the variation of the preliminary estimates within the (b, w0 ) parameter space. Table 1 shows the coefficient of variation κ ˆ =
√ q 1 PR √ N R i=1 (kˆi − k)2 /k = N MSE/k
for the ML, MOM, ZTM and PM at c∗ against the theoretical coefficient of variation √ ˆ = ∞ indicates that kˆi ≤ 0 or kˆi = ∞ for κ = vM L /k (see Fig. 2 (b)). A value of κ at least one sample. For all samples with κ ˆ < ∞ the PM at c∗ has a consistently lower κ ˆ than both the MOM and ZTM estimators. The largest percentage difference between the PM at c∗ and the combined MOM/ZTM method occurs when k = 1 and m = 10 when the value of κ ˆ is increased by a factor of 26% by using the MOM/ZTM method. Fig. 10 shows preliminary ZTM estimates, (˜b, w˜0 ), for different NBD parameters within the (b, w0 ) parameter space. For each parameter pair, ZTM estimates for 1, 000 different NBD samples of size N = 10, 000 are shown. When comparing the ZTM estimates in Fig. 10 (a) to values of c∗ in Fig. 3(b) it is clear that, even with the variation in the estimates (˜b, w˜0 ) for each parameter pair (b, w0 ), the variation in the corresponding estimated values of c∗ will be small in most regions of the (b, w0 )-space. The regions where c∗ is sensitive to small changes 17
(a)
(b) m = 0.1 k = 0.25
(b) m = 0.1 k = 1
(b) m = 1 k = 1
(b) m = 1 k = 5
(b) m = 5 k = 1
Figure 10:
(a) ZTM preliminary estimators for m
∈
{0.1, 0.5, 1, 5, 10} and
k ∈ {0.01, 0.25, 0.5, 1, 5} in (b, w0 )-space. (b) ZTM preliminary estimators with corresponding 95% confidence ellipse. in (b, w0 ) and the corresponding maximum possible loss of efficiency in these regions was shown in Fig. 8. The maximum possible loss of efficiency was based on a 95% confidence ellipse. Fig. 10 (b) shows examples of preliminary ZTM estimates within the corresponding theoretical 95% confidence ellipses for (b, w0 ). These pictures are typical for each of the parameter pairs considered in Fig. 10 (a).
We would like to thank the referee for the careful reading of our manuscript and valuable comments.
18
19
4.19
MLE
5.90
5.28
4.41
4.15
√ vM L /k
21.55
5.51
3.49
1.79
1.55
0.5
1
5
10
m
0.1
0.5
1
5
10
4.20
4.48
5.30
5.91
8.78
ZTM
1.60
1.83
3.52
5.53
∞
PM
4.19
4.48
5.30
5.91
8.78
PM
2.22
2.38
4.07
6.00
∞
MOM
13.74
13.75
13.86
13.70
15.21
MOM
1.86
2.36
6.30
11.21
50.40
√ vM L /k
1.59
1.77
2.66
3.56
10.05
√ vM L /k
1.80
2.41
6.63
11.88
∞
MLE
1.61
1.80
2.65
3.62
10.38
MLE
4.25
3.78
7.45
12.55
∞
ZTM
k=3
1.66
1.83
2.67
3.63
10.38
ZTM
k = 0.25
1.81
2.41
6.63
11.88
∞
PM
1.61
1.81
2.65
3.62
10.38
PM
2.07
2.67
6.82
12.07
∞
MOM
3.30
3.34
4.00
4.76
11.50
MOM
2.16
2.94
9.14
16.89
78.86
√ vM L /k
1.51
1.70
2.85
4.14
14.01
√ vM L /k
2.14
2.96
9.28
19.92
∞
MLE
1.51
1.77
2.85
4.06
15.34
MLE
7.41
5.63
10.73
22.26
∞
ZTM
k=5
1.70
1.89
2.92
4.11
15.34
ZTM
k = 0.5
2.15
2.96
9.29
20.00
∞
PM
1.53
1.78
2.86
4.07
15.34
PM
2.34
3.09
9.38
19.90
∞
MOM
2.56
2.66
3.60
4.86
16.25
MOM
least one sample.
samples of the NBD distribution with sample size N = 10, 000. A value of ∞ indicates that kˆi ≤ 0 or kˆi = ∞ for at
√ q 1 PR √ N R i=1 (kˆi − k)2 /k against vM L /k for the ML, ZTM, PM at c∗ and MOM using R = 1, 000
2.02
2.07
3.65
5.68
∞
ZTM
k=1
Table 1: Comparison of
1.58
1.81
3.51
5.52
∞
4.48
5.30
5.91
8.78
8.27
0.1
MLE
√ vM L /k
m
k = 0.01
A. Asymptotic Distribution of Estimators In this section we provide details on obtaining the asymptotic normal distributions of the estimators for the NBD parameters (m, k), (a, k), (b, w) and (b, w0 ) when using the MOM, ZTM and PM methods of estimation. The asymptotic distribution of the estimators can be derived by using a multivariate version of the so-called δ-method (see e.g. Serfling (1980), Chapter 3). Define g = (g1 , g2 ), µ = Eg and G(g) = (G1 (g), G2 (g)) and let N2 (µ∗ , Σ∗ ) denote the bivariate normal distribution with mean vector µ∗ and variance-covariance matrix Σ∗ . According to the multivariate ver√ √ sion of the δ-method, if limN →∞ N (g−µ)0 ∼ N2 (00 , Σ) then limN →∞ N (G(g)−G(µ))0 ∼ N2 (00 , DΣD0 ). Here D = [∂Gu /∂¯ gv ]u=1,2,v=1,2 is the matrix of partial derivatives of G evaluated at µ. A.1. Asymptotic Distribution of Sample Moments In the estimation of the NBD parameters the estimators for the MOM, ZTM and PM are functions of fM OM = (x, x2 )0 , fZT M = (x, pb0 )0 and fP M = (x, cbx )0 respectively. It is well known that such functions f of sample moments follow an asymptotic normal distribution (see Serfling (1980)). It is straightforward to show that each of the sample moments f0 = x =
N 1 X xi , N i=1
f 1 = x2 =
N 1 X 2 x, N i=1 i
f2 = pb0 =
n0 , N
N 1 X xi X = and f3 = cc c N i=1
have means Ef0 = m,
Ef1 (X) = ak(a+1+ka),
Ef2 (X) = (a+1)−k
20
and Ef3 (X) = (1+a−ac)−k .
The asymptotic normalized covariance matrix for fM OM , fZT M and fP M are 1 2ka+2a+1 VM OM = lim N Σ(¯x,x2 ) = ka(a+1) N →∞ 2 2 2 2 2ka+2a+1 4k a +6ka+10ka +6a +6a+1 −k ka(a+1) −ka(a+1) VZT M = lim N Σ(¯x,pb0 ) = £ ¤ N →∞ −k −k −k −ka(a+1) (a+1) 1−(a+1) −k−1 ka(a+1) ka(a+1)(c−1)(1+a−ac) VP M = lim N Σ(¯x,ccX ) = −k N →∞ ka(a+1)(c−1)(1+a−ac)−k−1 (1+a−ac2 ) −(1+a−ac)−2k A.2. Asymptotic Distribution of Estimators Since the sample moments asymptotically follow the normal distribution the MOM, ZTM and PM estimators (m, ˆ kˆM OM )0 , (m, ˆ kˆZT M )0 , (m, ˆ kˆP M )0 are asymptotically normally distributed with mean vector (m, k)0 and asymptotically normalized covariance matrix lim N Σ(m, ˆ ˆ k
N →∞
M OM
lim N Σ(m, ˆ ˆ k
N →∞
PM
)
0 = DM OM VM OM DM , OM
)
= DP M VP M DP0 M
lim N Σ(m, ˆ ˆ k
N →∞
ZT M
)
0 = DZT M VZT M DZT M
for the MOM, ZTM and PM respectively. The matrix of partial derivatives are 1 0 1 0 , DZT M = DM OM = (a+1)k+1 2ka+2a+1 1 1 − − − a2 a2 (a+1) log(a+1)−a (a+1) log(a+1)−a 1 0 , DP M = c−1 rk+1 − r log(r)−r+1 r log(r)−r+1
and
and
where r = 1 + a − ac. To find the asymptotic normal distribution of the estimators for (a, k), (b, w) and (b, w0 ) we apply the same approach. We have the relationships m ˆ a ˆ =1+ , kˆ
µ
ˆ ˆb = 1 − 1 + m kˆ
¶−kˆ ,
wˆ =
m ˆ
³ 1− 1+
21
m ˆ ˆ k
´−kˆ
1 and wˆ0 = m ˆ
Ã
µ
m ˆ 1− 1+ kˆ
¶−kˆ !
ˆ are known for the and since the asymptotic normal distributions of the estimators (m, ˆ k) MOM, ZTM and PM it is straightforward to compute the values of the asymptotic normal distribution of the estimators (a, k), (b, w) and (b, w0 ) for each of these methods.
References Anscombe, F. J. (1949). The statistical analysis of insect counts based on the negative binomial distribution. Biometrics, 5, 165–173. Anscombe, F. J. (1950). Sampling theory of the negative binomial and logarithmic series distributions. Biometrika, 37, 358–382. Arbous, A., & Kerrich, J. (1951). Accident statistics and the concept of accident proneness. Biometrics, 7, 340–432. Barndorff-Nielsen, O., & Yeo, G. (1969). Negative binomial processes. J. Appl. Probability, 6, 633–647. Bondesson, L. (1992). Generalized gamma convolutions and related classes of distributions and densities. New York: Springer-Verlag. Ehrenberg, A. (1988). Repeat-buying: Facts, theory and applications. London: Charles Griffin & Company Ltd.; New York: Oxford University Press. Fisher, R. A. (1941). The negative binomial distribution. Ann. Eugenics, 11, 182–187. Grandell, J. (1997). Mixed poisson processes. Chapman & Hall. Greenwood, M., & Yule, G. (1920). An inquiry into the nature of frequency distributions representative of multiple happenings with particular reference to the occurrence of multiple attacks of disease or of repeated accidents. J. Royal Statistical Society, 93, 255–279. Haldane, J. B. S. (1941). The fitting of binomial distributions. Ann. Eugenics, 11, 179–181. Johnson, N. L., Kotz, S., & Kemp, A. W. (1992). Univariate discrete distributions. New York: John Wiley & Sons Inc. Kendall, D. G. (1948a). On some modes of population growth leading to R. A. Fisher’s logarithmic series distribution. Biometrika, 35, 6–15. 22
Kendall, D. G. (1948b). On the generalized “birth-and-death” process. Ann. Math. Statistics, 19, 1–15. Lundberg, O. (1964). On Random Processes and their Application to Sickness and Accident Statistics. Uppsala: Almquist and Wiksells. Savani, V., & Zhigljavsky, A. A. (2005). Power method for estimating the parameters of the negative binomial distribution. (Submitted to Statistics and Prob. Letters) Serfling, R. J. (1980). Approximation theorems of mathematical statistics. New York: John Wiley & Sons Inc.
23