sensors Article
Efficient Forest Fire Detection Index for Application in Unmanned Aerial Systems (UASs) Henry Cruz *, Martina Eckert, Juan Meneses and José-Fernán Martínez Research Center on Software Technologies and Multimedia Systems for Sustainability (CITSEM), Universidad Politécnica de Madrid, Alan Turing St., Madrid 28031, Spain;
[email protected] (M.E.);
[email protected] (J.M.);
[email protected] (J.-F.M.) * Correspondence:
[email protected]; Tel.: +34-91-452-4900 (ext. 20797) Academic Editor: Ingolf Willms Received: 31 March 2016; Accepted: 13 June 2016; Published: 16 June 2016
Abstract: This article proposes a novel method for detecting forest fires, through the use of a new color index, called the Forest Fire Detection Index (FFDI), developed by the authors. The index is based on methods for vegetation classification and has been adapted to detect the tonalities of flames and smoke; the latter could be included adaptively into the Regions of Interest (RoIs) with the help of a variable factor. Multiple tests have been performed upon database imagery and present promising results: a detection precision of 96.82% has been achieved for image sizes of 960 ˆ 540 pixels at a processing time of 0.0447 seconds. This achievement would lead to a performance of 22 f/s, for smaller images, while up to 54 f/s could be reached by maintaining a similar detection precision. Additional tests have been performed on fires in their early stages, achieving a precision rate of p = 96.62%. The method could be used in real-time in Unmanned Aerial Systems (UASs), with the aim of monitoring a wider area than through fixed surveillance systems. Thus, it would result in more cost-effective outcomes than conventional systems implemented in helicopters or satellites. UASs could also reach inaccessible locations without jeopardizing people’s safety. On-going work includes implementation into a commercially available drone. Keywords: forest fire detection; color index; mobile surveillance; UAS; UAV; drone; real-time; cost-efficient
1. Introduction Current environmental conditions have recently been producing more frequent and severe wildfires, causing the destruction of sizeable forested areas every year. According to [1], in 2013, in the Sierra Nevada (USA) alone, 104,131 ha of forest were burned down, and the European Forest Fire Information System (EFFIS) [2] reports at least 176,116 ha of destroyed forests in Europe, the Middle East, and North Africa in 2014. There have also been studies proving that the fires have contributed to the rise of global temperatures and climate change [3,4]. They also indicate that fires will occur even more frequently over the next few decades [2–5]. As a consequence, there will be an incremental loss of human life, as well as damage to the economy and the environment, e.g., in biodiversity. Therefore, forest surveillance and control is an increasingly important issue, and the challenge is to find an efficient way in which to reduce forest fires. Various techniques are already in place, such as those employing active and passive sensors, which create alerts when fires occur: e.g., ionization smoke sensors, radio acoustic sensors, projected (optical) beam smoke sensors, flame detectors (for ultraviolet, infrared or visible spectrum) and others [6–9]. These sensors obtain a variety of signals, which are products of the combustion process.
Sensors 2016, 16, 893; doi:10.3390/s16060893
www.mdpi.com/journal/sensors
Sensors 2016, 16, 893
2 of 16
1.1. Video Surveillance for Forest Fire Detection The analysis of video information is an interesting and very promising option for carrying out surveillance tasks real-time. Normally installed on towers, conventional cameras can provide a continuous sequence of video frames of an alerted area. Those systems are composed of four parts: the optical sensor, a computer for image processing, the image processing software, and a communication network to transmit information [7]. To the best of our knowledge, one of the first works on fire detection based on image processing was presented by [6]. Here, a thresholding process distinguished fire from non-fire in select Regions of Interest (RoIs) to save computational costs. As this was one of the first solutions, it presented limitations in detection due to confusions in classification. Furthermore, it was designed for fixed environments. Since then, multiple proposals have been developed considering the following characteristics (amongst others): intensity changes, Gaussian combinations, background subtraction or automatic classification systems [10–13]. The techniques have been worked out both for images representing the visible spectrum as well as for those obtained in near infrared (NIR). The work presented here focuses on the detection of RoIs, which in this case are flames and smoke, based on the calculation of color indices. Therefore, the images obtained in the Red, Green and Blue (RGB) three-band space, are transformed into a grey-scale band, by a process of arithmetic operations between image components, which enhance the desired colors. This result is binarized by a thresholding process, separating the region of interest (RoI) from the rest. Color indices are frequently obtained as Vegetation Indices (VI) and are applied in machine vision tasks for agricultural automatization, especially for detections of crops and weeds [14,15]. The reason for using these methods is due to the relationship between the capacity of effective detection and minimum execution times. They permit real-time detection and evaluation and therefore the possibility of using additional data obtained from the images, for instance, the size of the fire, coordinates, extension velocity, etc., which are useful and essential for rapid reaction. The data could be represented easily as augmented reality information on mobile platforms like tablets or mobile phones, so that help could be called from the nearest place and helpers could communicate and coordinate better, by relying on identical and instantly updated information. 1.2. Aerial Forest Fire Surveillance One of the main problems of fixed surveillance systems (e.g., cameras located on towers), is their limited capacity for monitoring extensive areas. Traditionally this limitation has been tackled by employing satellite and aerial transportation systems. Drawbacks of those systems include elevated costs, as well as technological, operative and climate limitations (clouds and other atmospheric factors limit information acquisition) [16,17]. Moreover, satellite systems do not represent the best information source due to a poor spatial vs. temporal resolution [9,16,18]. In addition, monitoring via planes can be costly, and the probability of accidents rises in the case of fires [19]. A very promising alternative, due to much lower costs and risks, is the use of small Unmanned Aerial Systems (UASs), also called drones or Unmanned Aerial Vehicles (UAVs). UASs are becoming increasingly sophisticated and frequently offer autonomous control. Over the last few years, in particular, some research groups employed UASs in forest fire detection tasks and studies [9,16,19,20]. Therefore, optical as well as NIR cameras have been applied together with wireless networks for real-time or near real-time transmission [9,16,20,21]. Furthermore, all of those studies proposed the use of costly sensors, which leads to an unfavorable cost-benefit relationship that was even worse than for traditional systems [18]. Therefore, this study proposes the use of low-cost camera equipment and fast detection algorithms via a color index, specially designed for fire detection. In recent years, color indices have already been employed to distinguish cultivated areas from the rest. For example, in [15], the combination of color indices with Hough transform achieves a detection rate of 89.3% with average processing times of 4.678 ms for image sizes of 1392 ˆ 1044 pixels and also [22,23] have reported efficient vegetation
Sensors 2016, 16, 893
3 of 16
detection. Although the relation between spatial and temporal resolution will depend on each flight condition, those capacities and advantages of using color indices permit their use in UASs for forest fire detection. Furthermore, the boom in drones, for usage in professional and private sectors, cut their prices and those of related equipment continuously, so that more and more professional equipment is now available at vastly reduced prices. Moreover, due to their reduced size, these vehicles are very flexible and can reach difficult locations better than standard planes [9]. A UAS, for instance, could get quite close to a fire during its early stages, thereby sending an alarm and geo-positional information, including high-resolution imagery with 180˝ vision. Nevertheless, there remain challenges to achieve this [24], e.g., one of the newest proposals was found not to perform in real-time. 1.3. Motivation for this Work All over the world, many institutions involved in environmental protection and surveillance, citizen’s security or investigation, require fast and efficient methods to detect forest fires. In particular, there is a certain demand for surveillance of small and medium territories, affordability, as well as real-time responses (alarms) [1,2,9]. A way to meet those expenses is through the implementation of efficient and effective tools that can be used on mobile platforms such as UAVs/UASs. As such, a key motivation for this work has been to smooth the way for efficient hardware and software solutions that could be applied to forest monitoring and control and, above all, could enable relevant parties to react quickly and appropriately to a forest fire event. As a consequence, the two most important contributions of this work are: 1. 2.
The development of two new color indices, the Fire Detection Index (FDI) and Forest Fire Detection Index (FFDI), which allow for the detection of flames and smoke; The achievement of efficient processing times to facilitate real-time implementation on a mobile platform.
The rest of the article is organized as follows: Section 2 explains the process to generate the color indices FDI and FFDI for the detection of flames and smoke. Section 3 provides an overview of the complete detection process. In Section 4, the results of experiments in different environments are presented, evaluating multiple metrics for detection precision and processing times. In Section 5, a brief discussion is added. Finally, Section 6 concludes the work and outlines directions for future work. 2. Generation of the Fire Detection Indices This chapter describes the steps required to create the indices mentioned above: FDI as a general Fire Detection Index and FFDI as a more specialized index for detecting forest fires, i.e., in the environment of green colors. First, to understand the general idea of color indices, some background information is given about the classical Vegetation Index (VI), which is used to identify Excess Green colors (ExG). This index is also later integrated into FFDI. 2.1. Background Information Multiple types of color indices have been proposed during the last two decades, mainly as VIs to identify specific plants, crops or weeds in agriculture remote sensing tasks. The indices, in fact, are grayscale images, obtained by a process of simple arithmetic operations with the three color components RGB, which are used to enhance certain color tones while attenuating other unwanted ones. The results can then be easily segmented by thresholding, separating the region of interest from the rest. Woebbecke et al. presented the initial work in 1995 [25], proposing five different indices for plant classifications. Amongst them, the ExG index stands out and is attractive to this study, as it enables vegetation to be extracted from the background:
Sensors 2016, 16, 893
4 of 16
ExG “ 2g ´ r ´ b
(1)
where r, g and b represent the normalized RGB components. Since this time, many other indices have been developed and efficiently employed for segmentation, with thresholding processes based on Otsu [26] as in [14,15,23,27–29]. This work takes advantage of those experiences and results, and proposes a similar index, but one based on a different principle, which is the enhancement of colors contained in flames and smoke while attenuating the vegetation parts. 2.2. Creation of Color Indices for Forest Fire Detection The principle of the indices proposed in this work is based on that of VIs, with the difference being that, instead of green colors, the reddish tones contained in flames and smoke will be salient in the resulting grayscale image. The steps necessary to follow, during the index generation process, are described below and could be applied as a general methodology for creating other such indices, as required. The process consists of normalization and analysis of the relation between components and arithmetic operations, leading to the indices. 2.2.1. Normalization The first step is the normalization of the RGB components to achieve a better robustness against different lighting conditions. Therefore, all components are first normalized by their maximum possible value (255) and afterward by the sum of RGB, leading to the following expression: r“
R G B , g“ , b“ R`G`B R`G`B R`G`B
(2)
This process has repeatedly been described in multiple publications, such as [14,15,25,28]. 2.2.2. Relation between Color Components To find the equations for the arithmetic operations, carried out between the RGB components to enhance the desired color tones, the most important step is analyzing the relationship between the components inside the regions of interest. This means that the color tones that compose the target group to be identified have to be analyzed regarding their composition between channels so that those with a stronger influence can be enhanced and others attenuated accordingly. For example, in Equation (1) for ExG, the green component is reinforced by duplication, while red and blue are subtracted. In this way, those colors composed of more green than red and blue appear as brighter; others, containing red and blue, appear as darker gray values in the resulting ExG image. The problem tackled in this study is that of detecting areas of fire, which includes flames, smoke, and steam. Therefore, the color ranges to detect includes yellow, red and orange tones of the flames, as well as white and grayish parts of smoke and so forth. Covering a wider range, the analysis of these colors will not lead to a clear predominance of one channel, such as in green color extraction, but rather to a fixed relationship, which enables the establishment of an equation that enhances the desired areas. The analysis has been performed over 30 images obtained from the European Fire Database [30] and the Forestry Images Organization Database [31]. The images were selected considering aspects like image perspectives (similar to that obtained by a UAV) and containing a combustion of flame and smoke. In all 30 images, the RoI has been manually marked as shown in the example in Figure 1. In the RoI, all the pixels forming the flames and smoke area have been included. In some cases, border pixels have also been included where flames and vegetation are fusing together, to include the maximum amount of elements which could provide information. For the selected pixels, the histogram distributions of the three components have been analyzed, calculating the average values of each. The histograms illustrate the distribution of color intensities inside the RoI for each component; here, the x-axis represents the value between 0 and 255 and the y-axis the number of pixels found for each value. Finally, all mean values have been averaged over the
Sensors 2016, 16, 893
5 of 16
30 test images with the result that Rm > Gm and Rm > Bm . Consequently, the general relation between the normalized components can be established as follows: Sensors 2016, 16, 893
rąg ^ rąb
5 of 16(3)
Due to to this relationship, Due this relationship,the theequations equationstotoobtain obtainthe theproposed proposedcolor colorindices indices can can be be established, established, as outlined in the sections. as outlined infollowing the following sections.
Figure 1. Example histograms for color distribution in areas presenting flames and smoke. Figure 1. Example histograms for color distribution in areas presenting flames and smoke.
2.2.3. Fire Detection Index (FDI) 2.2.3. Fire Detection Index (FDI) Equation (3) shows that the colors of interest, i.e., those representing a combustion process, are Equation (3) shows that the colors of interest, i.e., those representing a combustion process, are composed of higher red channel values than blue and green. This knowledge leads to the conclusion composed of higher red channel values than blue and green. This knowledge leads to the conclusion that the way to achieve a gray scale image, which represents the desired colors with brighter values, that the way to achieve a gray scale image,giving whichmore represents with brighter would be through arithmetic operations weightthe to desired the red colors channel than to the values, rest. would be through arithmetic operations giving more weight to the red channel than rest. Therefore, as a first step, the green and blue component images are subtracted from the to redthe one: Therefore, as a first step, the green and blue component images are subtracted from the red one: A = r – b and B = r – . Afterwards, both results are added (A + B), leading to the Fire Detection Index: A = r – b and B = r – g. Afterwards, both results are added (A + B), leading to the Fire Detection Index: (4) =2 − −
“ 2r ´ parts g ´ b of the whole detection process. The flame(4) Example images are presented in the FDI Section 3, as portion is represented with much lighter values than the smoke because the reddish orange color of imagesa are presented in the Section 3, as parts the whole detection process. The flame theExample flame contains much higher amount of red values thanof the gray-white part of the smoke. portionFDI, is represented with much lighter values than the smoke because the reddish orange as it is, could be employed quite well if there was a flame present in the image. Even color quite of thesmall, flameearly contains much higher amount as of long red values than the gray-white of the smoke. stageafires could be detected, as the environment does notpart contain similar colors. FDI, as it is,most could be will employed wellnearby if therewhen was they a flame present in the image. Even quite Nevertheless, fires not be quite observed start, and from larger distances no flames will be visible—only the smoke. As a consequence, it is crucial to include the detection of the small, early stage fires could be detected, as long as the environment does not contain similar colors. grey-white areas wellwill andnot to distinguish clearly from thestart, background. Tolarger achieve this aimno Nevertheless, mostasfires be observedthem nearby when they and from distances for forested has been to cope a vegetative background, the of flames will be environments, visible—only the the FDI smoke. As a extended consequence, it iswith crucial to include the detection development of which is described in the following section. the grey-white areas as well and to distinguish them clearly from the background. To achieve this aim for forested environments, the FDI has been extended to cope with a vegetative background, the 2.2.4. Forest Fire Detection Index (FFDI) development of which is described in the following section. A twin-track approach has been followed to achieve a wider detection range that includes the 2.2.4. Fire and Detection Index (FFDI) areaForest of smoke also achieves a real discrimination from the green tones of the background. On oneA hand, the region of combustion was madetomore salient via FDI and onrange the other hand, thethe twin-track approach has been followed achieve a wider detection that includes vegetated area was attenuated, resting the ExG proposed by Woebbecke [24] and described in (1). area of smoke and also achieves a real discrimination from the green tones of the background. OnInone this way, two indices are combined, both of which are valid and able to achieve segmentations of the hand, the region of combustion was made more salient via FDI and on the other hand, the vegetated RoI, for which they were created: flame and smoke via FDI and vegetation via ExG. By subtraction, one of these indices, in this case, ExG, is validated negatively, which further enhances FDI against the green values.
Sensors 2016, 16, 893
6 of 16
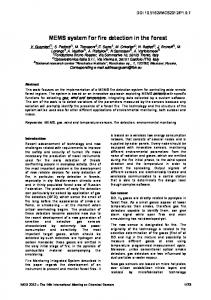
area was attenuated, resting the ExG proposed by Woebbecke [24] and described in (1). In this way, two indices are combined, both of which are valid and able to achieve segmentations of the RoI, for which they were created: flame and smoke via FDI and vegetation via ExG. By subtraction, one of these indices, this Sensorsin 2016, 16,case, 893 ExG, is validated negatively, which further enhances FDI against the green6values. of 16 Additionally, to achieve more flexibility and to give even more importance to the colors contained Additionally, to achieveweighting more flexibility and(ρ) tohas give even moreThe importance the is colors in fire and smoke, a regulative factor rho been added. resultingto index called contained in fire andIndex: smoke, a regulative weighting factor rho (ρ) has been added. The resulting index Forest Fire Detection is called Forest Fire Detection Index: FFDI “ ρ ˆ pFDIq ´ ExG (5) (5) ( )− FFDI “ ρ p2r ´ g ´ bq ´ p2g ´=r ´∗bq “ r p2ρ ` 1q ´ g pρ ` 2q ` b p1 ´ ρq (6) (6) = (2 − − ) − (2 − − ) = (2 + 1) − ( + 2) + (1 − ) Here, the parameter ρ works as follows (see also the illustration in Figure 2): for ρ = 0, the red and the parameter ρ works as follows (see also two the illustration Figure 2):=for = 0, theIf red the blueHere, colors are not altered, only green is subtracted times such in that: FFDI r ´ 2g + b. ρ = 1, blue colors are not altered, onlyout, green is subtracted two are times such that: FFDI =and r − subtracted, 2g + b. If theand bluethe channel is completely cancelled while red and green equally weighted 1, the blue or channel is components completely cancelled out, while red greenThis are leads equally such =that equal similar would counteract eachand other. toweighted FFDI = 3rand ´ 3g. subtracted, such that equal or similar components would counteract each other. This leads toare A further increase of ρ causes an even higher ponderation of red, while the other two channels FFDI = 3r − 3g. A further of ρ in causes higher weighted negatively. e.g., ρincrease = 2 results FFDIan = even 5r ´ 4g ´ b. ponderation of red, while the other two channels are weighted negatively. e.g., = 2 results in FFDI = 5r − 4g − b. 5
weight of color component
4 3 2 1 0 -1 -2 -3 -4
0
0.2
0.4
0.6
0.8
1
1.2
1.4
1.6
1.8
2
rho
Figure in the the Forest Forest Fire Fire Detection Detection Index Index(FFDI). (FFDI). Figure2.2.Influence Influence of of ρρon onthe theweighting weighting of of each each color color channel channel in
This means thatlower lowervalues valuesof ofρρenhance enhance colors colors with to to thethe This means that with aa high highamount amountofofred redcompared compared other channels, i.e., reddish tones. Bigger values of ρ between 0 and 1 (0 < ρ ≤ 1) cause an enhancement other channels, i.e., reddish tones. Bigger values of ρ between 0 and 1 (0 < ρ ď 1) cause an enhancement of the yellow brown tonalities, which are around theones red because ones because thechannel blue channel is of the yellow andand brown tonalities, which are around the red the blue is canceled canceled out. With a further increase of ρ, up to two brighter colors (bright yellow in the center of the out. With a further increase of ρ, up to two brighter colors (bright yellow in the center of the flame) flame) and whiter or grayer ones (smoke) will be detected because they are composed of almost equal and whiter or grayer ones (smoke) will be detected because they are composed of almost equal RGB RGB values. For better distinguishing them, it is necessary to increase the red component. values. For better distinguishing them, it is necessary to increase the red component. Table 1 shows an analysis of some color samples extracted from the areas of flame and smoke. Table 1 shows an analysis of some color samples extracted from the areas of flame and smoke. Here, the RGB values can be examined and compared with their normalized values. In addition, ExG Here, the RGB values can be examined and compared with their normalized values. In addition, and FDI have been calculated as well as FFDI for different values of ρ. Afterward, the threshold for ExG and FDI have calculated well as FFDI for different values of ρ. Afterward, thresholdinfor binarization (seebeen Equation (8)) as which was calculated for each image and will bethe explained binarization (seebeen Equation (8)) was calculated for each andinto willdetected be explained in=Section Section 3, has applied towhich show which samples would be image converted ones (1 white) 3, hasorbeen applied to show which samples would be converted into detected ones (1 = white) or not not detected ones (0 = black). As can be seen, the most reddish tones are always detected, the larger detected (0 = black). As cancolors be seen, most reddish tones arered always detected, the larger the the ρ, ones the more surrounding are the “caught”, but only if the component predominates, ρ, the more surrounding colors are “caught”, but For onlyρ if= 2, thebrown red component predominates, compare, compare, e.g., brown gray, gray and bright gray. gray and bright gray are detected, e.g., brown gray, gray and bright gray. For ρ = 2, brown gray and bright gray are detected, but the but the “normal” gray not, as RGB are too similar. The method does not capture very light gray values “normal” as blue, RGB such are too similar. doesonly not in capture very light gray values or but those or thosegray withnot, more that smokeThe willmethod be detected the surroundings of the flames, neither the sky insmoke an arousing fire that stillonly has in nothe flame. with morein blue, suchnor that will be detected surroundings of the flames, but neither in of FDI the sky The nor differences in an arousing fireand thatFFDI still can has be noobserved flame. in Figure 3. Image (e) shows the FFDI with a much more precise result than FDI in the picture (c). Image (d) shows ExG (e) with the green areaswith in a a The differences of FDI and FFDI can be observed in Figure 3. Image shows the FFDI wide dynamic range. Thethan following describes the complete detection process FFDI much more precise result FDI inchapter the picture (c). Image (d) shows ExG with thewhere greenthe areas in a outcome passes through a thresholding processed to obtain a final binary segmentation.
Sensors 2016, 16, 893
7 of 16
wide dynamic range. The following chapter describes the complete detection process where the FFDI outcome passes through a thresholding processed to obtain a final binary segmentation. Sensors 2016, 16, 893
ρ R G B
R
r g b
G
ExG
g
FDI
b
B r
Table 1. Color component analysis for flame and smoke regions.
Bright Orangeanalysis Red for flame and smoke Dark regions. Brown Bright Table 1. Color component Grey Yellow Orange Brown Grey Grey Grey Brown Brown Yellow Bright Orange Red Dark Brown Bright Blue 244 244 252 205 189 114 134 154 Grey 186 232 Yellow Orange Brown ρ Yellow 203 Brown Brown Grey Grey 221 170 93 34 67 115 137 178 Grey 211 Grey 157244 71244 46252 47205 21189 51 92 111 114 134 154 186159 232 204 199 221 203 170 67 115 137 1780.36 211 0.36 207 0.39 0.47 0.54 0.5993 0.7734 0.49 0.39 0.38 0.36 0.3971 0.3646 0.2747 0.1421 0.29 0.34 0.34 157 51 92 111 1590.34 204 0.33 245 0.25 0.14 0.10 0.14 0.09 0.22 0.27 0.28 0.39 0.47 0.54 0.59 0.77 0.49 0.39 0.38 0.360.30 0.36 0.32 0.31 0.07 0.36 0.25 0.18
0.18 0.39 0.14 0.41
0.09 0.36 0.10 0.62
´0.19 0.27 0.14 0.78
´0.58 0.14 0.09 1.32
´0.13 0.29 0.22 0.47
0.07 0.18 0 ´0.07 ´0.18 0.18 0.41 FFDI FDI 0.5 0.02 0.03 FFDI FFDI 1 0 0.11 0.24 −0.07 −0.18 FFDI FFDI 2 0.5 0.29 0.65 0.02 0.03 Binarization with TFFD = 0.158 FFDI 1 0.11 0.24
0.09 ´0.09 0.62 0.22 0.53 −0.09 1.14 0.22
−0.19 0.19 0.78 0.58 0.97 0.19 1.76 0.58
−0.58 0.58 1.32 1.24 1.91 0.58 3.23 1.24
−0.13 0.13 0.47 0.37 0.61 0.13 1.08 0.37
0.01 ´0.01 0.18 0.08 0.17 −0.01 0.35 0.08
0.53 01.14 1 10 1 1 1 1
0.97 11.76 1 1 1 1 1 1 1
1.91 13.23 1 11 1 1 1 1
0.61 11.08 1 11 1 1 1 1
FFDI ExG
3.
7 of 16
FFDI 0 2 BIN IMG 00.29 00.65 BIN IMG 0.5 with TFFD 1 1 Binarization = 0.158 BIN IMG 1 0 1 0 BIN IMG 1 0 BIN IMG 2 1 1 BIN IMG 0.5 1 1 BIN IMG 1 1 1 BIN IMG Process 2 1 1 Detection
0.01 0.34 0.27 0.18
Blue Grey 199 207 245 0.31 0.32 0.38
0.02 0.34
0.340.02 0.33´0.020.32 ´0.05
0.28 0.15 0.02 ´0.02 0.15 0.05 0.13 −0.02 0.28 0.05
0.300.07 0.32 0.08 0.38 ´0.08 0.02 ´0.02 −0.020.02−0.05 0.05 0.07 0.01 0.08 0.06−0.08 0.00 0.05 0.02 0.10 0.05 ´0.04 −0.02 0.11 0.06 0.17 0.00 ´0.12 0.01
0.17
0.13
0.05
0.10
0.35 0 1 10 1 1
0.28 0 1 01 1 1
0.11 0 1 0 1 1 1
0.17 1 −0.12 1 1 1 1 1 1 1
1
1
1
1
0
1
1
1
1
0
−0.04
1 1 0 0
The entire process 3. Detection Processof detection is composed of the following steps: 1. 2. 3. 4. 5. 6.
Image (individual images or consecutive videosteps: frames) Theacquisition entire process of detection is composed of the following Extraction of color components R, G and B 1. Image acquisition (individual images or consecutive video frames) Normalization color components 2. Extraction ofof color components R, Gleading and B to r, g and b 3. Normalization of colorindices components to r, and b Calculation of detection FDI leading followed byg FFDI 4. Calculation of detection indices FDI followed by FFDI Binarization through application of TFFD (Forest Fire Detection Threshold) 5. Binarization through application of TFFD (Forest Fire Detection Threshold) Labelling of segmented regions 6.
Labelling of segmented regions
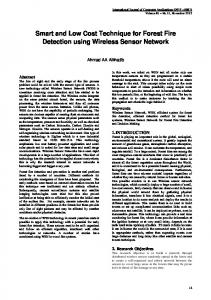
Examples of intermediate results obtained in this process are shown in Figure 3. Examples of intermediate results obtained in this process are shown in Figure 3.
Figure 3. Diagram showing the forest fire detection process with color indices. Calculation of: (a) r
Figure 3. Diagram showing the forest fire detection process with color indices. Calculation of: minus b; (b) r minus g; (c) FDI (Fire Detection Index); (d) ExG (Excess Green colors) and (e) FFDI; (f) (a) r minus b; (b) r minus g; (c) FDI (Fire Detection Index); (d) ExG (Excess Green colors) and (e) FFDI; binarization; (g) detected fire region. The original image in this figure was taken from [32]. (f) binarization; (g) detected fire region. The original image in this figure was taken from [32].
Sensors 2016, 16, 893
8 of 16
For a robust and precise detection of the RoI, the binarization of the formerly obtained index is crucial. In this step, the colors sought, which are presented in the FFDI image as elevated gray values, have to be separated from the rest (background). In many other studies, this step has been successfully resolved with help from the Otsu method [29]. Here, the same method has been employed to create the Forest Fire Detection Threshold TFFD by averaging the standard deviations of FDI and ExG: TFFD “
σFDI ` σExG 2
(7)
After applying the FFDI to the original image, all pixels values greater than or equal to the TFFD threshold are labeled with “1”(white) and the rest with “0” (black). Therefore, the final image shows the RoIs as white areas as can be seen in Figure 3f: # g px, yq “
1 if FFDI ě TFFD 0 if FFDI ă TFFD
(8)
For better visualization of the results, the detected regions have been outlined with black borders in the original images, as shown in the example in Figure 3g. 4. Evaluation In this chapter, different evaluative tests are presented. In the first section, the influence of factor ρ is analyzed according to the precision of detection of flame and smoke. In the next two sections, the algorithm’s performance is assessed over forested areas: from huge distances to test the areal perspective (UAS’s view) and from short distances to test a nearby view of initiating combustion processes. The last section describes results from images obtained in environments other than fire, to show the versatility of the algorithm. In all tests, detection precision has been compared with processing times to determine the usefulness for real-time implementation in UASs. The digital treatment of the images was carried out with MATLAB® , running on an Intel Core
[email protected] GHz, 8 GB RAM computer (GBT Inc., City of Industry, CA, USA). For the tests, different image content, views and formats have been compared. 4.1. Influence of Factor ρ in the Detection of Flame and Smoke As formerly presented in Section 2.2.4, the FFDI has been designed with the help of a factor ρ which regulates the strength of FDI against ExG to distinguish more or less the quantity of the smoke area, surrounding the flame, from the forested background. This factor emerged during the first trials and had been shown to be a useful complement to the algorithm for different applications or requirements. Analyzing the effect of ρ in the range 0 < ρ < 1, the following can be said: ρ = 0 does not apply as it would mean an exclusive application of the negative ExG index. When incrementing ρ, a minimum value has to be reached first. It should be different for every image due to color saturations and lighting conditions to detect the flame reliably; this value is called ρmin . A further increase includes more and more white and gray colors (that contain red tonalities) because green and blue are further subtracted, which explains the increase of the detected smoke area (see Figure 4). Finally, a maximum ρ is reached (ρmax ), which establishes the best possible detection of flame plus smoke. A further enhancement would not change the result. Figure 4 shows how the detected area grows with an increment of ρ from ρmin = 0.1 (flame without smoke) to ρmax = 1.5 (flame and full area of smoke). According to Equation (6), ρ = 1.5 results in FFDI = 4r ´ 3.5g ´ 0.5b, a further enhancement would put more and more weight on red values, but would not lead to differences in the segmentation result. As can be seen in the furthest right images,
Sensors 2016, 16, 893
9 of 16
nearly the entire smoke area has been detected, with only a few dark areas missed and the distinction from background is quite precise. Sensorsthe 2016, 16, 893 9 of 16
Figure of flame flame and and surrounding surrounding smoke. smoke. Figure 4. 4. Influence Influence of of ρ ρ in in detection detection of
4.2. Aerial Large Distance Distance Evaluation Evaluation 4.2. Aerial Perspective Perspective and and Large Multiple tests testswere wereundertaken undertakenon ondatabase databaseimages images evaluate goal of this paper using Multiple toto evaluate thethe keykey goal of this paper using the the proposed method to detect forest fires via UASs. A total of 50 images were selected from the proposed method to detect forest fires via UASs. A total of 50 images were selected from the European European Fire [30] Database [30] and theImages Forestry Images Organization [31] in jpeg format and Fire Database and the Forestry Organization Database Database [31] in jpeg format and different different sizes near to but not exceeding 1920 × 1080 pixels. All are shot from various aerial sizes near to but not exceeding 1920 ˆ 1080 pixels. All are shot from various aerial perspectives and perspectives andformat angles. Size correspond and formattowould correspond to those of video frames obtained by angles. Size and would those of video frames obtained by commercially available commercially available drones (e.g., Parrot France), such that thewould evaluation drones (e.g., Bebop Parrot, Parrot SA,Bebop Paris,Parrot, France), such SA, thatParis, the evaluation conditions be as conditions would be as close to reality as possible. close to reality as possible. For the the analysis analysis of of the the performance performance and and processing processing time, time, all be resized resized to to For all images images had had to to be 1920 × 1080 pixels. Afterwards, all images were resized to: 2/3: (1280 × 720), 1/2: (960 × 540), 1/4: 1920 ˆ 1080 pixels. Afterwards, all images were resized to: 2/3: (1280 ˆ 720), 1/2: (960 ˆ 540), (480 ×(480 270) 135) ˆ using Matlab function “imresize”. 1/4: ˆand 270)1/8: and(240 1/8:× (240 135)the using the Matlab function “imresize”. The detection accuracy was evaluated with the help of a confusion matrix, i.e.,i.e., by comparing the The detection accuracy was evaluated with the help of a confusion matrix, by comparing segmentation results with a ground, truth segmentation, following the methodology of pattern the segmentation results with a ground, truth segmentation, following the methodology of pattern comparison and andprecision precision analysis. Therefore, Positives (TP),Negatives True Negatives (TN), False comparison analysis. Therefore, TrueTrue Positives (TP), True (TN), False Positives Positives (FP) and False Negatives (FN) areTP counted. TP are correctly detected pixels, i.e., those (FP) and False Negatives (FN) are counted. are correctly detected pixels, i.e., those assigned to assigned to areas containing only a flame or flame and smoke. TN are pixels correctly assigned to the the areas containing only a flame or flame and smoke. TN are pixels correctly assigned to the rest of rest of the image. Consequently, FN which are pixels which are notassigned correctly(FP assigned false fire image. Consequently, FP and FNFP areand pixels are not correctly = false(FP fire=detection, detection, = falsedetection). non-fire detection). Figurevisually 5 showshow visually how the detected are compared FN = false FN non-fire Figure 5 shows the detected areas are areas compared with the with the ground truth image classified for the statistical measures. ground truth image classified for the statistical measures. The ground groundtruth truthsegmentations segmentations have been obtained by roughly segmenting the areas the The have been obtained by roughly segmenting the areas of the of flame flame manually. Here, the smoke has not been considered, as it is too difficult to distinguish its limits manually. Here, the smoke has not been considered, as it is too difficult to distinguish its limits and and because the method works for smoke colors a certain amount of red, such whiter because the method works onlyonly for smoke colors withwith a certain amount of red, such thatthat whiter or or bluer tones cannot be detected. a consequence, the have tests been haveperformed been performed ρmin bluer tones cannot be detected. As aAs consequence, the tests only foronly ρminfor which which is at aimed at detecting only the In flame. In Figure 6, a selection of segmentation is shown is aimed detecting only the flame. Figure 6, a selection of segmentation results results is shown for the for the image size of 1920 × 1080 pixels and ρ min = 1. image size of 1920 ˆ 1080 pixels and ρ = 1. min
Sensors 2016, 16, 893 Sensors 2016, 16, 893 Sensors 2016, 16, 893
10 of 16 10 of 16 10 of 16
Figure Illustration of of classification classification of segmented regions. In (a)Inoriginal image;image; (b) Figure 5. 5.Illustration ofthe theresulting resulting segmented regions. (a) original Figure 5. Illustration of classification of the resulting segmented regions. In (a) original image; (b) ground truth; (c) detection byby FFDI; (d)(d) comparison result. (b)ground groundtruth; truth;(c) (c) detection FFDI; comparison result. detection by FFDI; (d) comparison result.
Figure 6. Examples for forest fire detections from aerial perspective Figure 6. Examples for forest fire detections from aerial perspective Figure 6. Examples for forest fire detections from aerial perspective.
For quality evaluation, the following five commonly used metrics based on statistical tests of TP, For quality evaluation, the following five commonly used metrics based on statistical tests of TP, FP,For TNquality and FN were calculated: Precision p = TP/(TP + FP), Recall r = TP/(TP + FN) and the Dice Index the following commonly based on and statistical tests of TP, FP, TN and FNevaluation, were calculated: Precision five p = TP/(TP + FP),used Recallmetrics r = TP/(TP + FN) the Dice Index DI = 2(p·r)/(p + r), characterize the general performance of the detection, especially DI evaluates the FP,DI TN and FN +were calculated:the Precision = TP/(TP +ofFP), r = especially TP/(TP +DI FN) and thethe Dice = 2(p·r)/(p r), characterize general pperformance the Recall detection, evaluates overall detection accuracy. The Jaccard Index (JI) as follows JI = TP/(TP + FP + FN) indicates the Index DI = 2(p¨ r)/(p + r), characterize the general performance of the detection, especially DI evaluates overall detection accuracy. The Jaccard Index (JI) as follows JI = TP/(TP + FP + FN) indicates the similarity rate between two segmentation areas, and the Manhattan Index (MI) studies the similarity thesimilarity overall detection accuracy. The Jaccardareas, Indexand (JI)the as follows JI =Index TP/(TP + studies FP + FN) rate between two segmentation Manhattan (MI) theindicates similaritythe rate of the entire image MI = (TP + TN)/(TP + TN + FP + FN). similarity rate between areas, Manhattan Index (MI) studies the similarity rate of the entire imagetwo MI segmentation = (TP + TN)/(TP + TNand + FPthe + FN). In Table 2, results are shown for the mentioned metrics, where the results for all 50 test images, In Table resultsMI are=shown the mentioned metrics, rate of the entire2,image (TP + for TN)/(TP + TN + FP + FN).where the results for all 50 test images, in original and reduced sizes, have been averaged. The last column shows the average processing in In original and reduced sizes, have been averaged. The lastwhere column processing Table 2, results are shown for the mentioned metrics, theshows resultsthe foraverage all 50 test images, in time for each size. The DI is obtained as a value between 0 and 1, with 1 being the most accurate time for each size. The DIhave is obtained as a valueThe between 0 and 1, with the 1 being the most accurate original and reduced sizes, been averaged. last column shows average processing time detection. It was transformed into percentage values to facilitate the comparison with the other ItThe wasDItransformed into percentage values to 1, facilitate the comparison with thedetection. other fordetection. each size. is obtained as a value between 0 and with 1 being the most accurate metrics. metrics. It was transformed into percentage values to facilitate the comparison with the other metrics. Table 2. Average metrics obtained over 50 resized test images. Table2.2.Average Averagemetrics metrics obtained obtained over Table over 50 50 resized resizedtest testimages. images.
Size r Size r 1920 × 1080 96.30% 1920 × 1080 Size 96.30%r 1280 × 720 96.17% 1920 ˆ 108096.17% 96.30% 1280 × 720 1280 ˆ 720 95.95% 96.17% 960 × 540 960 × 540960 ˆ 540 95.95% 95.95% 480 × 270 95.83% 480 × 270480 ˆ 270 95.83% 95.83% 240 × 135 95.71% 95.71% 240 × 135240 ˆ 135 95.71%
p p 97.39% p 97.39% 97.05% 97.39% 97.05% 97.05% 96.82% 96.82% 96.82% 96.70% 96.70% 96.70% 96.47% 96.47% 96.47%
DI DI 96.84% DI 96.84% 96.61% 96.84% 96.61% 96.61% 96.43% 96.43% 96.43% 96.25% 96.25% 96.25% 96.09% 96.09% 96.09%
JI MI JI MI JI93.88% MI 97.67% Tp (s) 93.88% 97.67% 93.44% 97.50% 93.88% 0.1005 93.44% 97.67%97.50% 93.44% 0.0639 93.02%97.50%97.33% 93.02% 97.33% 93.02% 0.0447 92.80%97.33%97.25% 92.80% 97.25%97.25% 92.80% 0.0275 92.48% 97.12% 92.48% 0.0185 92.48% 97.12%97.12%
Tp (s) Tp (s) 0.1005 f/s 0.1005 0.0639 10 0.0639 15 0.0447 0.0447 22 0.0275 0.0275 36 0.0185 54 0.0185
f/s f/s 10 10 15 15 22 22 36 36 54 54
Sensors 2016, 16, 893
11 of 16
Sensors 2016, 16, 893
11 of 16
For For all all image image sizes, sizes, very very high high and and similar similar rates rates are are obtained obtained for for all all metrics. metrics. It It can can be be seen seen that that the area detection accuracy diminishes as image size decreases, although it always maintains the area detection accuracy diminishes as image size decreases, although it always maintains rates rates above 95% for for r, r, p, p,and andDI. DI.For Forall allsizes, sizes,JIJIisishigher higher than 92% while overall achieved with above 95% than 92% while thethe overall raterate achieved with MI MI is between 97% and 98%. Nevertheless, a much faster detection can be accomplished with small is between 97% and 98%. Nevertheless, a much faster detection can be accomplished with small sizes, sizes, reducing calculation time to acompared fifth compared the original size. Consequently, reducing calculation time up to up a fifth to thetooriginal imageimage size. Consequently, with with very very images, extremely processing rates could achievedand andup uptoto54 54images images per per second smallsmall images, extremely highhigh processing rates could bebe achieved second could could be be processed, processed, which which is is significantly significantly greater greater than than the the rate rate required required for for real-time, real-time, considering considering aa general for smooth smooth video. video. In In fact, fact, 30 30 f/s f/swould wouldcorrespond correspond to to an an approximate approximate image general rate rate of of 30 30 f/s f/s for image size size of 300 pixels, pixels, which which is is perfectly perfectly representative representative of of aa mobile of 600 600 ˆ × 300 mobile device. device. Figure Figure 77 shows shows graphically graphically the the relation relation between between the the values values obtained obtained for for DI DI and and processing processingtime. time.
Figure 7. 7. Relation Relation between between the the general general performance performance of of the the detection detection through through Dice Dice Index Index (DI) (DI) vs. vs. time time Figure processing (Tp) for FFDI performance at different image resolutions. processing (Tp) for FFDI performance at different image resolutions.
The presence of FP (false positives) has been found to occur principally in areas close to the forest The presence of FP (false positives) has been found to occur principally in areas close to the forest fire. The explanation for this behavior is that the environment of the flame contains higher values in fire. The explanation for this behavior is that the environment of the flame contains higher values in the red component due to reflections, such that confusion occurs at the time of detection. Other factors the red component due to reflections, such that confusion occurs at the time of detection. Other factors influencing the presence of FP may include changes in lighting and RGB chromaticity. Furthermore, influencing the presence of FP may include changes in lighting and RGB chromaticity. Furthermore, an inexact calibration of the parameter ρ could contribute to the loss of information. an inexact calibration of the parameter ρ could contribute to the loss of information. 4.3. Detection Detection of of Early Early Stage Stage Forest Forest Fires Fires 4.3. The way spreads (speed, direction, etc.) and distribution of its smoke, The way ininwhich whicha fire a fire spreads (speed, direction, etc.)the and the distribution of itsstrongly smoke, depend on weather conditions which consequently influence the detection quality and rate. For strongly depend on weather conditions which consequently influence the detection quality and instance, a smoke acolumn from a distance could indicate an arousing fire, butfire, in abut windy rate. For instance, smoke observed column observed from a distance could indicate an arousing in a environment, the smoke would spread rapidly. The flame, however, is a more secure source of windy environment, the smoke would spread rapidly. The flame, however, is a more secure source information than smoke, asas the is not not of information than smoke, thewind windrekindles rekindlesititand andits itscolor colorisiseasier easierto to detect, detect, although although it it is possible to observe it from a distance while the fire remains small. Here, the use of small UASs is possible to observe it from a distance while the fire remains small. Here, the use of small UASs is aa significant advantage, advantage, as as they they can can fly fly at at low low altitudes altitudes and and take significant take images images from from inside inside views views of of the the forest, forest, through the the trees. trees. through Thirty test test images images were were selected selected to to test test situations situations of of early early stages stages of of fires. Thirty fires. Table Table 33 shows shows numerical numerical results for the same metrics calculated in the previous section. As real-time applications require fast results for the same metrics calculated in the previous section. As real-time applications require fast processing times, times, only only the the two twomedium-sized medium-sizedimages images(960 (960ˆ× 540 540 and and 480 480 ˆ × 270 processing 270 pixels) pixels) were were selected, selected, due to their shorter processing times. For the same reasons as stated in Section 4.2, the evaluation has due to their shorter processing times. For the same reasons as stated in Section 4.2, the evaluation has been performed with ρmin. been performed with ρmin .
Sensors 2016, 16, 893
12 of 16
Table 3. Average metrics obtained over 30 images of initiating fire processes.
Size r DI JI Manhattan Tp(s) f/s p 960 × 540 97.18% 96.62% 96.90% 93.98% 97.55% 0.0441 22 480 × 270 96.90% 96.62% 96.76% 93.73% 97.44% 0.0181 55
Sensors 2016, 16, 893
12 of 16
Table 3. Average metrics obtained over 30 images of initiating fire processes.
As can be seen, the results for these kinds of images show similar detection accuracies as for r DI in theJI rate of Manhattan f/s due to the larger distance Size pictures. However, ap reduction FNs can beTp(s) observed 540 and 97.18% 96.62% 96.90% similar 93.98%processing 97.55% 0.0441 improvement960 of ˆ Recall JI, while maintaining times as those 22 in Table 3 (the 480 ˆ 270 96.90% 96.62% 96.76% 93.73% 97.44% 0.0181 55 frame rate is slightly improved). Figure 8 shows some visual examples extracted from the test set. The figure on the left has been As can be seen, these kinds of images similar detection as confused for larger obtained with ρmin = the 0.2,results whichfor permits the detection ofshow an initiating fire. The accuracies flame is not distance pictures. However, a reduction in the rate of FNs can be observed due to the improvement with the reddish tonalities of the ground using this ρ. Nevertheless, higher values of ρ are producing FPs. of Recall and JI, image while maintaining similar processing times asbut those Table 3 (the frame rate is The central presents even smaller areas of flames, theyinare clearly distinguishable slightly improved). from the green, gray and blue tonalities which dominate the histogram. In this case, ρmin = 0.7, higher Figure 8 showsin some visual examples extracted from the test set. Theanfigure on the has values are resulting FP due to confusion. Finally, the right image shows example for aleft bushbeenwhose obtained withare ρmin = 0.2,distinguishable which permits against the detection of an initiating fire. The flame fire, flames directly the green background. The white road is not confused using with the reddish tonalities of the ground using ρ. Nevertheless, higher= values ρ are detected ρmin = 1, as the color components are this nearly equal (red mean 234.17,ofgreen producing FPs.and blue mean = 211 are the average values of the histogram of this area). mean = 234.13
Figure 8. Detections of initial forest fires, realized with FFDI at short distances with; (a) ρmin = 0.2; Figure 8. Detections of initial forest fires, realized with FFDI at short distances with; (a) ρmin = 0.2; (b) (b) ρ ρ min ==0.7; 0.7;(c) (c)ρρmin = =1.1. min
min
The variation of ρ in the different images is because they have been obtained with different The central image presents even smaller areas of flames, but they are clearly distinguishable from sensors, different resolutions, calibrations, sizes, etc. The environmental conditions, for instance, the green, gray and blue tonalities which dominate the histogram. In this case, ρmin = 0.7, higher values lighting, time of day and so forth also differed. It has been proven that ρmin and ρmax remain constant are resulting in FP due to confusion. Finally, the right image shows an example for a bush-fire, whose in image sequences obtained with the same sensor and under the same illumination conditions. It is flames are directly distinguishable against the green background. The white road is not detected using also important to highlight that the ρmin should be fixed for applications in real-time. ρmin = 1, as the color components are nearly equal (red mean = 234.17, green mean = 234.13 and blue mean = 211 are the average values of the histogram of this area). 4.4. Application to Non-Forested Environments The variation of ρ in the different images is because they have been obtained with different In Section 2, the development of both indices, FDI and has been explained, also sensors, different resolutions, calibrations, sizes, etc. The FFDI environmental conditions, forindicating instance, the insufficiency of FDI for precise detections in forested environments. Although the primary focus lighting, time of day and so forth also differed. It has been proven that ρmin and ρmax remain constant of this paper is on forest firewith detection, some additional testthe results also included for other in image sequences obtained the same sensor and under samewere illumination conditions. It is environments, using images provided the Data Bases Images Group of the University of also important to highlight that the ρmin by should be fixed for and applications in real-time. São Paulo (São Paulo, Brazil) [33]. 4.4. Application Non-Forested Environments The key toto successful fire detection in other scenarios lies in Equation (6). As previously explained, values of ρ ≤ 1 assure flame detection, an FFDI enhancement reddish and colors, In Section 2, the development of both indices,due FDItoand has been of explained, alsoyellow indicating the independently of the environment colors. In this way, the method also works for urbanized insufficiency of FDI for precise detections in forested environments. Although the primary focus scenes of this with streets, as some shown in Figuretest 9. Nevertheless, those are stillfor preliminary tests, and paperedifications is on forest and fire detection, additional results were also included other environments, they should be improved and adapted to the characteristics of these environments to achieve a using images provided by the Data Bases and Images Group of the University of São Paulo (São Paulo, reliable detection. Brazil) [33]. The key to successful fire detection in other scenarios lies in Equation (6). As previously explained, values of ρ ď 1 assure flame detection, due to an enhancement of reddish and yellow colors, independently of the environment colors. In this way, the method also works for urbanized scenes with edifications and streets, as shown in Figure 9. Nevertheless, those are still preliminary tests, and they should be improved and adapted to the characteristics of these environments to achieve a reliable detection.
Sensors 2016, 16, 893 Sensors 2016, 16, 893
13 of 16 13 of 16
Figure Figure 9. 9. Fire Firedetection detectionwith with FFDI FFDI in in different different scenes. scenes.
5. 5. Discussion Discussion Evaluation Evaluation of of the the proposed proposed method method is is undertaken undertaken in in four four stages: stages: first firstanalyzing analyzingthe thefactor factorρ,ρ, which aims to adjust the FFDI to different conditions, concretely to detect more or less of the which aims to adjust the FFDI to different conditions, concretely to detect more or less of the smoke smoke surrounding the flame. surrounding the flame. The applicability of of thethe method in in UASs resulted in The second secondand andbasic basicanalysis analysisused usedtotoshow showthe the applicability method UASs resulted very promising detection rates and processing times for aerial images displaying forest fires. It in very promising detection rates and processing times for aerial images displaying forest fires. It is is evident evident that that the the method method is is valid valid for for real-time real-time use use in in UASs, UASs, due due to to achieving achieving detection detection rates rates around around 97% images per per second. second. This 97% for for frame frame rates rates up up to to 30 30 images This means means that that information information could could be be evaluated evaluated instantly, and alarms can be sent immediately from any location. The processing method of instantly, and alarms can be sent immediately from any location. The processing method of evaluating evaluating regions could also provide information additional information asthe theburning size of the burning zone or regions could also provide additional such as the such size of zone or direction of direction of propagation when a sequence of images is compared. In image sequences, different propagation when a sequence of images is compared. In image sequences, different motion estimation motion estimation be applied, asblock e.g., optical flowOptical or block matching. techniques could betechniques applied, ascould e.g., optical flow or matching. flow methodsOptical [34] areflow very methods [34] are very precise as they calculate the gradients (motion direction) of all pixels, but carry precise as they calculate the gradients (motion direction) of all pixels, but carry the disadvantage to be the disadvantage to besuch highly cost such the advantage of real-time performance highly cost intensive that theintensive advantage of that real-time performance would fail. Probably,would a fast fail. Probably, a fast block matching algorithm would be a better solution as the aim is to get a rough block matching algorithm would be a better solution as the aim is to get a rough direction of the fire’s direction of the fire’s expansion and its velocity. For this purpose, a drone has a clear advantage over expansion and its velocity. For this purpose, a drone has a clear advantage over a plane, as it can stand a plane, as it can stand still over a certain point during a desired amount of time. still over a certain point during a desired amount of time. Regarding the detection of already burned areas, a new index would be created, therefore, Regarding the detection of already burned areas, a new index would be created, therefore, similar similar as explained in Sections 2.2.1–2.2.4, images of destroyed forest would be analyzed to work as explained in Sections 2.2.1–2.2.4, images of destroyed forest would be analyzed to work out a new out a new index for burned areas. Probably it would not be possible to adapt the FFDI and detect fire, index for burned areas. Probably it would not be possible to adapt the FFDI and detect fire, smoke smoke and burned areas in one step, but the objectives are also different, the FFDI aims at detecting and burned areas in one step, but the objectives are also different, the FFDI aims at detecting and and surveilling fires (application before and during a fire-event), a new index for burned areas would surveilling fires (application before and during a fire-event), a new index for burned areas would aim aim at exploring the regions after the event. at exploring the regions after the event. The third part of evaluation has focused on closer views corresponding to low altitude flights The third part of evaluation has focused on closer views corresponding to low altitude flights over over areas with difficult access, which is possible with UASs/UAVs but not with conventional areas with difficult access, which is possible with UASs/UAVs but not with conventional surveillance surveillance systems as manned planes or satellites [9,16,17]. Here, very high detection rates at the systems as manned planes or satellites [9,16,17]. Here, very high detection rates at the same low same low processing times have also been obtained. processing times have also been obtained. Lastly to show its versatility, the method has also been evaluated successfully on images Lastly to show its versatility, the method has also been evaluated successfully on images showing showing environments other than forest, such as edifications. environments other than forest, such as edifications. Summarizing, the proposed method seems quite promising for applications in UASs, as, besides Summarizing, the proposed method seems quite promising for applications in UASs, as, besides efficiency, there are various additional benefits, such as the possibility of reducing costs of expensive efficiency, there are various additional benefits, such as the possibility of reducing costs of expensive equipment and manned flights, in turn reducing risks to personnel. According to a cost-benefit equipment and manned flights, in turn reducing risks to personnel. According to a cost-benefit analysis performed by [19], the use of UAVs/UASs would save 33% of the costs incurred by analysis performed by [19], the use of UAVs/UASs would save 33% of the costs incurred by employing helicopters. employing helicopters. 6. Conclusions and Future Work This study aims at providing an efficient and reliable method for forest fire detection that could be implemented in UASs and used in real-time. Therefore, two detection indices have been
Sensors 2016, 16, 893
14 of 16
6. Conclusions and Future Work This study aims at providing an efficient and reliable method for forest fire detection that could be implemented in UASs and used in real-time. Therefore, two detection indices have been developed: the FDI (Fire Detection Index) and an extension of it, the FFDI (Forest Fire Detection Index), specially developed for vegetative environments. The authors propose the use of the FFDI for forest fire detection, as it shows very promising results and proves the possibility of real-time application, achieving overall detection rates of DI = 96.84% (1920 ˆ 1080) at a maximum frame rate of 54 f/s for tiny image sizes (240 ˆ 135). A special feature that shows the FFDI is the use of the variable factor ρ, which permits an adaptive detection of the flame and the surrounding smoke. Depending on the condition and purpose of the application, this factor can be adjusted as required. In this way, FFDI can also be applied to environments other than forests, such as urbanizations. Multiple evaluative tests performed over imagery obtained in different environments show the flexibility and adaptability of the method to a multitude of applications. Implemented in UASs, the algorithm could be employed for urbanized areas as well as for forests, and this has been proven to work well for distant and close views. The last point is especially interesting, as small UASs, also called drones, can easily access difficult or hidden places, where neither people nor vehicles nor planes could enter. Therefore, not only does the system outperform fixed, conventional systems placed on towers, as it is more flexible and covers a wider area, it is also much more cost-efficient than systems currently used in planes, helicopters or satellites: in other words, this algorithm achieves the same results more cheaply compared to existing systems. These very promising results should encourage further development, with the method being implemented in a real-time system. Initial efforts employed a commercial drone type Bebop Parrot and a mobile control and evaluation platform (quad-core tablet with 2 GB memory and Android OS). The lightweight drone (420 g) is equipped with a high-resolution optical sensor with a frame rate of 30 f/s, 180˝ vision and video stabilizer, a wireless transmission system 802.11a/b/g/n/ac, geo-stabilization and geo-positioning system, vibration suppression, pre-configuration and flight autonomy. The information flow in this system would be as follows: the UAS obtains the images and sends them via Wi-Fi to the mobile platform that runs the detection software and is also used as the control device for the drone. The video frames can be obtained at a maximum frequency of 30 f/s. The transmission rate of the wireless access point is 100 Mbps, such that the maximum image size at the greatest capture frequency would be 3.3 Mb, which allows much bigger images than the largest ones tested, which only need about 600 kb with jpeg compression. As the processing time of the detection algorithm reaches 22 f/s for 960 ˆ 540 pixel sized images and 36 f/s for 480 ˆ 270 pixels, an intermediate size will be proposed to get the maximum performance. As the channel allows much larger image formats, consequently, the challenge is to speed up the algorithm to obtain higher precision segmentations. It is also expected that there will be additional studies regarding a wider possible range of applications for FDI to scenarios other than forests. A further challenge for future work is to obtain data about the burning and already burned area and provide it in real-time to the surveillance stations and fire workers, as it will be of great interest to estimate the dimension of a disaster in explorations after a fire. The geolocalization data is available through the GPS and the accelerometer mounted in the UAS. The area of the fire could be calculated through height information and image size/resolution, which leads to the relation of the pixel size to the corresponding area, such that the size of the detected RoI is equivalent to the size of the fire. An additional analysis of the pixel colors could also reveal facts about temperature or type of combustion, as different materials produce different flame colors in forested areas. As already indicated in the discussion section, through video analysis it is possible to obtain the direction and the speed of the fire’s expansion. All in all, it is valuable information, which, could be obtained shortly in real-time.
Sensors 2016, 16, 893
15 of 16
Acknowledgments: This work was sponsored by the Spanish National Plan for Scientific Technical Research and Innovation, project number TEC2013-48453-C2-2-R. Author Contributions: The corresponding author Henry Cruz proposed the research, organized the experimental program, and drafted the manuscript. Martina Eckert was involved in the writing of the manuscript, and technical advice. Juan Meneses performed the data analysis and drafted part of the manuscript. J.F. Martinez did the proofreading and provided general advice. Conflicts of Interest: The authors declare no conflict of interest.
References 1. 2. 3. 4. 5. 6.
7. 8. 9. 10. 11. 12. 13. 14. 15. 16. 17. 18. 19.
20.
Lydersen, J.M.; North, M.P.; Collins, B.M. Severity of an uncharacteristically large wildfire, the Rim Fire, in forests with relatively restored frequent fire regimes. For. Ecol. Manag. 2014, 328, 326–334. [CrossRef] European Forest Fire Information System (EFFIS). Available online: http://forest.jrc.ec.europa.eu/effis/ reports/ (accessed on 28 May 2015). Flannigan, M.D.; Stocks, B.J.; Wotton, B.M. Climate change and forest fires. Sci. Tot. Environ. 2000, 262, 221–229. [CrossRef] Podur, J.; Wotton, M. Will climate change overwhelm fire management capacity? Ecol. Model. 2010, 221, 1301–1309. [CrossRef] Collins, B.M. Fire weather and large fire potential in the northern Sierra Nevada. Agric. For. Meteorol. 2014, 189, 30–35. [CrossRef] Cappellini, V.; Mattii, L.; Mecocci, A. An Intelligent System for Automatic Fire Detection in Forests. In Recent Issues in Pattern Analysis and Recognition; Springer Berlin Heidelberg: Berlin, Germany, 1989; Volume 399, pp. 351–364. Millan, L.; Sanchez, G.; Nakano, M.; Toscano-Medina, K.; Perez-Meana, H.; Rojas, L. An early fire detection algorithm using IP cameras. Sensor 2012, 12, 5670–5686. [CrossRef] [PubMed] Sahin, Y.G.; Ince, T. Early forest fire detection using radio-acoustic sounding system. Sensor 2009, 9, 1485–1498. [CrossRef] [PubMed] Yuan, C.; Zhang, Y.; Liu, Z. A Survey on Technologies for Automatic Forest Fire Monitoring, Detection and Fighting Using UAVs and Remote Sensing Techniques. Can. J. For. Res. 2015, 45, 783–792. [CrossRef] Qian, Y.; Yan, G.; Duan, S.; Kong, X. A contextual fire detection algorithm for simulated HJ-1B imagery. Sensor 2009, 9, 961–979. [CrossRef] [PubMed] Yoon, S.H. An intelligent automatic early detection system of forest fire smoke signatures using Gaussian mixture model. J. Inf. Process. Syst. 2013, 9, 621–632. [CrossRef] Stula, M.; Krstinic, D.; Seric, L. Intelligent forest fire monitoring system. Inf. Syst. Front. 2012, 14, 725–739. [CrossRef] Arrue, B.C.; Ollero, A.; De Dios, J. An intelligent system for false alarm reduction in infrared forest-fire detection. IEEE Int. Syst. Appl. 2000, 15, 64–73. [CrossRef] Guijarro, M.; Pajares, G.; Riomoros, I.; Herrera, P.; Burgos-Artizzu, X.; Ribeiro, A. Automatic segmentation of relevant textures in agricultural images. Comput. Elect. Agric. 2011, 75, 75–83. [CrossRef] Montalvo, M.; Pajares, G.; Guerrero, J.M.; Romeo, J.; Guijarro, M.; Ribeiro, A.; Cruz, J.M. Automatic detection of crop rows in maize fields with high weeds pressure. Exp. Syst. Appl. 2012, 39, 11889–11897. [CrossRef] Tang, L.; Shao, G. Drone remote sensing for forestry research and practices. J. For. Res. 2015, 26, 791–797. [CrossRef] Salamí, E.; Barrado, C.; Pastor, E. UAV flight experiments applied to the remote sensing of vegetated areas. Remote Sens. 2014, 6, 11051–11081. [CrossRef] Watts, A.C.; Ambrosia, V.; Hinkley, E.A. Unmanned aircraft systems in remote sensing and scientific research: Classification and considerations of use. Remote Sens. 2012, 4, 1671–1692. [CrossRef] Christensen, B.R. Use of UAV or remotely piloted aircraft and forward-looking infrared in forest, rural and wildland fire management: Evaluation using simple economic analysis. N. Z. J. For. Sci. 2015, 45, 1–9. [CrossRef] Martínez-de Dios, J.R.; Merino, L.; Caballero, F.; Ollero, A. Automatic forest-fire measuring using ground stations and unmanned aerial systems. Sensor 2011, 11, 6328–6353. [CrossRef] [PubMed]
Sensors 2016, 16, 893
21. 22.
23.
24.
25. 26. 27. 28. 29. 30. 31.
32. 33. 34.
16 of 16
NASA Earth Science Division. Available online: http://geo.arc.nasa.gov/sge/UAVFiRE/completeddemos. html (accessed on 7 July 2015). Torres-Sánchez, J.; Peña, J.M.; de Castro, A.I.; López-Granados, F. Multi-temporal mapping of the vegetation fraction in early season wheat fields using images from UAV. Comput. Elect. Agric. 2014, 103, 104–113. [CrossRef] Peña, J.M.; Torres-Sánchez, J.; Serrano-Pérez, A.; de Castro, A.I.; López-Granados, F. Quantifying efficacy and limits of unmanned aerial vehicle (UAV) technology for weed seedling detection as affected by sensor resolution. Sensor 2015, 15, 5609–5626. [CrossRef] [PubMed] Yuan, C.; Liu, Z.; Zhang, Y. UAV-based forest fire detection and tracking using image processing techniques. In Proceedings of the IEEE International Conference on Unmanned Aircraft Systems (ICUAS 2015), Denver, CO, USA, 9–12 June 2015; pp. 639–643. Woebbecke, D.; Meyer, G.; Von Bargen, K.; Mortensen, D. Color indices for weed identification under various soil, residue, and lighting conditions. Trans. ASAE 1995, 38, 259–269. [CrossRef] Otsu, N. A Threshold Selection Method from Gray-Level Histograms. IEEE Trans. Syst. Man Cyber. 1979, 9, 62–66. Meyer, G.E.; Hindman, T.W.; Laksmi, K. Machine vision detection parameters for plant species identification. Proc. SPIE 1999, 3543, 327–335. Perez, A.J.; Lopez, F.; Benlloch, J.V.; Christensen, S. Colour and shape analysis techniques for weed detection in cereal fields. Comput. Elect. Agric. 2000, 25, 197–212. [CrossRef] Meyer, G.E.; Neto, J.C. Verification of color vegetation indices for automated crop imaging applications. Comput. Elect. Agric. 2008, 63, 282–293. [CrossRef] European Forest Fire Information System (EFFIS). Available online: http://forest.jrc.ec.europa.eu/effis/ about-effis/technical-background/european-fire-database/ (accessed on 15 June 2015). Warnell School of Forestry and Natural Resources, The University of Georgia; College of Agricultural and Environmental Sciences; Center for Invasive Species and Ecosystem Health; US Forest Service; International Society of Arboriculture; USDA Identification Technology Program. Forestry Images Organization. Available online: http://www.forestryimages.org/browse/subimages.cfm?sub=740 (accessed on 6 August 2015). Followgreenliving.com. Available online: http://followgreenliving.com/causes-forest-fire-nature-humanbeings/ (accessed on 5 December 2015). Database and Images Group ICMC/USP. Available online: http://www.gbdi.icmc.usp.br/downloads-en. html (accessed on 8 January 2016). Lucas, B.D.; Kanade, T. An iterative image registration technique with an application to stereo vision. In Proceedings of the International Joint Conference on Artificial Intelligence, Vancouver, BC, Canada, 24–28 August 1981; Volume 81, pp. 674–679. © 2016 by the authors; licensee MDPI, Basel, Switzerland. This article is an open access article distributed under the terms and conditions of the Creative Commons Attribution (CC-BY) license (http://creativecommons.org/licenses/by/4.0/).