and data mining are formulated: for every pixel in the query image, (i) find the ... or more precisely, images having the largest number of pixels within the query region. ... In order to solve those tasks efficiently in a large, unordered image collection, a number ... mark are and which details are worth seeing (taking a picture of).
Efficient Image Detail Mining Andrej Mikul´ık
Filip Radenovi´c
Ondˇrej Chum
Jiˇr´ı Matas
Center for Machine Perception Department of Cybernetics, Faculty of EE, Czech Technical University in Prague
Abstract. Two novel problems straddling the boundary between image retrieval and data mining are formulated: for every pixel in the query image, (i) find the database image with the maximum resolution depicting the pixel and (ii) find the frequency with which it is photographed in detail. An efficient and reliable solution for both problems is proposed based on two novel techniques, the hierarchical query expansion that exploits the document at a time (DAAT) inverted file and a geometric consistency verification sufficiently robust to prevent topic drift within a zooming search. Experiments show that the proposed method finds surprisingly fine details on landmarks, even those that are hardly noticeable for humans.
1
Introduction
Visual image and specific object search engines have gone through a rapid development in the past decade. Methods that evolved from the bag of visual words [26] show
37.3x
27.0x
22.8x
21.9x
21.6x
34x
29x
23x
17x
11x
6x
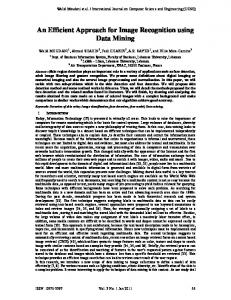
Fig. 1: Top five ranked images (right, 2nd row) automatically retrieved by the highest resolution transform. Compare the resolution of the corresponding parts (right, 1st row) of the query image (left, top). The difference in resolution is best appreciated in the visualization on selected details (right, 3rd and 4th row). The scaling factor achieved at each pixel is shown below the query image.
2
Andrej Mikul´ık, Filip Radenovi´c, Ondˇrej Chum, Jiˇr´ı Matas 118
369
742
67
173
307
36
79
124
18
33
46
7
11
14
Fig. 2: The number of images showing a pixel (three images on the right) of the Astronomical clock query (left) only covering a small percentage of the original query: 0–1%, 1–3%, 3–10%, from left to right respectively. The percentage is related to the size of the detail photographed.
considerable diversity and differ significantly from the original, e.g. those aggregating local descriptors like Fischer kernel [23] or VLAD [12]. But all the approaches attempt to rank images according to the similarity to the query image or region. Finding and displaying the most similar images in a large dataset, however, may neither be the most exciting user experience nor useful for solving a particular search task since near duplicates or very similar images are retrieved, see Figure 9. This was recently pointed out by Mikulik et al. [18] who propose a different search task: given a user-specified region in the query image, find the most detailed images in the database, or more precisely, images having the largest number of pixels within the query region. In this work, we generalize the approach to the following formulation: given a query image, automatically, without any user specified hint, find all ”interesting” parts within the spatial extent of the query. Two definitions of ”interesting” lead to different tasks. The first is to find, for all pixels in the query, the highest resolution images depicting it, Figure 1. The second is to find regions of interest that are the most often photographed, Figure 2 (right). For more examples and comparison of the two tasks, see also Figures 10 and 11. In order to solve those tasks efficiently in a large, unordered image collection, a number of issues has to be tackled. Namely, an efficient retrieval of matching subimages with significantly different resolution has to be addressed, together with an effective rejection of false matches to prevent topic drifts. Towards this end, we introduce a novel concept of detail mining called hierarchical query expansion. The results of the method are illustrated in Figures 1 and 2, which show the query image, a sample of the discovered images of details from the dataset and two visualizations of localized interesting parts of the query image. The color in Figure 1 (left, bottom) codes the maximal resolution found in the dataset. In Figure 2 (right) the color codes the number of images found and backprojected into the query image. The outputs show what the most interesting details for the crowds visiting the landmark are and which details are worth seeing (taking a picture of). It helps the user to find or focus on interesting details or suggests additional queries. Annotations (such as Flickr tags) of the discovered images can be used for describing parts of the image as in [4]. The output of the proposed detail mining can be also used as a initial step for finding iconic view of the details [28].
Efficient Image Detail Mining
3
The rest of the paper is structured as follows: the components of the search engine based on bag-of-words retrieval are reviewed in Section 2. The novel method is introduced in Section 3 and experiments are given in Section 4. Section 5 concludes the paper.
2
Related Work
This section reviews relevant approaches to specific object search. Currently, methods based on aggregation of local features, such as [12, 23], have become popular. Despite recent results on approximate localization using VLAD descriptor [2], these methods perform poorly when geometric constraints are to be enforced. Thus, these methods are not suitable for sub-image search with large scale change. This paper builds on the bag-of-words image representation which was first adopted in the domain of visual search in [26]. Virtually all aspects of BoW-type representation have been studied in great detail: feature detectors and descriptors [15, 3, 29, 16, 17], vocabulary construction [26, 21, 24, 10, 19], spatial verification and re-ranking [24, 10], document metric learning [13, 11, 5], dimensionality reduction [9], burstiness and feature dependency detection [11, 5, 14], and query expansion and automatic failure recovery [8, 25, 11, 22, 7]. The proposed method exploits a recent variant of the BoW image representation using an inverted file augmented with geometric information [27] for efficient image scoring. The closest approach to ours is [18] which attempts to retrieve a single userspecified sub-window with the highest resolution. Unlike Mikulik et al., no supervision by the user is provided in this work, and all possible locations are considered simultaneously. To avoid severe contamination by irrelevant images, a novel geometric consistency verification method is introduced. Compared to other methods that efficiently find clusters of related images, such as [4], this paper focuses on extreme geometric changes, especially towards large changes of scale in order to obtain images with the greatest details. The application domain of this paper is similar to the recent work of Weyand and Leibe [28] on hierarchical iconoid shift, which, given a landmark, provides iconic views of objects at different scales on that landmark. In [28], images are obtained separately for each landmark, using textual ques and GPS tags, and each collection of such images is indexed separately. In contrary, our approach has only one large collection of images without any further annotation, and the landmark (or any image with details to be discovered) is not defined beforehand. In [28], the images are exhaustively matched, which is a time demanding offline process. Our method works online and takes only several seconds to find the details of a given image. Note that compared to [28], this paper deals with a more difficult task, as linking details to full views in the exhaustive matching is easier than the other way round, see Figure 3. 2.1
What is this?
The proposed method builds upon the ideas introduced by Mikulik et al. in [18]. We review this work in detail as the zoom-in queries are used. The method [18] is based
4
Andrej Mikul´ık, Filip Radenovi´c, Ondˇrej Chum, Jiˇr´ı Matas
query
query
rank: 1
rank: 1
2
4
512
8
2048
16
32
4096
64
16384
65
81368
Fig. 3: Reaching the full view from a detail and vice versa by conventional image retrieval. When querying with an image of a detail, the full view is returned in the top few images. When querying with the full view, the detailed images are ranked low, typically even below a large number of false positives.
on the bag-of-words image search engine. In the first step, features are detected and described in the given query image. Posting lists (rows of inverted files) of the query visual words are fetched and images in the dataset scored according to the weighted bagof-words. The standard tf-idf weighting scheme is used but in addition, visual words scores to the separate bins according to the logarithm of the scale change. A score in a bin is re-weighted linearly to prefer scaling-up (zoom-in) and to suppress scaling-down. In our experiments, we compressed the scale information of each feature into 4 bits. This allows to separate features into 16 bins. Edges of the bins are learned on the subset of images to equalize the histogram of log scales. In standard systems the score is evaluated in one go for each document when scalar products are computed between whole posting lists and a query BoW vector. To enable taking into account the scale change, the score of a document is computed during traversing of the inverted file in a document at a time (DAAT) manner [27]. A heap of the top S scored images is kept, where S is a chosen length of the shortlist. Images in the shortlist are spatially verified using RANSAC [6] and incremental spatial verification (iSP) [7], and re-ordered according to the scale of found geometric transformation. This ranking is prone to false positives more than standard ranking – according to number of model inliers. The problem was already mentioned in [18].
3
Efficient Image Detail Mining
This section describes the proposed method in detail. The goal of this paper is to find the finest details for every location in the image and to find regions that are commonly photographed by the crowds. Two issues prevent a simple solution of applying the method described in the previous section to every location in the image: computational efficiency and the risk of high false positive rate. 3.1
Hierarchical query expansion
It has been demonstrated many times that the query expansion technique [8, 1] significantly improves the quality of retrieval performance, especially on the recall. We in-
Efficient Image Detail Mining
5
Algorithm 1 Overview of the zooming algorithm. Note that step 5 represents a trade-off between the query time and output quality. Input: Bag-of-words of the query image Q Output: Ranked list of images R
1. Fetch posting list of query visual words from inverted file. 2. Score with tf-idf weights and re-weight according to scale change of the features. Create the shortlist. 3. Spatially verify images in the shortlist estimating affine transformation A with RANSAC. 4. Rank images according to det(A) (descend order). 5. Group images. 6. Return the result or form the expanded query with context learning and goto 1.
troduce a novel method for detail mining called hierarchical query expansion. After the initial query, the image is divided into sub-regions and a new, expanded, query is issued for each of the sub-regions. The partitioning of the image is driven by the density of the photographed details – the focus of the crowds. Since people tend to take pictures of individual and well aligned objects, regions depicted in a number of overlapping images are good candidates for detail mining. There are three issues that need to be addressed in order to efficiently deliver qualitatively appealing results: image coverage, low redundancy, and consistency. Image coverage and low redundancy. Typically, on well-known landmarks, certain details are photographed significantly more often than others. Considering only the top results without considering their spatial layout, as most of the query expansion approaches do, would result in neglecting details that are still available in the image collection, but are depicted on a lower number of photographs. In order to obtain details in all parts of the image, lower ranked images that are not overlapping with higher ranked images are considered. For efficiency, the retrieved images are spatially clustered and large clusters are sub-sampled. Each such cluster provides a simple generative model of a certain part of the image on a higher resolution level than the original query. The clusters are used to issue an expanded zoom-in query, to obtain further details. The procedure can be iterated, however our experiments suggest that a single application of hierarchical query expansion is sufficient to obtain most of the details present in the database. Consistency. Since in our approach the user does not provide a region of interest, a number of seemingly harmless and uninteresting regions, such as railings in the corner of the image, can expand into enormous number of false positive images. To eliminate such a topic drift, we introduce a novel mechanism to detect and eliminate inconsistencies in the retrieved results. A test is performed as an additional spatial verification between result images to ensure that no false positive will be introduced into any expanded query. In the test, an affine transformation Aj,i mapping features from result
6
Andrej Mikul´ık, Filip Radenovi´c, Ondˇrej Chum, Jiˇr´ı Matas
image i to result image j is obtained. In addition, the mappings Aq,i and Aq,j to the query image q estimated in the initial retrieval phase are used. For a consistent pair of result images i and j, it holds Aq,i ≈ Aq,j Aj,i . However, for false positive results caused by repeated patterns or bursty features, the three mappings are typically inconsistent, see Figure 4.
query
result i
result j
Fig. 4: The geometric consistency test. The solid parallelogram in the query image denotes the projected image border of result j through the transformation estimated between the query and result j. The dashed parallelogram in the query image is again the border of result j, now transformed by composition of transformations through result image i. The dashed parallelogram in result i is the transformed image boundary from result j.
3.2
Expansion regions selection
Images obtained by the zoom-in query (with a minimal scale change of 2) are first filtered by geometric verification against the query image. Only images with at least t1 inliers are considered. The estimated mapping of the result images to the query is then used to backproject the images. Consequently, the result images are grouped based on location and scale in the query image. Finally, on each group a geometric consistency test is performed, before the expanded queries are issued. Choice of t1 parameter. The number of matching features as a level of confidence of match correctness has been previously used in query expansion techniques [8]. In our case, when a significant change of scale is required, the parameter t1 can be set much lower than in standard query expansion. It stems from the fact that the number of features exponentially decreases with the scale of the feature – this is caused by the scale dependent non-maxima suppression in the feature detectors. Therefore, the probability of random geometric match is substantially decreased by the requirement of zoomingin. Experimentally, we have found that as little as two consistent features with a query
Efficient Image Detail Mining
7
image (t1 = 2) provides acceptable results. Note that this result is in combination with a large vocabulary (16M visual words) and the novel geometric consistency test among the result images. In our experiments, we set t1 = 4. Result grouping. A simple greedy algorithm is used to group the result images for the hierarchical query expansion. First, a place (a pixel) in the query image covered by the largest number of images is found. The image with the highest estimated scale change covering that pixel is selected as a cluster seed. Images with at least 50% overlap with the seed image are included in the cluster. The cluster is removed and the whole procedure is repeated. Note that unlike in [28], the goal is not to produce an iconic view of the detail, but to group images relevant to that certain detail for the purpose of query expansion. If the size of the cluster is larger than 6 images, the 6 images with the largest scale change are used for the query expansion for efficiency reasons. Each cluster is subject to a geometric consistency test. First, inliers to the geometric transformation Aj,i between image pairs in a cluster are detected. For geometric consistency, at least 50% of those matches need to be consistent with the composite transformation Aj,q Aq,i . If a cluster contains only a single image and the consistency test cannot be evaluated, such a cluster is discarded, unless it has at least t2 geometrically consistent features with the query image and thus small probability of being a false match. In the presented experiments t2 = 8. An example of clusters of geometrically consistent images is shown in Figure 5.
Fig. 5: Groups of spatially verified images selected for further query expansion. The original query is shown in the top-left corner with a blue border.
8
3.3
Andrej Mikul´ık, Filip Radenovi´c, Ondˇrej Chum, Jiˇr´ı Matas
Discussion
The proposed method can be seen as a special type of image clustering. In image clustering, false links can be introduced by users inserting visual tags into their images, as depicted in Figure 6. These links are difficult to detect and complex heuristics are often used. Our approach naturally eliminates such issue, as a large scale change is required, while the tags, no matter how complex, typically have a fixed scale.
Fig. 6: A common issue for image clustering methods. Totally unrelated scenes linked via a graphical tag superimposed over the images.
4
Experiments
A search engine was built on a dataset of 620,000 images downloaded from Flickr, searching for tags of famous landmarks, European countries and cities, and architectonic keywords. 4.1
Dataset preparation
Following the common practice in the recent work on image retrieval, multi-scale Hessianaffine features [17] were detected and described by the SIFT descriptor [15]. The hierarchical two level k-means algorithm with approximate nearest neighbor [20] is used to learn a balanced vocabulary with 16 millions visual words [19]. The vocabulary is learned on all 620,000 images (nearly 1.3 × 10⁹ SIFT descriptors). Mikulik et al. [19] studied the effect of vocabulary size and showed that increasing it boosts the performance of specific object retrieval and that the speed of tf-idf scoring is increased. The speed is significantly increasing up to 16 million visual words with a negligible increase up to 64 million words (the largest size tested). One disadvantage of the large vocabularies – that the resulting search trees are unbalanced – has been addressed by the shallow hierarchical tree proposed in [19]. The second disadvantage is the higher computational complexity of building the large vocabulary. The 16 million visual word dictionary is a compromise between the time required for the offline vocabulary building and performance. According to [19], even larger vocabularies would lead to higher performance. As in [22], feature geometries are compressed. Four bits are allocated for scale and 12 bits for shape compression. The compressed geometries are stored in the inverted file along with the visual words for fast access during DAAT scoring [27].
Efficient Image Detail Mining
9
We have manually annotated results for six different landmarks. As an example of very difficult false positives even for humans, we show a selection of high ranked false positives (Fig. 7) for the Arc de Triomphe query. The false positive images come from the same landmark, just from a different side.
Fig. 7: Some highly ranked false positives for the Arc de Triomphe query (left).
4.2
Scale change
This experiment shows scale change in the highest ranked images for two different settings. The standard retrieval system and our new method with query expansion, designed for discovering as many details as possible, are compared. As it can be seen from Figure 8, our method retrieves a large portion of detailed images. Figure 9 shows that retrieved images from our system are more informative than images from standard retrieval. In case of the Astronomical clock from Figure 1, the displayed images – local maxima in the resolution, are in our method ranked in the first five in comparison to ranks usually above 5000 in standard retrieval. As the length of the shortlist is limited because of efficiency, these images are not even considered for verification and thus are surrounded by false positives.
35 similarity zoom−in + hierarchical QE
30
scale
25 20 15 10 5 0
0
20
40
60
80
100
rank
Fig. 8: Scale change for the 100 top scored images. Comparison of the standard nearest neighbor (most similar) and zoom-in with hierarchical query expansion (QE) methods. The query and the first few results are shown in Figure 9.
10
Andrej Mikul´ık, Filip Radenovi´c, Ondˇrej Chum, Jiˇr´ı Matas
Fig. 9: A comparison of the highest ranked images for two different settings. The query image on the left is used in both cases. The first two rows on the right show top 20 results of the standard nearest neighbor (NN) system optimizing average precision (i.e. similarity). The last two rows show the top 16 images after query expansion of chosen groups of images. Note that while the NN search retrieves many very similar results, the result of our approach is much more informative.
4.3
Maximum scale
Figures 10 and 11 show further examples of very fine details. The maximum scale is typically achieved by images of some interesting detail or eventually by a false match, as shown in Figures 10 and 11. The false matches are rare and are results of the query expansion. The spatial consistency test is not performed on the final results to reduce the response time. On the other hand, the frequency distribution is dominated by a relatively small (and thus not interesting) scale change from the query image. Most of such images show people in front of the landmark with a part of the building in the background. The biggest difference between the location of the details and frequently photographed spots is in the Arc de Triomphe, where many people have their photo taken upwards with the arc above them. Quantitative results are given in Table 1. We summarize results over six different landmark queries. The number of images that were retrieved as details of the landmark showing scale change larger than 3, the value of largest zoom, and the number of false positive images in top 10, 50, and 100 images with largest zoom were recorded. On all landmarks, very fine details were detected with reasonable false positive rates. The three tables compare results for different types of result verification. The most conservative method based on standard spatial verification [24] combined with the proposed geometric consistency of result groups produces very low false positive rates and the lowest number of retrieved images. With the incremental spatial verification (iSP) [7], the number of false positive images has the tendency to increase. This trend is further pronounced when skipping the group geometric consistency test. Speed performance of every stage of the proposed algorithm is recorded in Table 2. Importance of the group consistency test stage is additionally amplified looking at these results. Skipping this stage will not significantly decrease total duration of the query but it will noticeably increase the number of false positives in several queries, i.e. in the Notre Dame and the Arc de Triomphe query (as shown in Table 1).
Efficient Image Detail Mining
11
Table 1: Performance on the six annotated queries with different verification methods. From left to right: query name, the number of retrieved images with zoom larger than 3, the maximum zoom achieved, the number of false positives in top ten, fifty and hundred retrieved images respectively. Standard spatial verification with the proposed geometric consistency test on groups Query NumImgs MaxZoom FP@10 FP@50 FP@100 Astronomical clock 2297 37.33 0 1 3 Sacre Cœur 174 16.47 0 6 16 St. Vitus Cathedral 398 32.64 0 3 8 Sagrada Familia 305 20.27 0 0 0 Notre Dame 510 34.84 0 0 0 Arc de Triomphe 444 27.46 1 9 19 iSP [7] with the geometric consistency test on groups Query NumImgs MaxZoom FP@10 FP@50 Astronomical clock 2564 29.25 3 8 Sacre Cœur 335 21.85 1 8 St. Vitus Cathedral 599 31.16 0 7 Sagrada Familia 348 22.92 0 4 Notre Dame 625 41.47 0 3 Arc de Triomphe 717 28.16 0 18
FP@100 18 20 14 6 11 30
iSP [7] without the geometric consistency test on groups Query NumImgs MaxZoom FP@10 FP@50 FP@100 Astronomical clock 3210 40.29 2 8 14 Sacre Cœur 623 26.71 1 7 20 St. Vitus Cathedral 651 31.16 0 5 17 Sagrada Familia 474 22.92 0 1 4 Notre Dame 777 41.47 6 22 33 Arc de Triomphe 912 28.17 1 22 45
12
Andrej Mikul´ık, Filip Radenovi´c, Ondˇrej Chum, Jiˇr´ı Matas
Sacre Cœur
QUERY
16.5x
13.4x
10.8x
9.9x
9.6x
15x
13x
10x
8x
5x
3x
HRT
8.8x
8.4x
7.6x
FALSE
7.1x
St. Vitus Cathedral
QUERY
32.7x
20.9x
20.3x
19.9x
17.8x
30x
25x
20x
15x
10x
5x
HRT
15.2x
14.1x
13.3x
12.9x
12.3x
Sagrada Familia
QUERY
20.3x
20.2x
20.0x
19.2x
19.1x
16.6x
13.8x
11.6x
19x
16x
12x
9x
6x
3x
HRT
16.5x
16.1x
14.8x
Fig. 10: Results of several queries. Starting with the original query image (top left), the high resolution transform (HRT) (bottom left) is obtained and details are found automatically. The retrieved images (right) with the largest relative scale change (after removal of multiple examples of the same detail).
Efficient Image Detail Mining
13
Notre Dame
QUERY
34.8x
31.6x
23.8x
21.7x
32x
27x
21x
16x
11x
5x
HRT
20.7x
20.2x
19.3x
18.9x
Arc de Triomphe
QUERY
27.5x
26.5x
25.6x
22.8x
FALSE
25x
21x
17x
13x
8x
4x
HRT
17.9x
17.9x
17.0x
FALSE
Astronomical clock
QUERY
21.2x
21.1x
19.2x
18.2x
34x
29x
23x
17x
11x
6x
HRT
17.6x
17.3x
17.2x
17.1x
15.5x
Fig. 11: Results of several queries. Starting with the original query image (top left), the high resolution transform (HRT) (bottom left) is obtained and details are found automatically. The retrieved images (right) with the largest relative scale change (after removal of multiple examples of the same detail). For the Astronomical clock query five images with the largest relative scale change are shown in Figure 1 (right).
14
Andrej Mikul´ık, Filip Radenovi´c, Ondˇrej Chum, Jiˇr´ı Matas
Table 2: Duration of the highest resolution transform (HRT) as a whole and of all the stages on a single 2.6 GHz machine. From left to right: query name, duration of the initial zoom-in query, duration of the grouping stage, duration of the geometric consistency test performed on each group, duration of QE query performed on each group, total duration of the query. Query Zoom-in Grouping Group SP hierQE Astronomical clock 8.2s 4.8s 0.6s 25.0s Sacre Cœur 2.9s 1.1s 0.2s 5.1s St. Vitus Cathedral 8.3s 5.5s 0.7s 16.7s Sagrada Familia 1.6s 0.5s 0.1s 2.8s Notre Dame 10.3s 11.3s 0.8s 14.9s Arc de Triomphe 4.3s 2.8s 0.8s 13.4s
5
Total 38.5s 9.3s 31.2s 5.0s 37.3s 21.3s
Conclusions
A pair of novel problems has been formulated: given a query image, for every pixel, find an image with the maximum resolution depicting it and find the most photographed parts of the image. The solution to the problems relies on a hierarchical query expansion that exploits the DAAT inverted files and a new geometric consistency verification step that is sufficiently robust to prevent topic drift. Experiments show that the false positive rate of the proposed method is well below the level needed for user acceptability and that surprising details on the tested landmarks are found, even those that are hardly noticeable by inspection in the query image. On a single 2.6 GHz machine, the computation of the highest resolution transform takes 5 to 40 seconds depending mainly on the number of relevant images.
Acknowledgement. The authors were supported by the MSMT LL1303 ERC-CZ, GACR P103/12/G084, and SGS13/142/OHK3/2T/13 grants.
References 1. R. Arandjelovic and A. Zisserman. Three things everyone should know to improve object retrieval. In Proc. CVPR, pages 2911–2918, 2012. 2. R. Arandjelovi´c and A. Zisserman. All about VLAD. In Proc. CVPR, 2013. 3. H. Bay, T. Tuytelaars, and L. Van Gool. Surf: Speeded up robust features. In Proc. ECCV, 2006. 4. O. Chum and J. Matas. Large-scale discovery of spatially related images. IEEE PAMI, 32:371–377, 2010. 5. O. Chum and J. Matas. Unsupervised discovery of co-occurrence in sparse high dimensional data. In Proc. CVPR, 2010. 6. O. Chum, J. Matas, and J. Kittler. Locally optimized RANSAC. In Proc. DAGM, 2003.
Efficient Image Detail Mining
15
7. O. Chum, A. Mikulik, M. Perdoch, and J. Matas. Total recall II: Query expansion revisited. In Proc. CVPR, pages 889–896. IEEE Computer Society, 2011. 8. O. Chum, J. Philbin, J. Sivic, M. Isard, and A. Zisserman. Total recall: Automatic query expansion with a generative feature model for object retrieval. In Proc. ICCV, 2007. 9. H. J´egou and O. Chum. Negative evidences and co-occurrences in image retrieval: the benefit of PCA and whitening. In Proc. ECCV, Firenze, Italy, 2012. 10. H. J´egou, M. Douze, and C. Schmid. Hamming embedding and weak geometric consistency for large scale image search. In Proc. ECCV, 2008. 11. H. J´egou, M. Douze, and C. Schmid. On the burstiness of visual elements. In Proc. CVPR, 2009. 12. H. J´egou, M. Douze, C. Schmid, and P. P´erez. Aggregating local descriptors into a compact image representation. In Proc. CVPR, 2010. 13. H. J´egou, H. Harzallah, and C. Schmid. A contextual dissimilarity measure for accurate and efficient image search. In Proc. CVPR, 2007. 14. J. Knopp, J. Sivic, and T. Pajdla. Avoding confusing features in place recognition. In Proc. ECCV, 2010. 15. D. G. Lowe. Distinctive image features from scale-invariant keypoints. IJCV, 60(2):91–110, 2004. 16. K. Mikolajczyk and C. Schmid. Scale & affine invariant interest point detectors. IJCV, 1(60):63–86, 2004. 17. K. Mikolajczyk, T. Tuytelaars, C. Schmid, A. Zisserman, J. Matas, F. Schaffalitzky, T. Kadir, and L. Van Gool. A comparison of affine region detectors. IJCV, 65:43–72, 2005. 18. A. Mikulik, O. Chum, and J. Matas. Image retrieval for online browsing in large image collections. In Similarity Search and Applications, 8199, pages 3–15. Springer Berlin Heidelberg, 2013. 19. A. Mikulik, M. Perd’och, O. Chum, and J. Matas. Learning vocabularies over a fine quantization. IJCV, pages 1–13, 2012. 20. M. Muja and D. G. Lowe. Fast approximate nearest neighbors with automatic algorithm configuration. In VISSAPP, 2009. 21. D. Nister and H. Stewenius. Scalable recognition with a vocabulary tree. In Proc. CVPR, 2006. 22. M. Perdoch, O. Chum, and J. Matas. Efficient representation of local geometry for large scale object retrieval. In Proc. CVPR, 2009. 23. F. Perronnin, Y. Liu, J. Sanchez, and H. Poirier. Large-scale image retrieval with compressed fisher vectors. In Proc. CVPR, 2010. 24. J. Philbin, O. Chum, M. Isard, J. Sivic, and A. Zisserman. Object retrieval with large vocabularies and fast spatial matching. In Proc. CVPR, 2007. 25. J. Philbin, O. Chum, M. Isard, J. Sivic, and A. Zisserman. Lost in quantization: Improving particular object retrieval in largescale image databases. In Proc. CVPR, 2008. 26. J. Sivic and A. Zisserman. Video google: A text retrieval approach to object matching in videos. In Proc. ICCV, pages 1470 – 1477, 2003. 27. H. Stew´enius, S. H. Gunderson, and J. Pilet. Size matters: exhaustive geometric verification for image retrieval. In Proc. ECCV, pages 674–687. Springer, 2012. 28. T. Weyand and B. Leibe. Discovering details and scene structure with hierarchical iconoid shift. In Proc. ICCV. IEEE, 2013. 29. S. Winder, G. Hua, and M. Brown. Picking the best daisy. In Proc. CVPR, 2009.