Dec 4, 2014 - example, is going to measure the ellipticity and the redshift of billions of galaxies, providing us with a ... [1, 27]. To make forecasts on the constraints expected for these parameters, and ... space of a given cosmological model. In particular ..... We will now describe how we determine kmax at each time step.
Efficient implementation of the Time Renormalization Group Adrian Vollmer and Luca Amendola Institut f¨ ur Theoretische Physik, Ruprecht-Karls-Universit¨ at Heidelberg, Philosophenweg 16, 69120 Heidelberg, Germany
Riccardo Catena
arXiv:1412.1650v1 [astro-ph.CO] 4 Dec 2014
Institut f¨ ur Theoretische Physik, Georg-August-Universit¨ at G¨ ottingen, Friedrich-Hund-Platz 1, 37077 G¨ ottingen, Germany The Time Renormalization Group (TRG) is an effective method for accurate calculations of the matter power spectrum at the scale of the first baryonic acoustic oscillations. By using a particular variable transformation in the TRG formalism, we can reduce the 2D integral in the source term of the equations of motion for the power spectrum into a series of 1D integrals. The shape of the integrand allows us to pre-compute only thirteen antiderivatives numerically, which can then be reused when evaluating the outer integral. While this introduces a few challenges to keep numerical noise under control, we find that the computation time for nonlinear corrections to the matter power spectrum decreases by a factor of 50. This opens up the possibility to use of TRG for mass production as in Markov Chain Monte Carlo methods. A Fortran code demonstrating this new algorithm has been made publicly available.
2 I.
INTRODUCTION
Future observations of the large scale structure of the Universe are expected to place constraints on cosmological parameters of fundamental importance. The ESA spacecraft Euclid [5, 29], for example, is going to measure the ellipticity and the redshift of billions of galaxies, providing us with a measurement of the weak lensing convergence power spectrum, which is sensitive to currently unknown dark energy parameters [1, 27]. To make forecasts on the constraints expected for these parameters, and to interpret real data in the future, we typically need to sample the convergence power spectrum, and thus the matter power spectrum, at many different points in the parameter space of a given cosmological model. In particular, we need the matter power spectrum at scales and redshifts where nonlinear corrections to the fluid equations become important. Methods to calculate the matter power spectrum in the nonlinear regime of cosmic perturbations are hence of prime importance. The mildly nonlinear cosmic scales are of particular interest in the study of models beyond ΛCDM, as they correspond to the first baryonic acoustic oscillations (BAO) probed by Euclid. There are complementary strategies to compute the matter power spectrum down to redshift zero at these relatively small scales. These include using a phenomenological fitting function as in [23] and performing N -body simulations. However, those methods have significant drawbacks. N -body simulations require a large amount of CPUs and memory and are still too time consuming to be practical in statistical parameter inference, where typically hundreds of thousands combinations of parameter choices are needed. Fitting functions are not based on first principles and are quite limited in regard to applicable cosmological models. Another way to obtain the matter power spectrum at the BAO scale is to solve the fluid equations perturbatively. Significant progress has been made in this context in the last few years. As a result, the limitations of Standard Perturbation Theory (SPT) (see [13] for an extensive review) have become increasingly more clear [19]. In SPT, perturbative corrections to the matter power spectrum of different order in the density contrast are of comparable size on nonlinear scales and can have opposite signs, with significant cancellations among different terms in the perturbative expansion [19]. This “instability” of the theory implies poor convergence properties for the perturbative series: many terms in the perturbative expansion of the matter power spectrum have to be considered in order to obtain an accurate prediction. In Renormalized Perturbation Theory (RPT) [19, 20], the SPT perturbative expansion of the power spectrum is reorganized by resumming an infinite class of terms in the perturbative series through a diagrammatic approach. As a result, in RPT the perturbative series is composed of positive terms only, and successive perturbative corrections to the matter power spectrum dominate at increasingly smaller scales. Thereby, in RPT the perturbative series converges much more efficiently than in SPT, and just few terms are required in order to accurately predict the matter power spectrum on mildly nonlinear scales [21]. The ability of RPT in fitting results of N -body simulations has motivated the exploration of similar resummation schemes. The Time Renormalization Group (TRG) approach [38], for instance, is a resummation scheme widely explored in the past few years. It resums all perturbative corrections to the matter power spectrum in which the so-called “interaction vertex”, i.e. a matrix encoding the coupling of different physical scales induced by nonlinear effects, is kept at its tree level form. In contrast to other methods, the TRG approach has the advantage of evaluating the time dependence of the matter power spectrum exactly through a set of differential equations in the time variable. In addition, it can be easily applied to a broad class of cosmological models [32, 41]. Alternative resummation schemes rely on renormalization group equations [35], effective field theory methods [11, 18, 37], multi-propagator expansions [14, 15], the eikonal approximation [16], and Lagrangian perturbation theory [12, 36]. Recently, the possibility of combining perturbation theory with N -body simulations has also been explored [34, 39].
3 While existing numerical implementations of the TRG are already many orders of magnitudes faster than N -body simulations, it is still not quite there for practical applications. Their runtime is of the order of one hour on a typical desktop machine, which makes extensive explorations of multidimensional parameter spaces unfeasible. As we will show in this article, we managed to exploit a feature of the integrand in the source term of the TRG equations that enables us to reduce the runtime to less than a minute or even a few seconds, depending on the CPU power of the computer. This opens up the possibility of using higher order perturbation theory, and the TRG, for applications like weak lensing Fisher matrix analysis, and Markov Chan Monte Carlo (MCMC) explorations of models beyond ΛCDM. Efficient numerical implementations of other resummation schemes can be found in [22, 44]. The paper is structured as follows. In section II, we briefly review the TRG framework as described in [38] and outline the derivation of the TRG equations. We elaborate on the problems involved with implementing a numerical algorithm that solves the TRG equations and how to solve them in section III. Section IV contains a comparison with existing implementations in Copter [17] and an older version of Class [7] as well as N -body simulations. Finally, we present our conclusions in section V. The Fortran code implementing this method, which we call trgfast, can be downloaded at https://gitub.com/User0815/trgfast. II.
REVIEW OF TRG
The goal is to solve the fluid equations, ∂δm ~ + ∇ · ((1 + δm )~v ) = 0 , ∂τ ∂~v ~ v = −∇φ ~ , + H(~v + [A~v ]) + (~v · ∇)~ ∂τ 3 2 H Ωm (δm + [Bδm ]) = ∇2 φ , 2
(1) (2) (3)
which consist of the continuity equation, the Euler equation, and the Poisson equation, respectively. Here, δm is the matter density contrast, ~v the comoving velocity field, Ωm the time dependent average matter density in units of the critical density, and φ the Newtonian gravitational potential. The brackets denote convolution. Note the presence of two extra terms that allow for more general cosmological models, represented by the functions A(~k, τ ) and B(~k, τ ). These are always nonzero when the geodesics of particles are modified, for example in Brans-Dicke cosmologies [38], massive neutrinos [6, 31], etc. As usual in cosmological perturbation theory, we define the velocity ~ · ~v and neglect the vorticity ∇ ~ × ~v . divergence θ = ∇ Writing the fluid equations in Fourier space yields Z ∂δm (~k, τ ) + θ(~k, τ ) + d3 ~qd3 p~ δD (~k − ~q − p~)α(~q, p~)θ(~q, τ )δm (~ p, τ ) = 0 , (4) ∂τ ∂θ(~k, τ ) 3 + H(1 + A(~k, τ ))θ(~k, τ ) + H2 (1 + B(~k, τ ))Ωm (τ )δm (~k, τ ) ∂τ 2 Z + d3 ~qd3 p~ δD (~k − ~q − p~)β(~q, p~)θ(~q, τ )θ(~ p, τ ) = 0 , (5) where the nonlinearity is encoded in the two mode coupling terms, (~k1 + ~k2 ) · ~k2 α(~k2 , ~k1 ) ≡ , k22
(~k1 + ~k2 )2~k1 · ~k2 β(~k2 , ~k1 ) ≡ . 2k12 k22
(6)
4 These equations are often written in a more compact way by defining the doublet ! ! ~ ϕ1 (~k, η) δ ( k, η) m ≡ e−η , ϕ2 (~k, η) −θ(~k, η)/H
(7)
where η is the e-folding time, defined as a . (8) aini The initial scale factor is arbitrary in principle, but should be chosen to be well inside the linear regime. Typical are values that correspond to a redshift between z = 35 and z = 100. We also define a matrix that encapsulates the background evolution as � � 1 −1 Ω(~k, η) = . (9) 0 ~ − 23 Ωm (η)(1 + B(~k, η)) 2 + H H + A(k, η) η ≡ log
These definitions allow us to write eqs. (4) and (5) in the form
∂η ϕa (~k, η) = − Ωab (~k, η)ϕb (~k, η) Z η d3 ~qd3 p~ γabc (~k, −~ p, −~q)ϕb (~ p, η)ϕc (~q, η) , +e
where the non-vanishing components of the vertex function γabc read 1 γ121 (~k, p~, ~q) = δD (~k + p~ + ~q)α(~ p, ~q) , 2 γ222 (~k, p~, ~q) = δD (~k + p~ + ~q)β(~ p, ~q) , γ121 (~k, p~, ~q) = γ112 (~k, ~q, p~) .
(10)
(11) (12) (13)
Now we can write down an infinite series of equations that give us the evolution of the power spectrum of ϕa . They can be obtained by applying the product rule on the left-hand-side and plugging in eq. (10). When suppressing the momentum dependence (integration over ~q and p~ is understood), we get ∂η hϕa ϕb i = − Ωac hϕc ϕb i − Ωbc hϕa ϕc i
+ eη γacd hϕc ϕd ϕb i + eη γbcd hϕa ϕc ϕd i ,
∂η hϕa ϕb ϕc i = − Ωad hϕd ϕb ϕc i − Ωbd hϕa ϕd ϕc i − Ωcd hϕa ϕb ϕd i + eη γade hϕd ϕe ϕb ϕc i + eη γbde hϕa ϕd ϕe ϕc i + eη γcde hϕa ϕb ϕd ϕe i ,
∂η hϕa ϕb ϕc ϕd i = · · · .. .
(14)
The definition of the power spectrum Pab (~k, η), the bispectrum Babc (~k, ~q, p~, η) and the connected part of the trispectrum Qabcd (~k, ~q, p~, ~r, η), respectively, is hϕa (k, η)ϕb (q, η)i ≡ δD (k + q)Pab (k , η) ,
hϕa (k, η)ϕb (q, η)ϕc (p, η)i ≡ δD (k + q + p)Babc (k, q, p; η) , hϕa (k, η)ϕb (q, η)ϕc (p, η)ϕd (r, η)i ≡
[δD (k + q) δD (p + r)Pab (k , η)Pcd (p , η) + δD (k + p) δD (q + r)Pac (k , η)Pbd (q , η) + δD (k + r) δD (q + p)Pad (k , η)Pbc (q , η) + δD (k + p + q + r) Qabcd (k , q , p , r , η)] .
(15)
5 The four-point function is partially written in terms of the two-point functions by using the Wick theorem, but since we allow for a non-zero bispectrum, the field ϕa does not need to be Gaussian [10]. The approximation we make in TRG is to set Qabcd = 0. This closes the system of equations for the evolution of the power spectrum and from eq. (10) we get ∂η Pab (~k, η) = − Ωac (~k, η)Pcb (~k, η) − Ωbc (~k, η)Pac (~k, η) Z h + eη d3 ~q γacd (~k, −~q, ~q − ~k)Bbcd (~k, −~q, ~q − ~k; η) i +Bacd (~k, −~q, ~q − ~k; η)γbcd (~k, −~q, ~q − ~k, η) ,
(16)
∂η Babc (~k, −~q, ~q − ~k; η) = − Ωad (~k, η)Bdbc (~k, −~q, ~q − ~k; η) − Ωbd (−~q, η)Badc (~k, −~q, ~q − ~k; η)
− Ωcd (~q − ~k, η)Babd (~k, −~q, ~q − ~k; η) h + 2eη γade (~k, −~q, ~q − ~k)Pdb (~q, η)Pec (~k − ~q, η) + γbde (−~q, ~q − ~k, ~k)Pdc (~k − ~q, η)Pea (~k, η) i + γcde (~q − ~k, ~k, −~q)Pda (~k, η)Peb (~q, η) .
(17)
However, the equations in this form are unsuitable for numerical computation, mainly because the bispectrum depends on three momenta, which would require a large 3D array to store in memory. Rewriting eqs. (16) and (17) to reflect the isotropy of the Universe, we get ∂η Pab (k, η) = − Ωac (k, η)Pcb (k, η) − Ωbc (k, η)Pac (k, η) Z ∞ Z q h η 4π ˜bcd (k, q, p; η) +e q dq p dp γ˜acd (k, q, p)B k k/2 |q−k| i ˜acd (k, q, p; η)˜ +B γbcd (k, q, p) ,
(18)
where we defined
γ˜abc (k, q, p) ≡ γabc (~k, ~q, p~)|p~=−(~k+~q)
(19)
˜abc (k, q, p). The vertex functions are then equivalent to and analogously for B q 2 + k 2 − p2 , 4q 2 k2 γ˜222 (k, q, p) = 2 2 (k 2 − p2 − q 2 ) . 4p q γ˜121 (k, q, p) =
(20) (21)
Since here we are not actually interested in the bispectrum, and two out of the three momenta on which the bispectrum depends on are integrated out in eq. (18), we can do the same integration on both sides of eq. (17). Then it becomes convenient to define a quantity that directly depends on the bispectrum, Z ∞ Z q i 1h ˜bef (k, q, p) + (q ↔ p) , Iacd,bef (k) ≡ dq q dp p γ˜acd (k, q, p)B (22) 2 k/2 |q−k|
6 such that eqs. (17) and (18) can be written as 4π [Iacd,bcd (k) + Ibcd,acd (k)] k ∂η Iacd,bef (k) = − Ωbg Iacd,gef (k) − Ωeg Iacd,bgf (k) ∂η Pab (k) = − Ωac Pcb (k) − Ωbc Pac (k) + eη
− Ωf g Iacd,beg (k) + 2eη Aacd,bef (k) .
(23) (24)
Here, we defined another quantity: the source term Z ∞ Z q 1 Aacd,bef (k) ≡ dq q dp p {˜ γacd (k, q, p) [˜ γbgh (k, q, p)Pge (q)Phf (p)+ 2 k/2 |q−k| γ˜egh (q, p, k)Pgf (p)Phb (k) + γ˜f gh (p, k, q)Pgb (k)Phe (q)] + (q ↔ p)} . At this point we also define the integrand of the outer integral via Z ∞ Aacd,bef (k) ≡ dq Kacd,bef (k, q) ,
(25)
(26)
k/2
which will become convenient in the next section. In the original paper [38], it is recommended to perform a transformation of variables to make the integral limits of the inner integral independent of the integration variable q, but as we will see it is beneficial to keep the shape of Aacd,bef as in eq. (25). After considering all index symmetries of Aacd,bef , it can be deduced that there are only 14 non-vanishing, independent components. Together with the three independent components of Pab , this means that there are 17 independent equations in total in the system eqs. (23) and (24).
III.
IMPLEMENTATION
The integral in eq. (25) clearly provides the bottleneck when solving eqs. (23) and (24), as it represents the nonlinear part in an otherwise regular system of ordinary differential equations. Performing the 2D integral is quite costly in terms of CPU time. However, a close inspection of the integral in eq. (25) (after expanding it with the help of Mathematica) shows that the integrand can be written in terms of only 13 expressions, which we will call moments, of the shape pm Pab (p) ,
(27)
with a pre-factor that depends only on q, k and η. Here, m is an integer out of the set −3, −1, 1, 3, 5. The third term in eq. (25) can even be integrated analytically, as it does not depend on Pab (p) and the vertex function γ˜f gh (p, k, q) is a rational function of p. This allows us to separately perform the p-integration first and then do the q-integration, reducing the 2D integral into a relatively small number of 1D integrals. However, not only do we have to compute the antiderivatives of the 13 moments, we also need to compute the difference of these antiderivatives at q and |q − k|. Differences between two terms are notoriously difficult to compute when the terms are almost equal. This problem is amplified by the fact that all nonanalytic quantities (such as the power spectrum) are represented by cubic splines when numerically evaluating the expressions considered here. Since there are terms containing up to seventh powers of q, even small finite differences between terms that should cancel exactly become very significant. To avoid the amplification of numerical artifacts, we use the following techniques.
7 A.
Spline integration
When performing numerical calculations, any function that does not have an analytic expression (such as the power spectrum) is typically given by an ordered set of tuples, which we will call the sampling points. If such a function is to be evaluated between two sampling points, we can only approximate the true value of the function at that value by interpolating it. In this application, we choose natural cubic splines. Thus, the moments are the product of a power of p and a function given by cubic splines. We found that we get the least amount of numerical noise if we interpolate the power spectrum in log-log-space, i.e. instead of P (k) we actually interpolate log P (exp(x)) with x = log k. This means we need to take the logarithm of the wavenumber when evaluating the interpolated power spectrum and apply the exponential function to the result. While this leads to many calls to the exp and log functions and to an increase in CPU time, it is necessary to make the code more stable. However, when integrating the moments, we found it is best to interpolate P (exp(x)), as this enables us to perform the integration analytically in each spline interval. The integration constant for each interval needs to be chosen such that the result is continuous at the sampling points. The integration constant for the first interval is arbitrary in principle, but in a numerical context this choice can be crucial. In our case, the integration constant can be chosen such that the integrated moment goes to zero either for small k or for large k, depending on the value of m. By doing so, we avoid nonzero asymptotes, which tend to lead to catastrophic cancellation when subtracting two values of the antiderivative from each other. “Catastrophic cancellation” refers to the loss of precision when numerically computing differences of nearby values. By choosing the integration constant such that the antiderivative of a moment is zero at the first sampling point for m ≤ 1 and zero at the last sampling point otherwise, the numerical noise in the time evolution of the power spectrum reduces substantially.
B.
Custom sampling
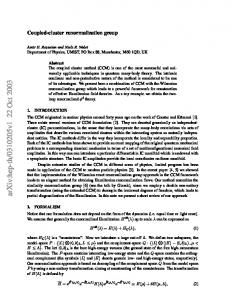
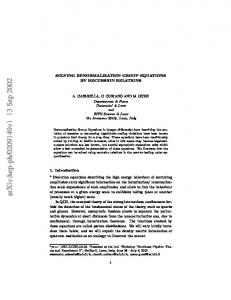
After computing the antiderivatives numerically, all that is left to do is to perform the qintegration in eq. (25). Since the general shape of the integrands is always the same, it is possible to use the simple trapezoidal rule instead of an adaptive integration algorithm. The disadvantage is that we have no error estimate on the result of the integration, but at the same time it is faster to apply the trapezoidal rule. To ensure we achieve sufficient accuracy, we verify the final result by comparing it to the power spectrum obtained from both Class and N -body simulations (see section IV). When plotting the integrands for different k (fig. 1), we can observe that they are all wellbehaved for low k, but start to look increasingly similar to the function f (q) = 1/(k − q) as k enters the nonlinear regime. Note, however, that the function is continuous at all times and does have a zero near q = k, it just changes its sign very rapidly. Since a lot of cancellation happens in this region, it is important that we make sure to get an accurate estimate of the integral there. We use the knowledge we have about the shape of the integrand to restrict the sampling scheme to two classes depending on some threshold kth : For k < kth we use logarithmically equidistant points between k/2 and kmax (the maximum wavenumber at which the power spectrum is defined), and for k > kth we first translate the function to the left by transforming q → q − k. Then we use logarithmically equidistant points from 0 to −k/2 and from 0 to kmax − k before undoing the transform. We refer to these sampling schemes as “asymmetric scheme” and “symmetric scheme” respectively. This way the sampling density is much higher where the curvature of the integrand is large, yielding a good approximation of the real value of the integral. Of course, a suitable value for the threshold kth needs to be determined empirically.
8
·10−7
k = 10−3
·10−3
Ki (q) [au]
Ki (q) [au]
0
−2
10−3 10−2 10−1
100
k = 10−2
0
−1
10−2
101
10−1
100
q [h/Mpc]
q [h/Mpc]
k = 10−1
k = 100
101
0.1
Ki (q) [au]
Ki (q) [au]
0.05 0
−0.1
0
−0.1 10−1
100
101
100
q [h/Mpc]
k = 101
0 −2 −4
101
k = 102
·10−3
2
102
q [h/Mpc]
Ki (q) [au]
Ki (q) [au]
4
·10−2
101
5 0 −5
102
102
q [h/Mpc]
103
q [h/Mpc]
Figure 1. All 14 integrands (in arbitrary units) after carrying out the p-integration at different values for k. As k increases, the integrands approach a function with a vertical asymptote and a singularity at k.
C.
Cutoff method
Since the upper limit of the integral in eq. (26) is infinity, we would have to evaluate the antiderivatives outside of their domain. There are a few options on how to account for this: Setting the power spectrum to zero, keeping it constant after the last defined sampling point, or extrapolating it smoothly via a power law or exponential law. We found that the type of extrapolation has no major impact on the final result. Another issue are numerical instabilities, which cause the UV end of the power spectrum to oscillate. As soon as these oscillations are introduced, they quickly amplify and cause one of the
9 three power spectra to take on negative values. Even when these oscillations are absent, as the power spectrum evolves, the P22 component takes on very small values, approaching zero as the time evolution progresses. These numerical artifacts are the manifestation of a limitation of the fluid equation themselves, which neglect the vorticity of the velocity field and the velocity dispersion [40, 45]. To work around these issues, we decrease the maximum wavenumber kmax at which the power spectrum is defined as the time η increases. The authors of [7] did it for Class by employing a technique they call “double escape”, which essentially consists of throwing out the last four points in each time step. In our implementation, however, it is handled differently, since the number and positions of the sampling points are given by the user. After all, if the algorithm works in a stable way for one set of sampling points, it should yield the same result if the density of the sampling points is doubled, for instance, which would not be the case if we would only throw out the last two sampling points in each time step. We will now describe how we determine kmax at each time step. First we tackle the numerical noise. Since we want to avoid uneven behavior such as oscillations and kinks in the power spectrum, we discard sampling points at the UV end one by one until the curvature between the last three sampling points of all three components varies only by a limited amount. This happens at each time step. Conveniently, the coefficient of the quadratic term in the splines gives a good measure of the curvature. In particular, we demand that the standard deviation of the coefficients of the quadratic term in the last two spline intervals of all three components of the power spectrum does not exceed a certain limit σc . The other issue of one of the power spectrum components becoming negative can be avoided by imposing that the magnitude of the slope at the UV end of P22 (k) stays below another limit, which we will call s22 . The optimal values for σc and s22 have been determined in empirically. During the time evolution, we then simply set ∂η Pab (k) = 0
(28)
∂η Iacd,bef (k) = 0
(29)
and
if k > kmax , which takes these scales effectively out of the equation. This cutoff method appears to lead to a stable time evolution without discarding too much information. At the last time step, when η corresponds to z = 0, we typically have kmax ≈ 0.8h/Mpc. IV. A.
ANALYSIS
Class and Copter
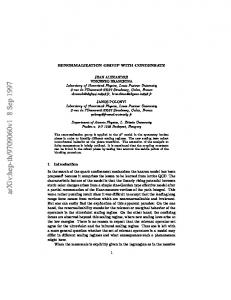
We ran the code for a flat ΛCDM Universe with Ωm = 0.3175, Ωb = 0.0490, h = 0.6711, σ8 = 0.8344, ns = 0.9624. The initial linear power spectrum was obtained from Class and the initial redshift is zini = 100. Since Class (we use version 2.0) implemented the same algorithm similarly, we expect to get identical results, and we can in fact observe that the results are reproduced almost exactly (less than 1% difference), as can be seen in fig. 2. Thus, the entire analysis in [7] applies to our code as well. However, we would expect the difference to vanish completely in the linear regime, which is not the case here: Even at k = 0.01h/Mpc the relative difference is around 0.1%. This appears to
|Ptrg (k)/Pclass (k) − 1|
10
10−2
10−3
10−4
10−4
10−3
10−2
� � k h Mpc−1
10−1
Figure 2. The nonlinear power spectrum computed by trgfast at z = 0 compared to the one computed by Class. Both agree up to 1%.
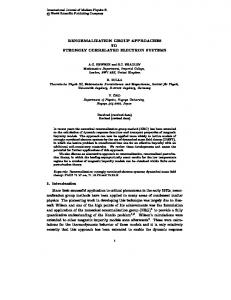
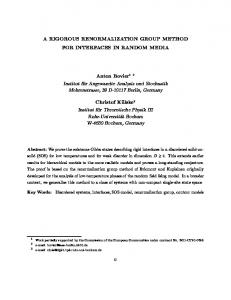
be an issue from the Class implementation, since their own nonlinear power spectrum does not perfectly match their linear power spectrum at low wave numbers. Comparing the runtime of trgfast and Class shows an improvement of a factor of 50 on a common dual-core desktop machine. While the Class implementation parallelizes on up to 14 cores, the runtime of trgfast has been shown to be inversely proportional to the number of cores n until at least n = 24 and is expected to be able to use even more cores than that efficiently. Another implementation of TRG can be found in the project Copter (we use version 0.8.7). Copter is a C++ library developed by [17] where a number of algorithms from different kinds of perturbation theory are implemented, including SPT, RPT, LPT, and TRG, the latter being referred to as “FWT” (as in “Flowing With Time”, the title of [38]). The TRG implementation is very straight forward, resulting in run times of the order of 30 minutes on a typical dual-core machine despite running in parallel. However, it needs to be noted that Copter imposes an additional symmetry, resulting in only 12 instead of 14 independent equations. This is not mentioned in the accompanying paper, but only in the source code as a comment in the file FlowingWithTime.cpp: It’s not obvious from the definition that Iacd,bef (k) is symmetric in its last two indices ef . This result follows from the fact that it is initially symmetric (Iacd,bef = 0 at η = 0) and the equations of motion preserve this symmetry. This statement appears to be incorrect, considering that the equations of motion only preserve this symmetry if Aacd,bef preserves it, which is only the case if P11 = P12 = P22 . Since the power spectra are only approximately equal in the linear regime, the symmetry is broken at later times. Indeed, the resulting nonlinear corrections differ if this symmetry is assumed. In order to still be able to compare the results, we created an option to enforce this symmetry in our code. Figure 3 shows that the result from trgfast agrees with the result from Copter at the 3.5% level. This discrepancy may stem from the difference in power spectrum extrapolation, cutoff method or numerical noise in either Copter’s code or our code. An overview of the nonlinear power spectrum at z = 0 obtained from different sources can be seen in fig. 4. We notice three pairs of curves: Unsurprisingly, the Halofit corrections match N -body
11
|Ptrg (k)/Pcopter (k) − 1|
·10−2
3
2
1 10−2
10−1
� � k h Mpc−1
100
Figure 3. The nonlinear power spectrum computed by trgfast at z = 0 compared to the one computed by Copter. The power spectra agree up to 3.5%.
simulations very well by design even in highly nonlinear scales. The other two pairs correspond to the power spectrum computed by using the TRG algorithm with and without enforcing the extra symmetry. Our code can match either curve well while surpassing the maximum wave number of Class by more than a factor of 2. For completeness we also included the output from Coyote [24–26, 30], which interpolates several N -body simulations for a ΛCDM Universe. B.
N -body simulations
Short of actual data, N -body simulations are the best source of the nonlinear power spectrum in different cosmological models. We will use them to verify the correctness of our implementation and demonstrate the general capabilities of the TRG technique. 1.
ΛCDM
The first choice for a comparison with N -body data is the classic flat ΛCDM model. We use the data that has been computed by [42] for the redshifts z = 3, 2, 1, 0.5, 0.3, 0 based on the Wilkinson Anisotropy Probe 7 yr (WMAP7) parameters1 [28]. They ran Gadget2 [43] with 10243 particles in boxes with sides 1h−1 Gpc. To estimate the uncertainty of the power spectrum, 30 realizations of the initial conditions based on a linear power spectrum from CAMB [33] were made. Figure 5 shows their result together with the trgfast power spectrum for the redshifts mentioned above, both divided by a no-wiggle power spectrum [23]. In fig. 6, we plotted k% as a function of the redshift, where k% (z) is defined as the wavenumber where the two power spectra at that redshift first diverge by more than a given percentage. In the case of z = 0.5, the power spectra match so well that k% would be unreasonably large, so we omitted that case. The TRG result matches the N -body data well until the redshift becomes smaller than unity. This is consistent with [7, fig. 7]. 1
Ωm = 0.265, Ωb = 0.0448, h = 0.71, σ8 = 0.80, ns = 0.963
12
4.5 4
P (k)/Pnw (k)
3.5 Copter
3
TRG-12
2.5 2
TRG-14 Class
Coyote
1.5
Halofit 1 0
0.1
0.2
0.3
� � k h Mpc−1
0.4
0.6
TRG-12
2
P (k)/Pnw (k)
0.5
TRG-14 Copter
1.8 1.6
Class
1.4 Coyote Halofit
1.2 1 0.05
0.1
0.15
�
k h
0.2
Mpc−1
�
0.25
0.3
0.35
Figure 4. A comparison of the power spectrum at z = 0 obtained from different sources divided by a linear no-wiggle power spectrum from [23]. The sources are Coyote (blue, thick), trgfast with only 12 independent equations (TRG-12, red), Copter (green, dashed), trgfast with all 14 equations (TRG-14, purple), Class (black, dashed), Halofit (orange, dashed), and the linear power spectrum (gray). The bottom panel is simply a zoomed-in view on the BAO scale.
After all, trgfast computes the same quantity as Class with great precision, as has been shown in the previous section. It is somewhat surprising that all three curves in fig. 6 decrease at z = 3, since we would expect the power spectra to agree better at higher redshifts, meaning that k% would strictly increase. However, this is in line with fig. 8, where the growth functions from trgfast and N -body are compared and the largest discrepancy is for large redshifts. Of course, that figure is for coupled
13 1.2
1
z=3 1.2
1
z=2 1.4
P (k)/Pnw (k)
1.2 1
z=1
2 1.5 1 2
z = 0.5
1.5 1 2
z = 0.3
1.5 1
z=0 0
0.05
0.1
0.15
0.2
0.25
0.3
0.35
0.4
0.45
k [h/Mpc]
Figure 5. Comparison of the trgfast result with ΛCDM N -body data [42] for different redshifts. Each power spectrum has been divided by a no-wiggle spectrum from [23]. Agreement is good for redshift z = 1 and higher, then some discrepancy is noticeable just as in [7, fig. 7]. Note the difference in the scale of the y direction for some panels!
quintessence and not ΛCDM (the linear growth function from [42] is unfortunately not available), but qualitative differences to the ΛCDM case are unexpected. Ultimately, this comes down to the fact that by design the growth functions match exactly at z = 0, so that any possible deviations have to be at larger redshifts.
14
3% k% [h/Mpc]
0.8
2%
0.6
1%
0.4 0.2 0
0.5
1
1.5
2
2.5
3
z
Figure 6. These curves indicate at which wave number k% the power spectra from trgfast and ΛCDM N -body simulations [42] start to deviate by more than 1%, 2%, and 3% for each redshift. We left out the case for z = 0.5 because the power spectra coincidentally agree too well to have a meaningful value for k% here. 2.
Coupled Quintessence
Since one of the advantages of TRG is the flexibility in regard to cosmological models, we are interested in its performance for models other than ΛCDM. For a first nonstandard cosmological model, we choose the coupled quintessence (CQ) model [2, 3, 46]. Here, a scalar field φ couples to ordinary matter via an extra term in the Langrangian of the form −m2ψ exp(−Cφ/Mp2 )∂µ ψ∂ µ ψ , where ψ is the ordinary matter field and C the coupling constant. The Planck mass is Mp2 ≡ 8πG. Let us consider the energy-momentum tensor Tµν(φ) for the field and Tµν(m) for matter. Their sum needs to be locally conserved, such that we could have µ ∇µ Tν(φ) = −CTm ∇ν φ,
µ ∇µ Tν(m) = +CTm ∇ν φ .
Other, more complicated couplings are also possible, but this is the simplest one and the one we will be considering here. For convenience, the coupling constant is redefined as β≡
r
3 Mp C . 2
As mentioned above, the potential is assumed to read V (φ) = V0 e−
√
2/3αφ/Mp
with the potential parameter α. The evolution of the background functions are derived by [4]. Using the notation from section II, we can identify A = −2β
p Ωkin ,
4 B = β2 , 3
15
Ptrg (k)/PCQ (k)
1.8 1.6 1.4 1.2 1 0.8 0
0.1
0.2
�
k h
0.3
Mpc−1
�
0.4
Figure 7. The relative difference of the nonlinear power spectrum obtained from trgfast and from CoDECS at z = 0 in the coupled quintessence case. The difference is comparable to the ΛCDM case.
such that the background functions in eq. (9) take the form � � 3 4 2 Ω21 (a) = − Ωm (a) 1 + β 2 3 p ∂ log H(a) Ω22 (a) = 3 + − 2β Ωkin (a) . ∂ log a
(30) (31)
Note that technically we should also include the term [38]
lin B(~k, τ ) = ΩDE δilin /(Ωm δm ),
however, we will neglect this term since the quintessence perturbations are much smaller than the matter perturbations and they are not included in the N -body simulation either. Several large N -body simulations have been performed using the CQ model with different coupling strengths and different potentials as part of a project called “CoDECS”2 [8, 9]. It uses a modified version of Gadget-2 [43] and features a box size of L = 80h−1 Mpc and 2×5123 particles. The data set we will be using from CoDECS has the label “EXP003-L”. Here, the coupling constant is β = 0.15 and the potential parameter is α = 0.1. We ran the code with the initial linear power spectrum from CoDECS and the background functions from above. We also use the additional index symmetry discussed above. The results are displayed in fig. 7, where the ratio of the nonlinear power spectrum from trgfast and the N -body simulation has been plotted, both at redshift z = 0. Unfortunately, the CoDECS data do not include error bars on the power spectrum. However, N -body simulations naturally cannot constrain the power spectrum very well on large scales due to their finite volume. This is why we see large fluctuations for low k in fig. 7. On larger scales, we have a discrepancy of up to 20%. Figure 8 shows the comparison of the growth functions. They agree at the 1% level for all relevant redshifts, which gives reason to believe that the background evolution was implemented correctly and that the 20% discrepancy in the power spectrum has to come from the nonlinear corrections. The difference is comparable to the one for the ΛCDM case. 2
Simulation data publicly available at http://www.marcobaldi.it.
|GCQ (z)/Gtrg (z) − 1|
16
10−2 10−3 10−4 10−5 0
20
40
60
80
100
z
Figure 8. The relative difference of the growth function obtained from trgfast and from CoDECS. The discrepancy is less than 2% for all relevant redshifts.
V.
CONCLUSION
The TRG framework is one flavor of cosmological perturbation theory that is applicable to a wider range of models compared to previous perturbation theories. We showed how we can manipulate the integrand in the integral that represents the bottleneck of the computation to reduce the 2D integral into a series of 1D integrals, yielding a speedup of a factor of 50. The trick consists of expanding the integrand and identifying terms of the shape k m P (k), which we call the moments. After semi-analytically integrating the moments, their antiderivative can be used to perform the first integration. The resulting expressions are quite unwieldy and their representation in the code has been generated automatically by using Wolfram Mathematica. We ensured the correctness of the code by comparing the output with the one obtained from Class and Copter as well as N -body simulations in the case of ΛCDM and coupled quintessence. The maximum wavenumber at which nonlinear corrections can be produced tends to be higher than that of the other two projects, but the results are not reliable beyond the BAO scale. The code has been released in the public domain and is ready to be used in other projects.
VI.
ACKNOWLEDGMENTS
A.V. and L.A. acknowledge the support from DFG through the project TRR33 “The Dark Universe”. R.C. acknowledges partial support from the European Union FP7 ITN INVISIBLES (Marie Curie Actions, PITN-GA-2011-289442) and a start-up grant funded by the University of G¨ottingen.” We also thank Massimo Pietroni for useful discussions.
[1] Amara, A. and R´efr´egier, A. “Optimal Surveys for Weak-Lensing Tomography.” Monthly Notices of the Royal Astronomical Society, 381 (2007)(3), 1018. [2] Amendola, L. “Coupled Quintessence.” Physical Review D, 62 (1999)(4), 43511. [3] Amendola, L. “Perturbations in a coupled scalar field cosmology.” Monthly Notices of the Royal Astronomical Society, 312 (2000)(3), 521.
17 [4] Amendola, L. “Linear and Nonlinear Perturbations in Dark Energy Models.” Physical Review D, 69 (2004)(10), 103524. [5] Amendola, L., Appleby, S., et al. “Cosmology and Fundamental Physics with the Euclid Satellite.” Living Reviews in Relativity, 16 (2013). [6] Anselmi, S., Ballesteros, G., and Pietroni, M. “Non-linear dark energy clustering.” Journal of Cosmology and Astroparticle Physics, 2011 (2011)(11), 014. [7] Audren, B. and Lesgourgues, J. “Non-linear matter power spectrum from Time Renormalisation Group: efficient computation and comparison with one-loop.” Journal of Cosmology and Astroparticle Physics, 2011 (2011)(10), 037. [8] Baldi, M. “Time-dependent couplings in the dark sector: from background evolution to non-linear structure formation.” Monthly Notices of the Royal Astronomical Society, 411 (2011)(2), 1077. [9] Baldi, M., Pettorino, V., et al. “Hydrodynamical N -body simulations of coupled dark energy cosmologies.” Monthly Notices of the Royal Astronomical Society, 403 (2010)(4), 1684. [10] Bartolo, N., Almeida, J. B., et al. “Signatures of Primordial non-Gaussianities in the Matter PowerSpectrum and Bispectrum: the Time-RG Approach.” JCAP, 1003 (2010), 011. arXiv:0912.4276. [11] Baumann, D., Nicolis, A., et al. “Cosmological Non-Linearities as an Effective Fluid.” JCAP, 1207 (2012), 051. [12] Bernardeau, F. and Valageas, P. “Propagators in Lagrangian space.” Phys.Rev., D78 (2008), 083503. [13] Bernardeau, F., Colombi, S., et al. “Large-scale structure of the Universe and cosmological perturbation theory.” Physics Reports, 367 (2002)(1-3), 1. [14] Bernardeau, F., Crocce, M., and Scoccimarro, R. “Multi-Point Propagators in Cosmological Gravitational Instability.” Phys.Rev., D78 (2008), 103521. [15] Bernardeau, F., Crocce, M., and Scoccimarro, R. “Constructing Regularized Cosmic Propagators.” Phys.Rev., D85 (2012), 123519. [16] Bernardeau, F., Van de Rijt, N., and Vernizzi, F. “Resummed propagators in multi-component cosmic fluids with the eikonal approximation.” Phys.Rev., D85 (2012), 063509. [17] Carlson, J., White, M., and Padmanabhan, N. “Critical look at cosmological perturbation theory techniques.” Physical Review D, 80 (2009)(4), 043531. [18] Carrasco, J. J. M., Hertzberg, M. P., and Senatore, L. “The Effective Field Theory of Cosmological Large Scale Structures.” JHEP, 1209 (2012), 082. [19] Crocce, M. and Scoccimarro, R. “Renormalized cosmological perturbation theory.” Phys.Rev., D73 (2006), 063519. [20] Crocce, M. and Scoccimarro, R. “Memory of initial conditions in gravitational clustering.” Phys.Rev., D73 (2006), 063520. [21] Crocce, M. and Scoccimarro, R. “Nonlinear Evolution of Baryon Acoustic Oscillations.” Phys.Rev., D77 (2008), 023533. [22] Crocce, M., Scoccimarro, R., and Bernardeau, F. “MPTbreeze: A fast renormalized perturbative scheme.” 10 (2012)(July), 16. [23] Eisenstein, D. J. and Hu, W. “Power Spectra for Cold Dark Matter and Its Variants.” The Astrophysical Journal, 511 (1999)(1), 5. [24] Heitmann, K., Higdon, D., et al. “The Coyote Universe. II. Cosmological Models and Precision Emulation of the Nonlinear Matter Power Spectrum.” The Astrophysical Journal, 705 (2009)(1), 156. [25] Heitmann, K., White, M., et al. “The Coyote Universe. I. Precision Determination of the Nonlinear Power Spectrum.” The Astrophysical Journal, 715 (2010)(1), 104. [26] Heitmann, K., Lawrence, E., et al. “The Coyote Universe Extended: Precision Emulation of the Matter Power Spectrum.” arXiv, (2013), 17. [27] Huterer, D. “Weak Lensing and Dark Energy.” Physical Review D, 65 (2002)(6), 063001. [28] Komatsu, E., Smith, K. M., et al. “Seven-Year Wilkinson Microwave Anisotropy Probe (WMAP) Observations: Cosmological Interpretation.” The Astrophysical Journal Supplement Series, 192 (2010)(2), 57. [29] Laureijs, R., Amiaux, J., et al. “Euclid Definition Study Report.” Technical report, Euclid collaboration (2011). [30] Lawrence, E., Heitmann, K., et al. “The Coyote Universe. III. Simulation Suite and Precision Emulator for the Nonlinear Matter Power Spectrum.” The Astrophysical Journal, 713 (2010)(2), 1322.
18 [31] Lesgourgues, J. and Pastor, S. “Massive neutrinos and cosmology.” Physics Reports, 429 (2006)(6), 307. [32] Lesgourgues, J., Matarrese, S., et al. “Non-linear Power Spectrum including Massive Neutrinos: the Time-RG Flow Approach.” JCAP, 0906 (2009), 017. [33] Lewis, A., Challinor, A., and Lasenby, A. “Efficient Computation of Cosmic Microwave Background Anisotropies in Closed Friedmann-Robertson-Walker Models.” The Astrophysical Journal, 538 (2000)(2), 473. [34] Manzotti, A., Peloso, M., et al. “A coarse grained perturbation theory for the Large Scale Structure, with cosmology and time independence in the UV.” JCAP, 1409 (2014)(09), 047. [35] Matarrese, S. and Pietroni, M. “Resumming Cosmic Perturbations.” JCAP, 0706 (2007), 026. [36] Matsubara, T. “Resumming Cosmological Perturbations via the Lagrangian Picture: One-loop Results in Real Space and in Redshift Space.” Phys.Rev., D77 (2008), 063530. [37] Piazza, F. and Vernizzi, F. “Effective Field Theory of Cosmological Perturbations.” Class.Quant.Grav., 30 (2013), 214007. [38] Pietroni, M. “Flowing with time: a new approach to non-linear cosmological perturbations.” Journal of Cosmology and Astroparticle Physics, 2008 (2008)(10), 036. [39] Pietroni, M., Mangano, G., et al. “Coarse-Grained Cosmological Perturbation Theory.” JCAP, 1201 (2012), 019. [40] Pueblas, S. and Scoccimarro, R. “Generation of vorticity and velocity dispersion by orbit crossing.” Physical Review D, 80 (2009)(4), 043504. [41] Saracco, F., Pietroni, M., et al. “Non-linear Matter Spectra in Coupled Quintessence.” Phys.Rev., D82 (2010), 023528. [42] Sato, M. and Matsubara, T. “Nonlinear biasing and redshift-space distortions in Lagrangian resummation theory and N-body simulations.” Physical Review D, 84 (2011)(4), 1. [43] Springel, V. “The cosmological simulation code GADGET-2.” Monthly Notices of the Royal Astronomical Society, 364 (2005)(4), 1105. [44] Taruya, A., Bernardeau, F., et al. “RegPT: Direct and fast calculation of regularized cosmological power spectrum at two-loop order.” Phys.Rev., D86 (2012), 103528. [45] Valageas, P. “Impact of shell crossing and scope of perturbative approaches, in real and redshift space.” Astronomy & Astrophysics, 526 (2010), A67. [46] Wetterich, C. “An asymptotically vanishing time-dependent cosmological ”constant”.” Astronomy and Astrophysics, 301 (1994), 321.