Table of Contents
Go Back
Limits to Arbitrage: Understanding How Hedge Funds Fail Mila Getmansky Abstract Even if arbitrage opportunities are found in a statistical sense, they might not be exploitable. This paper models such limits to arbitrage in the framework of a hedge fund. In particular, the paper explores how hedge funds fail given arbitrage opportunities. Dynamic relationships between a hedge fund, dealers, a bank, and market are modeled. As a case study, Long Term Capital Management is studied in the paper. The model explores a phenomenon that a fund manager who engages in arbitrage and uses high leverage might lose all his money before realizing the positions at a profit. As assets go down in value, the firm has to post more collateral. If it is unavailable, this often leads to a hedge fund collapse. However, given that positions are well diversified and not closely correlated, leverage by itself, does not lead to the collapse of a fund. Correlated positions in the absence of leverage might lead to a loss, but are not subject to collateral collapse. However, the superimposition of both leverage and induced high correlation between assets can lead to a collapse. The paper explores these “flight to quality” and “collateral collapse” dynamics.
Mila Getmansky Sloan School of Management One Broadway, E70-800, Cambridge, MA 02142 Tel: 617-252-1708 E-mail:
[email protected]
Introduction The paper presents the framework for modeling limits to arbitrage using system dynamics methodology. Limits to arbitrage are well researched and categorized in the finance literature. However, most of the approaches include econometrics, linear extrapolations or dynamic programming. Feedback analysis was not introduced to model this phenomenon. This paper is one in a series that tries to explain the limits to arbitrage using system dynamics method. In particular, the paper will explore how hedge funds fail given arbitrage opportunities. As a case study, Long Term Capital Management collapse is going to be studied in the paper. (Note, model equations can be requested upon request). Efficient Market Hypothesis The premise of the hypothesis is that stock prices are always “right”; therefore, no one can predict the market’s future direction, which, in turn, must be “random.” For this to hold, the prices have to be set by rational and well informed investors. The hypothesis was developed by Samuelson (1965) and Harry Roberts and expanded by Eugene Fama and Merton Miller. Limits to Arbitrage While a losing trade may well turn around eventually (assuming, of course, that it was properly conceived to begin with), the turn could arrive too late to do the trader any good – meaning, of course, that he might go broke in the interim. John Maynard Keynes: “Markets can remain irrational longer than you can remain solvent.” Shleifer and Vishny wrote in the Journal of Finance about the limits to arbitrage. They warned that if an arbitrage firm of Long-Term’s type can collapse if the market is overwhelmed by noise traders who push prices away from the true value. It might lead to adverse price shock that can force LTCM to liquidate its positions at low prices.
Leverage LR , leverage ratio, equals assets, A, divided by equity, E. equity, RE or return on capital equals to R E =
LR =
A . Return on E
E1 − E0 . However, return on assets, RA E0
equals to
RA =
A1 − A0 L1 + E1 − L0 − E0 L0 (1 + r ) + E1 − L0 − E0 L0 r + E1 − E0 = = = where L is A0 E0 + L0 E0 + L0 E0 + L0
leverage, and r is the interest rate that has to be paid back on leverage to the lender bank. For example, if LR = 2 and r=0, then R E = LR R A . The Federal Reserve Board, under a statutory provision known as “Regulations T,” sets a limit on broker loans for stocks, or “margin.” For the past twenty-five years, the Fed has set the maximum margin loan at 50 percent of the total investment. Hedge Funds
The term ‘Hedge Fund’ originated when Alfred Winslow Jones founded a novel approach to investing in 1949. He discovered an innovative strategy for maximizing asset returns and minimizing market risk. The strategy was based on “hedging” long stock positions with short stock positions by using leverage to increase potential of returns. Jones bought seemingly cheap stocks and sold short overpriced stocks. In theory, the Jones’s portfolio was “market neutral.” Any market event will increase the value of one half of his portfolio and depress the second half. His net return would depend only on his ability to single out the relative best and worst. In 1966, Carol J. Loomis’ article in Fortune magazine entitled The Jones Nobody Can Keep Up With, revealed that by using this double-parameter model, Jones outperformed the highestranking mutual funds of the 1950’s and 1960’s by over 44%. This breakthrough technique catalyzed the most lucrative and unregulated financial industry in the history of economics, a multi-billion-dollar industry consistently attracting smart and wealthy individuals. Since 1990s there has been a growing awareness about hedge funds. Hedge funds are often called alternative investments because hedge fund managers are not restricted to
any particular type of investments. Hedge funds have the ability to buy (long) or sell (short) securities that they do not hold. They are not restricted to plain "buy and hold" strategy. Hedge funds' activities are usually not transparent to investors and to the government. Hedge funds have the capability of leveraging - borrowing against their existing assets. During the bull market of the 1990s, investors poured enormous sums of money into hedge funds. An industry that had less than $50 billion under management in 1993, doubled to $100 billion under management in 1996 and doubled again to just under $200 billion in 1999. Hedge funds have more than doubled again since 1999 and reportedly have more than $560 billion under management as of June 2002 (Kramer et al., 2002). According to the Tremont Advisors database, the number of hedge funds grew from 805 in 1993 to 2068 in July 2002. The Tremont Advisors estimates that there are twice as many hedge funds not tracked by the database. By many account, there are not more than 6,000 hedge funds. Despite spectacular growth and performance in double digits of various hedge funds, there have been many horrifying collapses and bankruptcies of hedge funds such as Granite Capital, and LTCM. The current form of most U.S. hedge funds is a limited partnership, or a limited liability company established to invest in public securities. However, there is no common definition of a hedge fund. Hedge funds are defined by their freedom from regulatory controls stipulated by the Investment Company Act of 1940. The controls limit fund leverage, short selling, holding shares of other investment companies, and holding more than 10% of the shares of any single company. However, the laws are relatively lax, especially compared to the laws that mutual funds have to abide by. Hedge funds do not have to register with the SEC, the Securities and Exchange Commission, though some must make limited filings to the Commodity Futures Trading Commission. Like mutual funds, hedge funds are actively managed investment portfolios holding positions in publicly traded securities. However, unlike mutual funds, hedge funds have a bigger flexibility in the kind of securities they can invest. Hedge funds can invest in domestic and international debt and derivative securities. They can take undiversified positions, sell short, and level up the portfolio. Hedge funds keep their strategies and contents of investment hidden from government agencies and even from investors. They
usually can borrow as much as they want provided that bankers are willing to lend money to them. They provide liquidity to the capital markets and take speculative positions. By law, hedge funds can have no more than 99 investors each worth at least $1 million, or up to 500 investors, assuming that each has a portfolio of at least $5 million. These investors can be people or institutions. Hedge funds also require minimum investment of usually half a million dollars. The idea behind the law is that the funds are operating like private clubs for few rich, so SEC should not bother overseeing these alternative investment vehicles. Hedge funds on average charge 1% of net asset value annually. They also charge an average of 20% profits.
Hedge funds seek to generate above-average returns to their investors. For many investors, hedge funds act as risk managers since their returns are often not correlated with equities or fixed-income securities. Most hedge funds use the following strategies: •
Short selling. The strategy involves the sales of borrowed securities hoping the price of these securities will go down. A hedge fund manager should have sufficient skills and expertise to identify overvalued securities and being able to cost-efficiently borrow the overpriced stocks.
•
Hedging. The strategy involves decreasing risk inherent in hedge fund's portfolio. The risks might be the following: political, economic, company, interest rate and market risks. Hedging can use the combination of derivatives and short sales. Hedge fund managers should be able to use efficient hedging techniques. For example, it is very costly and not efficient to hedge by shorting a share of a stock for every share held long in the portfolio. It might be more economical to short contracts or shares of different assets which are highly correlated with the underlying asset.
•
Arbitrage. The strategy involves finding any price inefficiencies or discrepancies between securities or markets. The strategy is risk-free; however, in current efficient markets it is very hard to find any price inefficiencies. Even if such inefficiencies are found, they do not last. Therefore, fund managers tend to use leverage in order to enhance returns due to such minuscule short-term opportunities.
•
Leveraging. The strategy involves either borrowing money, to increase the size of the portfolio; or assigning cash or securities as down payment, collateral, or margin for a percentage of the position one seeks to establish.
•
Synthetic positions or derivatives. The strategy involves using derivative contracts to establish certain positions or strategies in the hedge fund. There are many hedge fund types. The list of hedge fund types is the following:
•
Macro funds
•
Special-situation funds
•
Pure equity funds
•
Convertible arbitrage funds
•
Funds of funds
•
Market-neutral funds
•
Commodity trading advisor funds
•
Private equity funds
•
Risk arbitrage funds
•
Long or short funds
•
Emerging market funds
•
Event risk funds
•
Restructured or defaulted security funds The recent hedge fund collapses and developments in hedge fund industry make
SEC anxious. At the end of July 2002, 55% of hedge funds in the Tass database were down for the year. Because of high water marks, the need to recoup losses before taking incentive fees on gains, it will be difficult for many hedge funds to obtain a profit soon. That increases the probability of default for many hedge funds. The average hedge fund advisor is 35 years old, very young. Also, the recent “retailization” of the industry – the introduction of products that make hedge funds available to investors with as little as $25,000 to invest, makes SEC worried.
LTCM
LTCM was started in February, 1994 by the infamous Salomon Brother’s arbitrage trader John Meriwether. The beginning of LTCM was very rocky, having trouble gathering enough investors to trust John Meriwether. After hard work from its prime broker, Merrill Lynch and its many talented partners, who included Nobel prize winners Myron Scholes and Robert Merton, LTCM eventually raised 1.25 billion dollars of assets to launch the hedge fund. The structure of LTCM was drastically different from other hedge funds. For example, the investment fee paid to the partners was 25% instead of the usual 20%, and yearly management fee was 2% instead of the usual annual 1%. LTCM also required investors to invest at least $ 3 million instead of the usual $ 1 million. Also, investors were forced to sign a contract of holding their investments for at least three years. LTCM was also extremely secretive. LTCM had about 100 investors and 200 employees. LTCM’s financial strategy concentrated on “relative value” trades in bond markets. Thus, Long-Term would buy some bonds and sell some others. It would bet on spreads between pairs of bonds to either converge or diverge. For example, they bought underpriced off-the-run US treasury bonds (because they are less liquid) and shorted onthe-run (more liquid) treasuries, betting on the convergence of the two assets. The government has the same likelihood of paying off off-the-run and on-the-run bonds. The net risk was minimal because long and short positions were highly correlated. Bonds usually rise and fall in sync; therefore, spreads don’t move as much as the bonds themselves. Another example is the following: If interest rates in Italy were significantly higher than in Germany, making Italian bonds cheaper than German ones, the hedge fund would invest in Italy and shorted Germany. The fund would profit if this differential narrowed. But since most of the spreads discovered by LTCM were very small, LTCM had to have huge leverage in order to make significant profits. The leverage rate was about 20 to 30 times the investment. The Federal Reserve Board, under a statutory provision known as “Regulation T,” sets a limit on broker loans for stocks, or “margin.” For the past twenty-five years, The Fed has set the maximum margin loan at 50 percent of the total investment. When LTCM purchased stocks, it was subject to Reg T. However, the fund rarely purchased stock outright; instead, it entered into derivative
contracts such as swaps, that mimicked the behavior of stocks. LTCM also used highly complicated mathematic models to achieve elevated returns and control risk. They utilized swaps options and other derivatives to control their trades. The firm earned 20% net of fees in 1994. In 1995 it earned 43%, in 1996 - 41%, and in 1997 – 25% net of fees return on equity. Including the money from new investors, the company’s equity capital had, in less than two years, tripled, to a total of $3.6 billion. The assets also grew to $102 billion. Thus, at the end of 1995, it was leveraged 28 to 1. Leverage did not include derivatives. The return on total capital was approximately 2.45%. By the spring of 1996, the Long-Term grew to $140 billion in assets. By 1997, it had more than $5 billion in equity. By 1998, the worst month was the loss of 2.9%. According to their models, the maximum that they could lose on any single day was $45 million. By borrowing or selling bonds that were in high demand with a smaller interest rate and by purchasing bonds that were slightly less in demand and that therefore yielded a little bit higher interest rate, LTCM was in effect a liquidity provider to capital markets. As a bank which earns money on a spread by charging borrowers a slightly higher interest rate than it paid to depositors, the hedge fund was earning profit on the spread between the two assets. LTCM in effect was buying assets that everybody wanted to sell. Therefore, those assets were not totally independent. In case of a mass selling panic, the fund could default if everybody wanted to sell and nobody wanted to buy. LTCM also had several brokers lending money to the fund. Brokers involved were Bear Stearns, Goldman Sacks, Morgan Stanley, JP Morgan, Lehman Brothers, Chase Manhattan, Banker’s Trust, Union Bank of Switzerland, UBS Warburg and Salomon Smith Barney. Long-Term would place orders of each leg of a trade with a different broker, so nobody could see the whole trade. LTCM could get rid of the haircut fee required to be paid to brokers for borrowing money. All of its brokers complied with the LTCM’s strict requirements, allowing the fund to be the most unregulated hedge fund during that time. LTCM disclosed its total assets and liabilities to its banks each quarter and to investors each month. It also reported those numbers to the Commodity Futures Trading Commission. It reported its derivative totals only annually. People were aware of high
leverage and exposure; however, nobody thought that it might lead to LTCM failure. However, LTCM did not disclose details of assets. Banks only knew their own exposure to Long-Term, but not exposures of others. About 55 banks were doing financing for LTCM. The failure of LTCM came on as a thundering shock to the financial world. When the Russian government defaulted on its debts in August 17, 1998, liquidity suddenly evaporated from international financial markets. Instead of converging, LTCM’s position began to diverge. The partnership knew perfectly well that over the short term, prices might diverge. But they always calculated the risks and the consequences of divergence with special statistical 'value-at-risk' models. In August 1998, asset prices plummeted. LTCM lost lots of money because it could not liquidate its assets before the value of its portfolio dropped. LTCM was a victim of “flight to liquidity.” People wanted to buy less risky Treasuries and get rid of risky bonds. People were afraid of going short on Treasuries. Only LTCM held short positions on Treasuries and long positions in riskier bonds. And as Treasuries rallied, spreads between them and other bonds widened. Mortgage-backed securities jumped from 96 basis points over Treasurys to 113 points. Corporate bonds rose from 99 to 105, and junk bonds rose from 224 to 266. Even seemingly safe off-the-run Treasurys climbed from 6 points over to 8 points over. In every market, the spreads widened leading to LTCM losing money. In June, the fund lost 10%. On a single day, August 21, the LTCM portfolio lost $553 million – 15% of its capital. It had started the year with $4.67 billion. Suddenly, it was down to $2.9 billion. On September 2, 1998 Meriwether sent a letter to his investors saying that the fund had lost $2.5 billion or 52% of its value that year, $2.1 billion in August alone. LTCM capital base had shrunk to $2.3 billion. The fund had $125 billion in assets – 98 % of its prior total and the leverage increased to 55:1 due to the nowshrunken equity – in addition to the massive leverage in its derivative bets, such as equity volatility and swap spreads. At that point, leverage was very high, and the fund’s partners were looking forward to sell some positions and raise more money before the end of the month. LTCM had a difficulty of reducing its positions with the markets under the stress. There was no liquidity in the market. Everybody wanted to be out at the same time – something that models missed. When losses mount, leveraged investors
such as Long-Term are forced to sell, lest their losses overwhelm them. When a firm has to sell without buyers, prices are very high. In addition, Wall Street players learned more about the fund’s positions, and went against them. They wanted to “squeeze” as much as possible from the fund, knowing that if the fund would get help from the government, it will be able to buy back its shorts. Therefore, anybody who held those securities would make money. In September 1998, many banks were exposed to the same positions as LTCM. Therefore, to cut their losses, they unwound those positions, thus, hurting LTCM. Therefore, both cutting the losses and predatory trading led to the collapse of the fund. Also, Long-Term trades were in highly specialized instruments, such as equity volatility. Only a handful of banks traded them. LTCM was short on the equity volatility, and sooner or later they would have to buy. The dealers refused to sell, only at very high prices. On Thursday, September 10, the firm had lost $145 million; on Friday, $120 million. The next week on Monday it lost $55 million: on Tuesday, $87 million, and on Wednesday $122 million. LTCM was down to $1.5 billion. Due to the excess leverage of LTCM, the potential failure of the hedge fund triggered the attention of the Fed. On September 20th, 1998, the fed representatives visited the office of LTCM in Greenwich, CN. They were amazed to find that LTCM’s on balance sheet assets totaled around $125 billion, on a capital base of $4 billion, a leverage of about 30 times. But that leverage was increased tenfold by LTCM's off balance sheet business whose notional principal ran to around $1 trillion. On September 21, 1998, LTCM had its second biggest loss of $500 million. At that point, the assets were worth $100 billion. Thus, even omitting derivatives, its leverage was greater than 100 to 1. Now, if LTCM lost 1%, it would be wiped out. LTCM exposed its books to Peter Fisher of New York Fed. He saw that in all markets LTCM was badly hurt. All its positions were became perfectly correlated in the crisis period. Fisher was not worried that the markets would go down; he was afraid that they would not trade at all. Bankruptcy was out of the question because bankruptcy filing would make all counterparties go after the collateral further depressing the value of the collateral. Also, nobody wanted to buy the firm and obtain assets such as equity volatility or sophisticated derivatives. If one bank bought the firm, then it would be in the same position as LTCM, and given that by now positions of LTCM were exposed,
other banks would try to trade against it. Therefore, the only solution was for all banks to work together. The Fed convinced all the LTCM’s major brokers to bail out the fund’s losses, believing that if LTCM was allowed to fail, the world financial market would be at risk. If Long-Term defaulted, all of the banks that lent to LTCM would be left holding one side of a contract for which the other side no longer existed. Undoubtedly, there would be a frenzy as every bank rushed to escape its now one-sided obligations and tried to sell its collateral from Long-Term. LTCM had lots of derivatives which were relatively new. Officials were afraid that the financial system could crash. The consortium of 14 banks got $3.65 billion in exchange of 90% of the equity in the fund. The LTCM’s existing investors would retain the rest 10%. On July 6, 1999, LTCM repaid $300 million to its original investors. It also paid out $3.65 billion to the 14 consortium members. LTCM met all margin calls. All of its debts to creditors were repaid in full. Through April 1998, the value of a dollar invested in Long-Term quadrupled to $4.11. By the time of the bailout, only five months later, 33 cents were remained. After fees, each invested dollar has grown to $2.85 and then shrank to 23 cents. In net terms, LTCM lost 77%. There are many speculations of major reasons why the hedge fund failed. Many believed that it wasn’t going to fail at all. In fact, the position taken by LTCM was simply going to take time to recover and eventually make a profit for the firm. There are other reasons for the collapse besides LTCM’s strategy. First, the ‘value-at-risk’ model used by LTCM did not anticipate the “flight to liquidity” taken place in August and September of 1998. Second, there were other hedge funds and major investment banks that mimicked strategy used by LTCM in convergence arbitrage. Third, LTCM partners lost faith in the strategy and started closing positions using the firm’s assets. Fearing the failure, they made it inevitable by draining the firm of its remaining capital. Fourth, LTCM had about 8% of its book exposure to Russia, which could come to about $10 billion exposure. Fifth, LTCM took speculative positions in takeover stocks, such as Tellabs whose share price fell over 40% when it failed to take over Ciena. Sixth, LTCM was exposed to mortgage-backed securities, which experienced a downturn in 1998.
NYSE Exchange
Trading on the exchange is organized around “specialist posts” where specialists act as market makers in one of the listed companies. The specialists are required to make a market in a stock. They have to take an opposite side of the trade if nobody else wants it. They also have to stabilize the market in the security by selling into a rise and buying into a decline. They have to provide liquidity for the stock; for that, they are paid bid-ask spread. Other people on the exchange are commission brokers, who trade for the public, and individuals trading for their own account. Price is set by an auction as members react to the specialist’s price quotes. Purpose of the Model
Even if arbitrage opportunities are found in a statistical sense, they might not be exploitable. Moreover, a fund manager who engages in such arbitrage might lose all his money before realizing the positions at a profit. For example, lots of hedge funds find arbitrage opportunities that are usually very miniscule considering almost efficient markets, and leverage up the positions in order to make high profit margins. As assets go down in value, the firm has to post more collateral. If it is unavailable, this often leads to a hedge fund collapse. However, given that positions are well diversified and not closely correlated, leverage by itself, does not lead to the collapse of a fund. Correlated positions in the absence of leverage might lead to a loss, but are not subject to collateral collapse. Given diversified positions in a fund, a price drop in one asset does not necessarily correspond to a price drop in another asset, even less likely there is a possibility of a cascade in drop in prices of all assets. However, the superimposition of both leverage and induced high correlation between assets can lead to a collapse. This is something that sophisticated hedge funds like LTCM did not take into equation in determining risk exposure. Their decisions were bounded rational. The managers separately managed leverage and diversification of positions, not thinking that two can feed on each other during a period of a crisis. Unlike other financial institutions such as mutual funds and banks, hedge fund can get exposed to various kinds of assets and borrow on margin. Therefore, this
dynamic of “flight to quality” and “collateral collapse” can be best studied in the framework of a hedge fund. Even if a hedge fund has great positions that guarantee a statistical arbitrage, the hedge fund might collapse before these positions converge and make a profit. Model Boundary
The model will have a hedge fund, a dealer, and a bank. It will have both financing functions as well as psychological ones such as volatility feedback. I will model the balance sheet of the hedge fund, portfolio decisions as well as its decisions on taking leverage. Behaviors of individual investors in a hedge fund or stakeholders in a bank are not modeled. The dealer is modeled. Time Horizon
The time horizon is approximately 4-5 years for the model. I am using the data for Long Term Capital Management case that has data for four years, from inception of the fund from June, 1994 to its collapse, September, 1998. Dynamic Hypotheses
“If you aren’t in debt, you can’t go broke and can’t be made to sell, in which case “liquidity” is irrelevant. But a leveraged firm may be forced to sell, lest fast accumulating losses put it out of business. Leverage always gives rise to this same brutal dynamic, and its dangers cannot be stressed too often.” (Lowenstein, 2000). Let’s have three financial entities: hedge fund, dealer, and a bank. A hedge fund is interested in obtaining leverage. It goes to a dealer, and can borrow money from a dealer at the maximum 50% margin (value of leverage divided by the total value of positions). Therefore, for example, if a hedge fund has $10 million, it can borrow another $10 from a broker and broker buys securities for $20 million in total. The dealer earns the transaction fee as well as charges the hedge fund for the loan. Now, the dealer delivers these securities ($20 million) worth to a bank in exchange for a loan. The dealer can borrow up to 16 times its own capital. So, in this case, it will borrow $10 million from the bank in exchange for $20 million worth of securities. If the stock goes up in
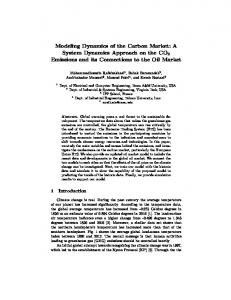
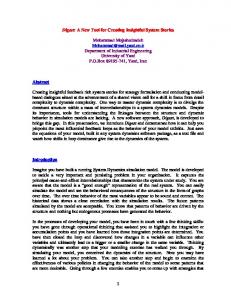
value, the hedge fund can ask for more credit. A dealer is in the business of extending the credit. The dealer will require for more collateral if a price of a stock goes down, even if the trade might be profitable in the future. Say, the price goes down by 10%. Therefore, instead of having $20 million worth of securities, the bank now has $18 million worth of securities. Therefore, in order to maintain 50% margin, the value of the collateral has to be increased by $2, or 25% (from $8 million to $10 million). Let, L be the value of leverage, A is the total value under management of a hedge fund, its assets. E is the equity of a hedge fund. Therefore, A=E+L. L/A should be at most 50%. In this case, E is the same as collateral. So, if A decreases to A1, then the new collateral to be posted is L/0.5- A1. The collateral to be posted is max(0, L/0.5- A1). Dealers do not win if the value goes up; however, they lose if the value of positions goes down. They might end up responsible for the value to be paid back to the banks. Broker dealer makes money by providing credit. He does not want to lose money. The stock and flow diagram of the interactions between a hedge fund, a dealer, a commercial bank, and a market is shown in Figure 1.
Market
Money for securities Securities purchased
Hedge Fund
Dealer Collateral
Interest paid on money borrowed from the dealer
Securities lent
Commerci al Bank
Money borrowed
Interest paid on money borrowed from the bank
Figure 1: Hedge fund, Dealer, Commercial Bank, and Market Interactions
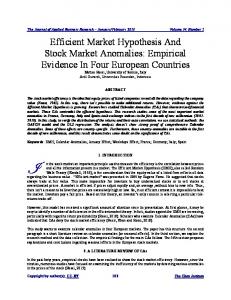
If arbitrage spreads widen, as happened in May, 1998 for LTCM, people start liquidating, therefore, increasing volatility. As volatility goes up, that forces more people to liquidate. People were willing to buy Treasuries at any price as long as they got out of the risky bonds and obtained the less risky instruments. Everybody on the street started talking about “flight to quality” or buying Treasury bonds. That lead to losses of LTCM. Owing to its loss of capital, Long-Term’s leverage had become very high, because losses accumulate faster as leverage increases. Therefore, they wanted to sell something. At that point, leverage was very high, and the fund’s partners were looking forward to sell some positions and raise more money before the end of the month. LTCM knew it had to reduce its positions, but couldn’t with markets under the stress. There was no liquidity in the market. Everybody wanted to be out at the same time – something that models missed. When losses mount, leveraged investors such as LongTerm are forced to sell, lest their losses overwhelm them. When a firm has to sell without buyers, prices are very low. In addition, Wall Street players learned more about the fund’s positions, and went against them. They wanted to “squeeze” as much as possible from the fund, knowing that if the fund would get help from the government, it will be able to buy back its shorts. Therefore, anybody who held those securities would make money. In September 1998, many banks were exposed to the same positions as LTCM. Therefore, to cut their losses, they unwound those positions, thus, hurting LTCM. Therefore, both cutting the losses and predatory trading led to the collapse of the fund. As price of a security goes down, therefore, the net asset value of a hedge fund goes down. That in turn leads to the collateral value to decrease. Lenders either require more collateral, or in case of many leveraged hedge funds, they pressure the hedge fund (through the dealer) to sell the assets. As it usually happens, hedge funds use their own assets as collateral, which leads to this vicious loop: R1 Collateral Collapse described in Figure 2.
+
Net Asset + Value
Shares + Equity -
Price + Net Buy/Sell Balance -
R1 Collateral Collapse
Leverage + Collateral Value
Pressure to Sell by Lender -
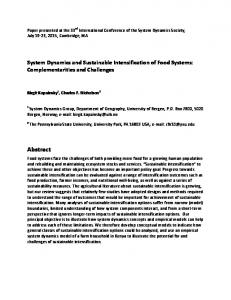
Figure 2: Collateral Collapse Causal Loop As was described in the case, the pressure to sell usually decreases price, leading to an increase in volatility of an asset leading to more pressure to sell by lenders. This dynamic is described in Figure 3.
Downward Trend in Price Absolute Change+ in Price
+
Upward Trend in Price
Shares
Net Asset + + Value
+
+ Equity -
Price + + Volatility
R2 Volatility Feedback
Net Buy/Sell Balance -
R1 Collateral Collapse
Leverage +
-
Collateral Value
Pressure to Sell by Lender +
Figure 3: Volatility Feedback Net Assets (A) of a hedge funds equals the sum of Price (P) multiplied by Shares n
(S) for each position in a fund: A = ∑ Si Pi i =1
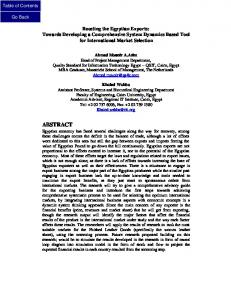
Equity (E) equals to net Assets (A) minus Leverage (L): E = A − L Collateral Value (C) equals to Assets minus Leverage: C = A − L . In this case, E is the same as collateral. So, if A decreases to A1, then the new collateral to be posted is L/0.5A1. The collateral to be posted is max(0, L/0.5- A1). Price is assumed to take the following form: Pi = α i − β i ∆Si . So price is anchored to some fundamental value α i , and is adjusted according to β i ∆Si , where β i is a illiquidity proxy for the asset, and ∆Si is the volume of stock sold. Therefore, if β i is high, then the price impact of a sell is very large. We expect that to happen for illiquid stocks or during “liquidity crunch.” The “liquidity crunch” or “flight to quality” is depicted in Figure 4.
Downward Trend in Price Absolute Change+ in Price R3 Flight to Quaility +
+ Volatility
+
Upward Trend in Price +
Net Asset + + Value
Shares + Equity -
Illiquidity
- Price + Net Buy/Sell Balance -
R2 Volatility Feedback
R1 Collateral Collapse
Leverage + Collateral Value
Pressure to Sell by Lender +
Figure 4: Flight to Quality Implications for Risk Management
Using Value at Risk Analysis (VAR) explained below, VAR = 1.65 Aδ , where δ is the standard deviation of the hedge fund performance, and is the squared root of the n
n
n
variance: δ 2 = ∑ P 2 i S 2 iδ i2 + ∑∑ σ ij Pi S iδ i2 Pj S jδ j2 , where σ ij is the correlation i =1
i =1 j =1
between assets (i) and (j) held by a hedge fund. It is important to note that during “liquidity crunch” positions that were previously not correlated, become dependent. In the context of Figure 4, as β i become high for hedge fund positions, then σ ij becomes higher, therefore, inflating the variance of the hedge fund. Hence, Value at Risk of the hedge fund increases. Value At Risk Analysis (VAR)
VAR describes how risky a stock is.
VAR is the maximum expected loss over a given horizon period at a given level of confidence C i.e., the maximum likely loss. VAR depends upon two arbitrarily chosen parameters: the horizon period (daily, weekly, monthly, quarterly, etc.) and the level of confidence (90%, 95%, 99%, 99.9%, etc.). Origins: October 1994, J.P. Morgan, RiskMetric For example: Results show that 99% quarterly VAR is $.767 million. It means that the probability of losing more than $767,000 over a quarter is less than or equal to .01. Calculation of VAR: VAR=Market Cap*Standard Deviation*1.65 where Market Cap ($Billion) Standard Deviation (s.d. of monthly returns) 1.65 is the one side 5% point (Prob(z