Oct 5, 2001 - Direct simulation of HVAC (Heat, Ventilation, Air-conditioning systems) ... Today's software for postprocessing (e.g. AVS/Express [5]) includes algorithms to ... vector field at the corners of the cell (vertex associated data). .... performed by specialized engineering groups who offer their service on demand.
Efficient reduction of 3D simulation results based on spacetree data structures for data analysis in Virtual Reality environments S. Kühner, E. Rank, M. Krafczyk Lehrstuhl für Bauinformatik Arcisstraße 21 80290 München http://www.inf.bv.tum.de +49 (89) 289-23047 { kuehner, rank, krafczyk } @bv.tum.de
ABSTRACT Direct simulation of HVAC (Heat, Ventilation, Air-conditioning systems) during the design phase of a building has just started to find its place in practical engineering. Despite recent progress in the domain of computational fluids dynamics (CFD), less tedious and shorter design cycles will be achieved by establishing a tight coupling of problem definition, grid generation, computation and data analysis of typically large datasets using state-of-the-art visualization techniques. This article focuses on optimization of the postprocessing step. We describe a reduction technique based on octree data structures for CFD simulation results being discretized on 3D cartesian meshes. In addition, we describe a Virtual Reality Environment for an immersive, interactive analysis of simulation data (being visualized together with the building geometry).
KEYWORDS Virtual Reality, Hierarchical data structures, Computational fluid dynamics, Civil Engineering
MOTIVATION AND RELATED WORK Computer based dimensioning of structures using FEM methods can nowadays be considered as state-of-the-art techniques in the design phase of a building. Although the progress in the development of computational fluid dynamics schemes is quite obvious, the optimisation of HVAC systems utilizing these methods has just started to be applied in practical civil engineering. This relatively slow progress can mainly be improved by a tight coupling of the three main components of a computer based simulation, namely preprocessing (problem definition and grid generation), computation and postprocessing (visualization and analysis of the simulation results). Nevertheless, each of these parts still requires optimizations. In the domain of postprocessing, the following difficulties can be easily identified: 1 AVR II and CONVR2001 Conference at Chalmers, Gothenburg, Sweden, October 4th-5th , 2001
The analysis of the 3D simulation datasets mapped onto two dimensional projection screens – typically decoupled from the CAD system – can only be performed by qualified engineers and thus hardly be shared with involved project partners. Additionally, the corresponding simulation datasets can hardly be analyzed interactively. Currently, there is a lot of ongoing research in this area: Frank [1] proposed hierarchical data structures as a basis to couple grid generation, computation and visualization. Simulation codes are implemented for parallel vector architectures [2] or optimized for workstation clusters using domain decomposition and message passing techniques. The most time consuming part in the simulation of a products flow properties is the analysis of the corresponding results [3]. This situation is becoming even more critical for increasingly complex datasets resulting from highly resolved flow fields being generated by massively parallel computations. Recent developments in the visualization community include interactive postprocessing systems, that overcome the resolution problem by directly using locally refined hierarchical datasets [4]. The CFD-Solver used to compute the examples presented later is our LatticeBoltzmann code “VirtualFluids” [2]. Due to its parallel implementation, the computed datasets are typically very huge (many million grid points), thus an efficient data reduction tool is required. The following section describes an error controlled data reduction algorithm, currently being used to reduce the large amount of simulation results in order to analyze them in a Virtual Reality environment. An octree data structure (to be explained in the following section) is used to coarsen the simulation dataset either locally in regions where the underlying vector field has small curvatures or globally in case of very huge datasets. These reduced datasets can then be analysed interactively in our Virtual Reality based software prototype “VirtualFluidsVis” described in the last section of this article. The simulation data is visualized together with the building geometry to allow a better understanding of the correlation of geometrical properties of the building and the fluid flow. It provides immersive user interfaces and allows to request a variety of different mappings of the dataset. Thus the iterative process of communication between the different people being involved in the design phase will be improved resulting in a shorter design cycle.
DATA REDUCTION USING SPACETREE DATA STRUCTURES Reduction Approaches in Postprocessing applications Today’s software for postprocessing (e.g. AVS/Express [5]) includes algorithms to reduce the resulting simulation dataset and can be grouped as follows: • Data input: The complete simulation results are loaded. • Filtering: A subdivision of the input data is extracted, e.g. considering a desired data component (e.g. pressure), extracting data points within a given bounding volume or simply downsizing the dataset by only considering every nth grid point for each spatial direction. • Data mapping: Many mapping algorithms, like orthoslices, streamlines or isosurfaces typically reduce the input data by at least one order of magnitude. • Reduction of the mapped data using error controlled polygon reduction techniques. 2 AVR II and CONVR2001 Conference at Chalmers, Gothenburg, Sweden, October 4th-5th , 2001
• Creation of graphical objects using OpenGL rendering techniques. A drawback of this approach is the input of the whole dataset. Hence the steps described above are time consuming, resulting in limited user interaction. Since the flow field is usually computed using supercomputers or workstation clusters, many graphic workstations will not be able to process the corresponding dataset due to memory restrictions. The following reduction algorithm is designed to run independently from the CFD computation and the available visualization software. It is controlled by user input based error criteria. Spacetree data structure - definitions A brief introduction to spacetree data structures and our extensions for an application in the fluid simulation process is given in order to explain the following algorithms. For a detailed description of Spacetrees, we refer to [1], [6].
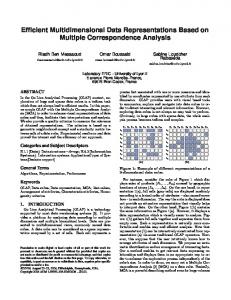
(root)
(1 level)
(2 levels)
Fig. 1 Octree data structure – hierarchical spatial subdivision
Spacetrees subdivide the space recursively into smaller parts as shown in Fig. 1. It is a tree data structure based on a cell with one parent cell and 2D children, where D is the number of dimensions of space. Each cell represents a cube in physical space. The 2D representation is known as Quadtree, while its 3D version is referred to as Octree. The subdivision used here is uniform, so that the ratio of the edge length of a child cell to its corresponding parent cell is always given by 1:2. The root cell is the origin of the tree and has no parent. Its tree level is 0 by definition. The level of a cell is given by the level of its parent cell plus one. A top down traversal of the hierarchy of the tree will stop at so-called leave cells, which have no child cells. The set of leave cells typically defines the cells of the computational grid. Each cell within the tree is a spacetree of its own. This property allows the use of recursive algorithms. Local grid refinement and coarsening can thus easily be achieved. The application of spacetrees in numerical simulations is usually restricted to balanced trees, having a predefined maximum difference of the tree levels of adjacent cells: level(Cell i) - level(Cell i+1) < 2. (1) Further on, the tree data structure has to represent a multitude of information: • Finite-difference based simulation kernels store the discrete data points of the vector field at the corners of the cell (vertex associated data). Thus each cell includes for each corner a pointer to a vertex data structure containing the simulation results (velocity, pressure, etc.). • Each cell contains an attribute storing the type of boundary condition assigned to the cell. • Additional cell based attributes can be allocated on demand (e.g. temporarily needed information for visualization purposes). 3 AVR II and CONVR2001 Conference at Chalmers, Gothenburg, Sweden, October 4th-5th , 2001
Data reduction based on local grid coarsening. Reduction of vertex associated data A cell is typically coarsened eliminating its eight children, which all have to be leaves at the present iteration. In the case of vertex associated data, a cell with eight leave children has 27 corner vertices. After a performed reduction, only the eight corners of the reduced cell will be kept, while the other 19 vertices (1 vertex in the centre of the cell, 6 vertices located in the centre of the faces of the cell and 12 vertices at the midpoint of the edges of the cell) will be deleted. We only allow the reduction of the cell, if the curvature of the assigned vector field at these 19 vertices does not exceed a given value for all the three spatial dimensions. This criterion is illustrated in Fig. 2. uj(xk,i+1)
uj
uj(xk,i+1) uj(xk,i-1)
uj before reduction
uj(xk,i-1)
uj after reduction
uj(xk,i) xk,i-1
dxk,i
xk,i
,
unknown solution of uj
uj(xk,i)
dxk,i
xk,i+1
,
small curvature, may be reduced
xk
xk,i-1
dxk,i
xk,i
,
dxk,i
xk,i+1
xk
,
large curvature, may not be reduced
Fig. 2 Coarsening criteria
The curvature κ for a spatial dimension k and a component j of the vector field is defined as u ′j′ ( x k ) κ j ,k ( x k ) = (2) 3 1 + u ′j ( x k ) 2 2 The discrete derivative in (2) are then numerically computed using finite difference schemes of second order accuracy [7], where i indicates a discrete point: du j u j ( x k ,i +1 ) − u j ( x k ,i −1 ) u ′j ( x k ,i ) = ≅ (3) dx k ,i 2 ⋅ dx k ,i
(
u ′j′ ( x k ,i ) =
)
d 2u j
≅
u j ( x k ,i +1 ) − 2u j ( x k ,i ) + u j ( x k ,i −1 )
(4) dx dx k2,i If (for all spatial directions k and every considered data component uj) the ratio of the cell size and the inverse curvature (circle radius r) does not exceed a user defined maximum value εmax (see equation (5)), the vertex is eliminated. 1 cellSize (5) < ε max ; with r j ,k = r j ,k κ j ,k Due to the object oriented nature of the implementation, other coarsening criterias can easily be integrated. For a more detailed description of the algorithm, e.g. the search of adjacent vertices located outside the considered cell, we refer to a forthcoming publication [8]. The complete reduction process can now be summarized as sketched in Fig. 3. 2 k ,i
Reduction of cell associated data The reduction of cell associated data is depicted for reasons of completeness. Its implementation is straightforward, since the algorithm is purely local and can thus be implemented recursively. 4 AVR II and CONVR2001 Conference at Chalmers, Gothenburg, Sweden, October 4th-5th , 2001
each vertex stores a flag REDUCE, being initialized with 0 for all cells having eight leaves as children { for all 19 vertices vertex[i] to be removed { if vertex[i]->REDUCE equals 0: { test vertex[i] for reduction if vertex[i] may be reduced, set vertex[i]->REDUCE=1, else vertex[i]->REDUCE=-1 } if vertex[i]->REDUCE equals -1: this cell may not be reduced, break } reduce cell by removing all eight children and decrement the reference count (a vertex may be referred by several cells) of the investigated 19 vertices } delete all vertices with a reference count equal 0
Fig. 3 Reduction of cell with vertex associated data
The basic idea is to compare the values xi (for any component of a vector field) stored in the eight children of the considered cell to the mean value xm of all these eight data values. For each xi, the corresponding error εi must be smaller then a given maximum user defined error εmax, and is defined as follows: | x − xm | ε= i (6) xm If this condition is fulfilled, the eight children will be deleted and xm assigned as the new data value of the considered cell. The tree traversal is bottom up, terminating as soon as the given maximum error level is exceeded. Example The results of the data reduction are presented for a complex three-dimensional example of a flow around a one family house (Fig. 4 to Fig. 6). The dataset has been reduced with a maximum error assigned to each velocity component and the pressure.
INTEGRATION INTO AN INTERACTIVE AND IMMERSIVE VIRTUAL REALITY ENVIRONMENT
Postprocessing can be very time consuming and tedious. All undesired properties of the simulated building component have to be discussed in a variegated group of people involved in the buildings design phase. Among them are architects, building owners, HVAC engineers, structural engineers, etc. Most of them are laymen in the field of computational fluid dynamics. In order to corporately justify the necessity of technical changes and to discuss alternatives, an efficient platform mapping the computed data in an intelligent manner is mandatory. This problem is addressed by our Virtual Reality based data exploration environment prototype “VirtualFluidsVis”(VFV) [9], including the following core features: • Combined graphical representation of the CAD based flow geometry including textured surfaces together with mapped simulation results allows a better understanding of the correlation between geometric building properties, the hydrodynamic boundary conditions and the resulting flow field (see Fig. 7).
5 AVR II and CONVR2001 Conference at Chalmers, Gothenburg, Sweden, October 4th-5th , 2001
Fig. 4 3D data reduction – slice (37345 points) through original grid (7469000 points)
Fig. 5 3D data reduction – edges of slice (9427 points) through coarsened grid (889653 points)
Fig. 6 3D data reduction – slice slice (9427 points) through coarsened grid (889653 points) 6 AVR II and CONVR2001 Conference at Chalmers, Gothenburg, Sweden, October 4th-5th , 2001
•
3D View: Using stereo-projection and multi-channel displays results in a truly three dimensional perception of the geometry and the flow field. The user no longer needs to be trained to map a two-dimensional projection back to the threedimensional object in his imagination. We have currently installed VFV at the Virtual Reality studio of the Siemens AG in Munich (a 2m by 6m circular wall) [10] and plan to port it to the Holobench (with its Onyx2 graphics workstation) at the computing centre of the TU Munich [11].
Fig. 7 Visualization of flow data combined with the building geometry
•
•
Interactive query of different data mapping: VFV uses classical data mapping techniques like slice planes, streamlines, vector glyphs and isosurfaces. Loading the datasets generated by the reduction algorithms described in the preceding section, data mapping can be computed with small latency (streamlines injected by a probe set of 100 particles and 1000 calculated steps takes about four seconds on a PIII 800 PC). Intuitive user interfaces: Different mappings of the data can be produced by simple mouse drags (i.e. positioning of probes describing starting points for particle tracing or picking a slice plane analogously to grips in CAD systems (as shown in Fig. 8). Thus, the user can analyze many data mappings in different perspectives, to finally extract the key features of the flow field in a fast and natural way.
Fig. 8 Interactive positioning of probes and slices via mouse drags
•
Object oriented implementation: The object oriented design of VFV ensures an easy extension of the program with new loaders for any type of simulation data, as well as new operators for data mapping (e.g. line integral convolution techniques).
7 AVR II and CONVR2001 Conference at Chalmers, Gothenburg, Sweden, October 4th-5th , 2001
CONCLUSION Hierarchical data structures are a basis for a tight coupling of preprocessing, computation and postprocessing, as well as for algorithms to optimize these three steps individually. We presented a reduction algorithm using spacetree data structures to reduce the typically huge datasets of a CFD simulations by local or global coarsening of the simulation mesh. Interactive and immersive Virtual reality based data analysis of the simulation results together with the CAD based geometry allows a detailed understanding of the correlation of geometric building properties and the flow field, and thus can be considered as a suitable environment for communication between the participants in the design phase of the project. Due to its very expensive hard- and software, a CFD based design of HVAC may only be profitable for very complex systems, where standard methods will lead to very uneconomical and oversized systems. In our opinion, a practical application will be performed by specialized engineering groups who offer their service on demand. Nevertheless, with the amazing progress of Linux clusters and PC graphics, we suppose these limitations to become less influential.
ACKNOWLEDGMENT The first author gratefully acknowledges for financial support by Siemens AG, München.
REFERENCES [1] A. Frank: Organisationsprinzipien zur Integration von geometrischer Modellierung, numerischer Simulation und Visualisierung, PhD thesis, Institut für Informatik, TU München, 2001 [2] M. Krafczyk: Gitter-Boltzmann Methoden: Von der Theorie zur Anwendung, Professional dissertation, LS Bauinformatik, TU München, 2001 [3] A. Wierse, Numerical simulations in the Virtual Reality, 18. CAD-FEM Users’ meeting, Friedrichshafen, 2000 [4] S. Roettger, M. Schulz, W. Bartelheimer, T. Ertl:.Flow Visualization on Hierarchical Cartesian Grids. Proc. of International FORTWIHR Conference 01, 2001 [5] Advanced Visual Systems Inc., http://www.avs.com, 2001 [6] J. Clark: Hierarchical geometric models for visible surface algorithms, Comm. ACM 19, No 10, 1976 [7] H.R. Schwarz, Numersche Mathematik, B.G. Teubner, 4th edition 1997 [8] S. Kühner et al., to be published [9] S. Kühner, M. Krafczyk: Virtual Fluids – An environment for integral visualization of CAD and simulation data, Proceedings of 5th international fall workshop “Vision, Modeling and Visualization 2000”, Saarbrücken 2000 [10] Siemens AG München: http://w4.siemens.de/FuI/en/archiv/zeitschrift/heft1_98/ artikel10, 2001 [11] LRZ München: http://www.lrz-muenchen.de/services/peripherie/holobench/, 2001
8 AVR II and CONVR2001 Conference at Chalmers, Gothenburg, Sweden, October 4th-5th , 2001