Oct 5, 2008 - effects thereof. The most problematic issue for the given FMEA is the valuation ... comes an ethical question that cannot be answered. As a means ... Using the present level of uncertainty as an additional objective also acts an.
Author manuscript, published in "Workshop on Multi-camera and Multi-modal Sensor Fusion Algorithms and Applications - M2SFA2 2008, Marseille : France (2008)"
Efficient Resource Allocation using a Multiobjective Utility Optimisation Method Stephan Matzka, Yvan R. Petillot, and Andrew M. Wallace
inria-00326770, version 1 - 5 Oct 2008
Heriot-Watt University, School of Engineering and Physical Sciences, Edinburgh, UK {sm217, y.r.petillot, a.m.wallace}@hw.ac.uk
Abstract. In this paper we present an extension for two recent active vision systems proposed in Navalpakkam and Itti [1], and in Frintrop [2]. The novelty of our proposed system is twofold: first it extends the existing approaches using both prior and dynamic contextual knowledge, enabling to adapt the proposed system to the present environment. Second, the decision making process intuitively used in [1, 2] is formalised in this paper and put into the context of multiobjective optimisation using a utility concept. We discuss three different saliency algorithms to be used in the system as well as three different methods to determine common utility. Our presented system is quantitatively evaluated using a motorway traffic sequence recorded by a test vehicle equipped with a multimodal sensor system.
1
Introduction
In complex real-life scenes, the amount of sensor data gained by a standard video camera alone easily exceeds the computational pattern recognition performance of current embedded automotive hardware. This problem can be addressed by focussing computationally expensive tasks such as object classification to a fraction of the original sensory data. This process of directing visual attention is prominently observable for the human visual system, as only about 0.3% of the information carried through the optic nerves reaches attentive scrunity [3]. However, visual attention implies the presence of non-attentive processes that operate on the whole image and are able to efficiently direct attentive processes. In literature, a combination of unsupervised features (bottom-up), and trained saliency or classifiers (top-down) is frequently proposed to perform this task. Two recent approaches (Navalpakkam and Itti [1], and Frintrop [2, 4]) propose the use of saliency as bottom-up cue and a trained classifier as top-down cue. Both methods employ centre-surround approaches for bottom-up saliency (cf. [5, 6]). In [1] top-down saliency is realised by training histograms of objects and distractors on saliency maps, whereas [2] trains histograms of objects on feature maps and subsequently uses the object recognition method presented in Viola and Jones [7] as a top-down cue. We propose an active vision system (cf. Fig. 1) that extends [1,2] by considering prior and dynamic contextual knowledge besides bottom-up and top-down saliency information. Moreover, the cue combination process of [1, 2] is formalised and put into the context of multiobjective optimisation using a utility concept.
2
2
M2SFA2 2008: Workshop on Multi-camera and Multi-modal Sensor Fusion
System Overview
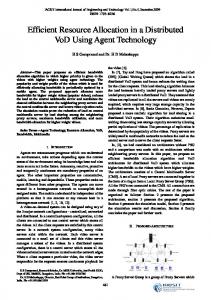
The proposed system processes data over various stages, beginning at sensor level and increasing both in level of abstraction, and in significance towards a contextual reasoning level (cf. Fig. 1).
sensor level data
DGPS
registration and data level fusion features
combining synt./sem. level
reasoning level
trajectory & road type
behaviour & environment
prior contextual knowledge
high-res. intensity
object classification
dynamic contextual knowledge
intensity
traffic participant detection
range
saliency detection
motion
occlusion detection
PTZ camera
inria-00326770, version 1 - 5 Oct 2008
data processing
fixed camera
PMD
laser scanner
radar targets
resource allocation and control
level of abstraction
Fig. 1. Block diagram of the proposed system using four layers of abstraction. Slashed blocks and connections are implemented, but not considered in this paper.
While the transformation from sensor level information towards a contextual awareness is highly desirable in order to maximise sensor resource efficiency, it requires a total of three serial processing steps. In order to mitigate problems associated with serial processing, saliency computation, traffic participant detection and classification, and eventually occlusion detection are performed in parallel. This ensures a higher reactivity for the resource allocation and avoids bottleneck problems. Below, the modules from Fig. 1 are discussed in order to illustrate the functions and interactions of the respective modules in our proposed system. 2.1
Sensors Level Data
The proposed system obtains its sensor-level data from a multimodal sensor system mounted on a test-vehicle (cf. Fig. 2) consisting of two high-resolution colour cameras (a pan-tilt-zoom (PTZ) camera, and a fixed wide-angle camera), a 3-D camera (photonic mixer device (PMD)) which acquires a depth image of the scene, a time-of-flight laser scanner acquiring a depth profile of the environment,
M2SFA2 2008: Workshop on Multi-camera and Multi-modal Sensor Fusion
3
pre-tracked radar targets, and a differential global positioning system (DGPS) to determine the position of the vehicle. pan-tilt-zoom camera differential GPS photonic mixer device
SRR PMD
Laser CMOS LRR
fixed camera laser scanner 5m
short range radar (right)
10m
25m
50m
100m
250m
distlog
short range radar (left)
long range radar
inria-00326770, version 1 - 5 Oct 2008
Fig. 2. The test vehicle used for evaluation is shown on the left. On the right, distance and aperture angle restrictions of the sensor array are displayed on a logarithmic scale.
2.2
Data Level Features
Sensor data acquired by our sensor array is fused towards a common, ego-vehicle centred coordinate system. The images provided by the fixed wide-angle camera are downscaled to 320 × 240 pixels (px), resulting in 320 px / 55◦ = 5.8 px per degree horizontally. The high-resolution intensity images are also small with a resolution of 240 × 180 px, but cover a region of only 14◦ horizontally resulting in 17 px per degree. High-resolution intensity images are either cropped from the fixed camera or acquired by focussing a region with the PTZ camera. A range profile is acquired by the laser scanner and can be used without data fusion, as PMD sensor and radar targets are not used here. Translational 2-D motion is estimated using the PMVFAST method [8] on the camera image, for 3-D motion an extension of PMVFAST can be applied to the PMD data [9]. The ego vehicle’s position and dynamics such as speed and acceleration are used to predict the trajectory for the near future. Global position is used in conjunction with a digital road map, which provides a road type identifier RTι for the road the vehicle is currently driving on. 2.3
Syntactical and Semantical Level
In the syntactical and semantical level, data level features are used to determine attributed regions in the environment, which can be used in a reasoning system. Behaviour and Environment Information about the present environment, such as the prior probability distribution of traffic participants P (Φ|RT ) are assigned in this module using prior knowledge for the given road type RT . Traffic Participant Detection and Classification Traffic participant detection and classification is performed using a trained classifier cascade as proposed
4
M2SFA2 2008: Workshop on Multi-camera and Multi-modal Sensor Fusion
inria-00326770, version 1 - 5 Oct 2008
in Viola and Jones [7]. The difference between the classifiers for detection and classification is both the respective training set, and the training resolution. The cascades used for classification are individually trained for a single traffic participant class such as pedestrian, car, or lorry using high-resolution training images. Images from different traffic participant classes are also used as negative training examples to enhance inter-class discrimination. In principle, traffic participant detection can be performed using a single classifier cascade. In practice however the differences between e.g. a pedestrian, and a lorry are too large. Dividing all traffic participant classes into subgroups of classes such as pedestrians & bicyclists, and cars & lorries is beneficial for both detection rate, and speed. No samples of traffic participant are used as negative examples, as opposed to the traffic participant classification cascades. Saliency Detection In literature, saliency is often derived from the fixation patterns of the human eye which, during its pre-attentive phase, treats regions as salient, which ’pop out’ [10] of their surroundings (e.g. [5, 6]). This definition results in evaluating local contrast between a region and its surroundings. A different definition treats regions as salient, whose feature space representation is rare - at best unique - in their environment (e.g. [11]). The latter definition assumes statistical knowledge about the entire environment and determines saliency in a global context. Both global and local definitions describe apparent forms of saliency. The method presented in Itti [5] uses a local centre-surround approach, yet it also includes the notion of rarity by weighting each feature’s saliency map by the difference of the absolute maximum and the mean of all local maxima before combining them into a single saliency map. Frintrop et al. [6] alters the saliency map weighting proposed in [5] and uses the inverse of the square root of the number of local maxima in the saliency map as weights instead. In Walker et al. [11] the Mahalanobis distance between a local feature vector and the environment’s mean feature vector is computed. 2.4
Reasoning Level
In the final level, contextual knowledge that can be gained from the syntactical and semantical level is condensed in order to efficiently allocate sensor resources in the present environment. Prior and dynamic contextual knowledge are used in order to prioritise candidate regions for observation, and to adapt traffic participant detection towards the present environment to increase resource efficiency. Prior Contextual Knowledge Prior contextual knowledge about the vehicles environment can be gained by considering the type of road the vehicle is presently using and the specific situation associated with it. Statistics about road traffic, and with that about road traffic accidents are able to provide a good basis for the assessment of individual level of danger in road traffic. It is possible to use the statistical data provided in [12] to determine the relative frequency and severity
M2SFA2 2008: Workshop on Multi-camera and Multi-modal Sensor Fusion
5
inria-00326770, version 1 - 5 Oct 2008
of accidents for different traffic participant types Φ and for different road types RT . For 2006, the conditional probability PA (A | RT, Φ) of an accident A is given in Tab. 4, which is relegated to the appendix for better readability. Apart from observing the frequency of traffic accidents, the severity S of these is of importance. The conditional probability PS (S | RT, Φ) of severities for road traffic accidents with injured persons differentiated by the type of road traffic participation, and type of road is shown in Tab. 5. At this point, it is possible to begin a failure mode and effects analysis (FMEA), which considers both the frequency of accidents, and the resulting effects thereof. The most problematic issue for the given FMEA is the valuation of a killed person against a person severely or mildly injured, which quickly becomes an ethical question that cannot be answered. As a means of overcoming this dilemma the socio economic costs of an injury c(S) caused by road traffic accidents can be considered instead, using the numbers given in [13] for 2004. – Mildly injured – Severely injured – Killed
3,885 Euro 87,269 Euro 1,161,885 Euro
In order to conduct the FMEA we can determine the average socio-economic costs b c(RT, Φ) for a traffic accident with injured persons by summing the products of the conditional probability PS (S | RT, Φ) for road type and traffic participant with the respective socio-economic costs c(S) for all severities. X b c(RT, Φ) = PS (S | RT, Φ) · c(S) (1) S
Using PS (S | RT, Φ) from Tab. 5 and the socio-economic costs c(S) in Eq. 1 we obtain the values in Tab. 1 for b c. Road Type Pedestrian Bicycle Motorcycle Car Lorry Urban Traffic 53,255 30,552 38,182 21,876 30,286 Country Road 188,632 75,256 96,458 73,410 65,953 Motorway 488,383 224,680 110,076 60,102 78,517 Table 1. Average socio-economic costs b c(RT, Φ) in Euro for a traffic accident differentiated by type of traffic participation and road type.
The last step in calculating the relative FMEA costs crel (RT, Φ) is to determine the product of the relative frequency of traffic accidents with injuries PA (A | RT, Φ) and the average resulting costs b c(RT, Φ) thereof. !−1 X crel (RT, Φ) = PA (A | RT, Φ) · b c(RT, Φ) · PA (A | RT, Φ) · b c(RT, Φ) (2) Φ
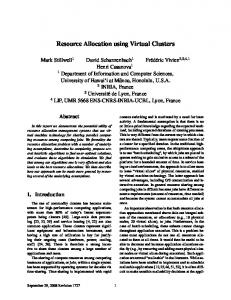
An objective prioritisation of traffic participant classes for the current situation can be derived from the relative FMEA costs shown in Fig. 3a. This prioritisation affects both traffic participant detection in form of an attentional adoption, and the sensor resource allocation in form of potential socio economic costs if a candidate region is disregarded.
6
M2SFA2 2008: Workshop on Multi-camera and Multi-modal Sensor Fusion
Dynamic Contextual Knowledge Prior contextual knowledge is used as long as no current knowledge about the present environment exists. Therefore it is valid to assume that the chance of a bicycle to appear on a motorway is almost zero. However, as soon as an object has been detected to be bicycle (CB ), using Bayes’ theorem the posterior probability for a bicycle to exist P (ΦB |CB ) equals
inria-00326770, version 1 - 5 Oct 2008
P (ΦB |CB ) =
P (CB | ΦB )P (ΦB ) P (CB )
(3)
where P (CB |ΦB ) is the true positive rate of the classifier, P (ΦB ) the prior probability, and P (CB ) a normalising constant. For P (ΦB |¬CB ), Eq. 3 can be applied analogously using P (¬CB | ΦB ) and P (¬CB ) instead. The relative FMEA costs crel can now be adapted to the current traffic participant probability P (Φι ). There also exist a number of cues, or objectives, that can be determined during runtime in order to improve resource efficiency. An example subset of these objectives is given below – Expected uncertainty reduction of region in case of observation, considering. Using the present level of uncertainty as an additional objective also acts an inhibition of return (cf. [5]) mechanism, reducing mutual information. – Sensor accuracy may vary for different candidate regions (e.g. distortion) and situations (e.g. fog), and can therefore be used as a further objective. – For active vision systems a gaze shift will need a certain time. Examining a candidate region close to the currently observed region may be preferable. Resource allocation and control The cues provided by traffic participant detection, by saliency determination, and by contextual knowledge are combined in the resource allocation and control module. Here the utility of observing a candidate region is assessed. The decision making process process determining the optimum resource assignment presents a multiobjective optimisation problem. Any acceptable solution for this class of problems is necessarily Pareto efficient.
0.7 0.6 0.5
1,0
Pedestrian Bicycle Motorcycle Car Lorry
µ2
0,8
0,6
0.4 0.3
0,4
0.2 0,2
0.1 0.0
a)
µ1
0,0
Urban Traffic
Country Road
Motorway
b)
0,0
0,2
0,4
0,6
0,8
1,0
Fig. 3. Fig. a) shows relative FMEA costs crel using Eq. 2. Fig. b) shows the Pareto frontier connecting 13 solutions (red) determined from 100 solutions (blue) representing the individual loss against the relative maximum utility value.
M2SFA2 2008: Workshop on Multi-camera and Multi-modal Sensor Fusion
7
inria-00326770, version 1 - 5 Oct 2008
The set of Pareto efficient solutions is called Pareto frontier and connects all solutions that are not dominated by any other solution (cf. Fig. 3b). A solution is said to be dominated by another solution if there is at least one other possible solution which shows an increase in one objective while exhibiting the same or better results for all other objectives. Each of the solutions on the Pareto frontier are objectively optimal. The problem now is the choice of only one solution, which is inherently subjective. It is unnecessary to determine the Pareto frontier in the decision making process, but it is necessary to ensure that every solution produced by the decision making process is element of the Pareto frontier and thereby Pareto efficient. There exists a range of algorithms exhibiting that property, such as – – – – –
Utilitarian (maximise sum of utilities or minimising sum of utility losses) Egalitarian (minimise worst utility loss or maximise least utility gain) Elitist (maximise best utility) Nash product (maximise utility product) Leximin ordering (sort by utility losses in ascending order)
where utility is determined by the utility function for every objective µι . Here, utility is defined to be the reduction of uncertainty about the environment within a certain timespan [14], and objectives are cues that should be regarded in order to optimise utility. A multiobjective optimisation algorithm combines all individual utilities into a common utility. Utility can be used as such, or can be transferred into a loss of utility f ↓ , which then represents the loss of utility of a certain objective as compared to the optimum utility for that objective. Pareto efficient decision making algorithms The notion of common utility can be used as a metric to determine the overall quality of a single allocation as well as, considering a large number of allocations, the quality of an allocation mechanism. Methods to ensure optimum common utility differ widely, however there are two main properties to consider: efficiency and fairness. Besides the concept of Pareto efficiency discussed above, the concept of fairness requires to ensure that the chosen allocation must be beneficial for as many individual objectives as possible. Below, we will discuss the utility optimisation algorithms that are used in existing approaches, which are Utilitarian for [2], and Nash product for [1]. It turns out that both [1, 2] appear to use these utility concepts intuitively without further consideration of properties such as efficiency or fairness. As a third algorithm, Egalitarian allocation is introduced, which is shown to work well for competing vision tasks (self localisation and obstacle avoidance) in [14]. In the decision making process an optimal resource allocation A∗ is determined. An allocation A consists of a resource R, and a candidate region C. The quality of A is expressed as combined utility and is calculated using a set of objectives µ. The set of candidate regions C is generated in three steps: 1. Append bounding rectangles containing detected traffic participants to C. 2. Append salient regions to C using a clustering algorithm on the saliency map. 3. Expand all C to the maximum observable size (14◦ horizontally).
8
M2SFA2 2008: Workshop on Multi-camera and Multi-modal Sensor Fusion
Utilitarian Common utility for an utilitarian resource allocation Au is defined to be the sum of all objectives individual utilities Aµι (cf. Eq. 4). X A∗u = arg max f (µι , R, C) (4) R,C
ι
An Utilitarian resource allocation ensures overall high local utilities, but cannot ensure fairness. Nash product The Nash product allocation A× is defined as the product of the objectives’ utilities (cf. Eq. 5). Y A∗× = arg max f (µι , R, C) (5)
inria-00326770, version 1 - 5 Oct 2008
R,C
ι
Using a Nash Product allocation is useful as it supports a balanced set of high local utilities. An obvious problem is the behaviour if at least one objective states a utility of zero or below, which results in the annihilation or sign change of the common utility for that region. It is generally desirable to maintain fairness; at the same time it offers a high leverage for even a single objective which can be problematic. An offset is commonly used to mitigate this problem. Egalitarian An egalitarian resource allocation is determined by the objective currently worst off. This term is ambivalent, as ’worst off’ could either mean the utility of an objective is low of the utility loss is high. For the first allocation Ae the minimum utility for any objective maximised (cf. Eq. 6), for the latter allocation Ae↓ , the maximum utility loss f ↓ is minimised (cf. Eq. 7). � � A∗e = arg max min f (µι , R, C) (6) ι
R,C
�
� A∗e↓ = arg min max f ↓ (µι , R, C) R,C
ι
(7)
Egalitarian resource allocations ensures that every objective is considered at the expense of optimising towards a high overall utility.
3
Evaluation
We evaluate our proposed method combination of using Walker et al. [11] saliency and an Egalitarian resource allocation against combinations proposed in [1, 2]. A common framework is used for this, allowing to select the desired saliency algorithm from [5,6,11]. Secondly, the resource allocation method can be selected as utilitarian, Nash product, and egalitarian. Our used sensor resolutions are as follows: the image of the fixed camera is converted to a grayscale image and downscaled to 320 × 240 px for traffic participant detection (5.8 px per degree), and 80 × 60 px for saliency computation (1.5 px per degree). The chosen candidate region is 14◦ wide and has a resolution of 240 × 180 px (17 px per degree).
M2SFA2 2008: Workshop on Multi-camera and Multi-modal Sensor Fusion
3.1
9
Performance Evaluation
Quantitative Evaluation For evaluation we use classifier cascades trained to detect cars and lorries for traffic participant detection, since the road traffic sequence is situated on a motorway (cf. section 2.4). For classification, cascades are trained to detect pedestrians, cars, and lorries exclusively. We disable our inhibition of return and transfer time objectives for evaluation, as this would influence the outcome of our evaluation because of diverging observation histories.
inria-00326770, version 1 - 5 Oct 2008
Frame #72, Utilitarian & Nash Product
Frame #72
Frame #72, Egalitarian
Fig. 4. Example evaluation output frame. Single and multiple detected traffic participants are marked with dotted orange bounding rectangles. Candidate regions from the saliency detection are marked as light-green ellipses. The final resource allocation is marked as solid red (Utilitarian), green (Nash Product), and blue (Egalitarian) rectangle. Full video sequence available online: http://emfs1.eps.hw.ac.uk/˜sm217/ownSequence.zip
We use video data recorded by our test vehicle for evaluation. The chosen image sequence is 100 frames long, and shows road traffic on a motorway. As a quality measure, we count both the number of correctly classified (true positives) traffic participants in the high-resolution image, and the number of false alarms (false positives). Our evaluation extend over all possible combinations of saliency algorithms and resource allocation concepts (cf. Tab. 2). Saliency method Utilitarian Nash Product Egalitarian Walker et al. [11] 87 (12) 87 (12) 89 (9) Itti [5] 87 (15) 87 (15) 87 (17) Frintrop et al. [6] 88 (13) 88 (13) 87 (18) Table 2. True positives and false positives (in brackets) for different combinations of saliency algorithms and resource allocation concepts. Combinations proposed in [1, 2] and our proposed concept are indicated using a bold font.
It can be seen from Tab. 2 that the general results are within a small margin. Both [1, 2] use combinations of saliency algorithms and resource allocation concepts that perform well, as does the combination of Walker et al. saliency and
10
M2SFA2 2008: Workshop on Multi-camera and Multi-modal Sensor Fusion
inria-00326770, version 1 - 5 Oct 2008
Egalitarian resource allocation, which we propose. The latter shows the highest number of true positives and smallest number of false positives, albeit only by a small margin. It turns out that using Utilitarian allocation and Nash product allocation returns the same optimum candidate regions because of the chosen normalisation of utility values towards a value range of [0 . . . 1]. For other value ranges Utilitarian and Nash Product allocation show diverging behaviour. Qualitative Evaluation Besides using sequences acquired with our test vehicle, the Caltech Cars 2001 (Rear) dataset1 was used as an input-sequence. Applying the proposed concept to this dataset is problematic, since each car in the dataset covers a substantial part of the image. If this part is larger than 14◦ , the region, albeit relevant, cannot be focussed. A video showing our system’s performance using the Caltech Cars 2001 dataset can be found online2 allowing a qualitative assessment of the proposed concept with a known database. Besides using recorded sequences, qualitative tests were conducted using our test vehicle (cf. Fig. 2). These test drives under real-life road traffic conditions were conducted using the PTZ camera as a second controllable sensor resource. The drawback of using a PTZ camera for evaluation is that data is only available for the region determined by the sensor resource allocation impeding a direct comparison of different resource allocation methods. 3.2
Computational Costs
The computational costs of our proposed active vision concepts are measured during runtime using our test vehicle (resolutions stated in section 3).
Module Resolution [px] Mean Time Traffic Participant Detection 320 × 240 14 ms Saliency Computation 80 × 60 1 ms Resource Allocation – 1 ms Traffic Participant Classification 240 × 180 11 ms Total 27 ms Table 3. Computational costs
Table 3 shows that the computational costs of the proposed system are low. The total mean execution time is measured to be 27ms per frame (40 frames per second (fps)) using a 2GHz CPU. The longest total execution time measured was 59ms (16.9 fps). The frame rate of our cameras is 15 fps, therefore we are able to process all frames in real-time. 1
2
The Caltech Cars 2001 (Rear) dataset is publicly available and can be found at http://www.vision.caltech.edu/html-files/archive.html A video of the results for the Caltech cars 2001 dataset is available online (cf. Fig. 4) http://emfs1.eps.hw.ac.uk/˜sm217/calTechCars.zip
M2SFA2 2008: Workshop on Multi-camera and Multi-modal Sensor Fusion
inria-00326770, version 1 - 5 Oct 2008
4
11
Conclusion and Further Work
We propose an extension for two recent active vision systems proposed in Navalpakkam and Itti [1], and Frintrop [2]. The novelty of our proposed system is twofold and affects two core mechanisms for active vision systems. First it extends existing approaches using both prior and dynamic contextual knowledge, enabling to adapt the active vision system to the present environment. Second, the decision making process intuitively used in [1, 2] is formalised in this paper and put it into the context of multiobjective optimisation using a utility concept. We choose three different saliency algorithms to be used in the system as well as three different methods to determine common utility. An implementation of our presented system is quantitatively evaluated on a motorway traffic sequence recorded with our test vehicle. Our evaluation shows that the proposed system is able to efficiently allocate sensor resources using different saliency - resource allocation combinations. Using [11] for saliency detection and an Egalitarian resource allocation returned the best results for both correct classification rate, and false positive rate. At the same time the proposed system is computationally inexpensive with a mean frame rate of 40 fps, and 16 fps as a worst case measurement, using a 2GHz CPU. The inclusion of further sensors such as a PMD 3-D camera and radar targets into our evaluation framework presents further work. An implementation of the occlusion detection algorithm as a further objective will help to avoid the observation of partially occluded objects. Finally, an extensive evaluation of the proposed system using all sensors on different road types presents further work.
References 1. Navalpakkam, V., Itti, L.: An integrated model of top-down and bottom-up attention for optimizing detection speed. In: Proceedings of the IEEE Conference on Computer Vision and Pattern Recognition. Volume 02. (2006) 2049–2056 2. Frintrop, S.: VOCUS: A Visual Attention System for Object Detection and GoalDirected Search. LNAI 3899. Springer (2006) 3. Anderson, C., Van Essen, D., Olshausen, B.: Directed Visual Attention and the Dynamic Control of Information Flow. In: Neurobiology of Attention. Elsevier (2005) 11–17 4. Mitri, S., Frintrop, S., Perv¨ olz, K., Surmann, H., N¨ uchter, A.: Robust object detection at regions of interest with an application in ball recognition. In: Proceedings of the IEEE International Conference on Robotics and Automation. (2005) 125–130 5. Itti, L.: Models of Bottom-Up and Top-Down Visual Attention. PhD thesis, California Institute of Technology, Computation and Neural Systems (2000) 6. Frintrop, S., N¨ uchter, A., Surmann, H., Hertzberg, J.: Saliency-based object recognition in 3d data. In: Proceedings of the 2004 IEEE/RSJ International Conference on Intelligent Robots and Systems. (2004) 7. Viola, P.A., Jones, M.J.: Robust real-time face detection. International Journal of Computer Vision 57 (2004) 137–154 8. Tourapis, A.M., Au, O.C., Liou, M.L.: Predictive motion vector field adaptive search technique (PMVFAST) - enhancing block based motion estimation. In: Proceedings of Visual Communications and Image Processing. (2001)
12
M2SFA2 2008: Workshop on Multi-camera and Multi-modal Sensor Fusion
9. Matzka, S., Petillot, Y.R., Wallace, A.M.: Fast motion estimation on range image sequences acquired with a 3-d camera. In: Proceedings of the British Machine Vision Conference. Volume II., BMVA Press (2007) 750–759 10. Treisman, A.: Preattentive processing in vision. Computer Vision, Graphics, and Image Processing 31 (1985) 156–177 11. Walker, K.N., Cootes, T.F., Taylor, C.J.: Locating salient object features. In: British Machine Vision Conference (BMVC), BMVA Press (1998) 557–566 12. Statistisches Bundesamt: Verkehrsunf¨ alle 2006 (Survey of road accidents in 2006). revised edn. Fachserie 8, Reihe 7. Statistisches Bundesamt, Wiesbaden (2007) 13. H¨ ohnscheid, K.J., Straube, M.: Socio-economic costs due to road traffic accidents in Germany 2004. Bundesanstalt f¨ ur Straßenwesen, Bergisch Gladbach (2006) 14. Seara, J.F.: Intelligent gaze control for vision-guided humanoid walking. PhD thesis, Technische Universit¨ at M¨ unchen (2004)
inria-00326770, version 1 - 5 Oct 2008
A
Road Traffic Statistics
Road Type Pedestrian Bicycle Motorcycle Car Lorry Urban Traffic 8.8% 17.5% 9.2% 60.6% 3.9% Country Road 1.8% 4.7% 9.5% 72.2% 11.7% Motorway 0.5% 0.1% 2.5% 73.2% 23.6% Table 4. Percentages of persons injured in accidents with cars in 2006 differentiated by type of traffic participation and road types. Source: [12], Tab. UJ 5 (1-4).
Road Type
Participant Pedestrian Bicycle Urban Traffic Motorcycle Car Lorry
Killed Severely Injur. Mildly Injur. 0.019 0.329 0.779 0.006 0.236 0.854 0.010 0.271 0.853 0.005 0.141 1.115 0.012 0.139 1.057
Pedestrian Bicycle Country Road Motorcycle Car Lorry
0.124 0.031 0.044 0.034 0.034
0.486 0.425 0.493 0.337 0.260
0.647 0.697 0.660 1.154 1.076
Pedestrian 0.391 0.348 0.870 Bicycle 0.167 0.333 0.500 Motorway Motorcycle 0.061 0.423 0.623 Car 0.027 0.274 1.315 Lorry 0.041 0.307 1.115 Table 5. Average casualties per road traffic accident with injured persons. Mild injuries are injuries that require less than 24 hours of stationary medical treatment, killed persons are persons dying within 30 days from the injuries caused by the accident. Source: [12], Tab. UJ 22 (1-3).