Efficient Spatial Image Watermarking via New Perceptual Masking and Blind Detection Schemes Irene G. Karybali, Member, IEEE, and Kostas Berberidis, Member, IEEE
Abstract—The aim of this paper is to improve the performance of spatial domain watermarking. To this end, a new perceptual mask and a new detection scheme are proposed. The proposed spatial perceptual mask is based on the cover image prediction error sequence and matches very well with the properties of the human visual system. It exhibits superior performance compared to existing spatial masking schemes. Moreover, it allows for a significantly increased strength of the watermark while, at the same time, the watermark visibility is decreased. The new blind detection scheme comprises an efficient prewhitening process and a correlation-based detector. The prewhitening process is based on the least-squares prediction error filter and substantially improves the detector’s performance. The correlation-based detector that was selected is shown to be the most suitable for the problem at hand. The improved performance of the proposed detection scheme has been justified theoretically for the case of linear filtering plus noise attack and through extensive simulations. The theoretical analysis is independent of the proposed mask and the derived expressions can be used for any watermarking technique based on spatial masking. It is shown though that in most cases the detector performs better if the proposed mask is employed. Index Terms—Blind detection, copyright protection, image watermarking, spatial perceptual masking.
I. INTRODUCTION OPYRIGHT protection and authentication of digital data via watermarking is an issue of intense research worldwide in recent years. As the Internet serves the mass distribution of digital data, everyone has access to such data without paying any compensation to the actual owners. Consequently, the piracy proliferates and the development of techniques that provide copyright protection becomes a necessity. Cryptography and watermarking are two such techniques that work complementarily [1]. Cryptography protects the digital data during its transmission, but at the receiver, the data are identical to the original ones and, thus, no longer protected. Watermarking comes to solve this problem, by embedding an imperceptible signal, a watermark, directly into the original data, in such a way that it is difficult to be removed. There are also perceptible watermarks, but the imperceptible ones are more suitable for becoming part of a copyright protection system for obvious
C
Manuscript received March 1, 2006; revised March 3, 2006. This work was supported by the European Social Fund (ESF), Operational Program for Educational and Vocational Training II (EPEAEK II), HERAKLITOS. The associate editor coordinating the review of this manuscript and approving it for publication was Prof. Pierre Moulin. (This manuscript was initially submitted to IEEE TRANSACTIONS ON IMAGE PROCESSING on October 27, 2004; revised May 23, 2005. The associate editor coordinating the review for IEEE TRANSACTIONS ON IMAGE PROCESSING was Prof. Benoit Macq). The authors are with the Computer Engineering and Informatics Department, University of Patras, Patras 26500, Greece (e-mail:
[email protected];
[email protected]).
reasons. The watermarks are usually key-generated pseudorandom patterns. The keys identify legal owners and should have a secure length to be robust to cryptographic attacks. There are some contradictory requirements in the watermarking process. The embedded watermark should not affect the image quality in a visible manner, but, at the same time, it has to be robust to attacks. Obviously, a high energy watermark is more robust than a low energy one, but the acceptable value of a watermark’s energy depends on the image characteristics. Loosely speaking, the image capacity is the amount of information that can be reliably embedded in an image without producing visible artifacts. Thus, a compromise between watermark robustness and visibility has to be made. The employment of perceptual masks, which take into account the properties of the human visual system (HVS), turns out to be an effective way to improve the robustness of a watermark without affecting the image quality [2]. The HVS is less sensitive to distortions around edges and in textured areas. In [3], a masking function based on local image properties is proposed. In [4], the watermark is embedded in the blue channel, exploiting the fact that the human eye is less sensitive to this particular channel. In [2], the watermark is added to a number of low frequency discrete cosine transform (DCT) coefficients, adapted by the coefficients’ strength. In [5], the Watson’s model [6] is employed for watermark embedding in the transform domains. The authors of [7] propose an alternative transform watermarking approach that takes into account spatial domain constraints. Delaigle et al. [8] consider the masking of bandlimited noise in texture regions and around contours. Recently, the authors of [9] have presented a perceptual model that takes into account the sensitivity and masking behavior of the HVS by means of a local isotropic contrast measure and a masking model. More references regarding masking techniques can be found in [10] and [11]. In this paper, a new spatial perceptual mask is proposed, which is based on the least-squares (LS) prediction error sequence of the cover image. The LS prediction error sequence matches quite well the characteristics of the HVS, since the errors are expected to be smaller in smooth areas than in edges and textured areas. The new mask has been derived so as to enhance the robustness of the embedded watermark against the so-called denoising attack. The denoising attack is assumed to be performed using the adaptive LS prediction error filter. Such an attack is based directly on the data, without invoking any assumptions concerning the image statistics [12], [13]. The proposed mask exhibits superior performance compared to existing ones. It allows substantially increased watermark strength while, at the same time, watermark visibility is decreased. Its improved performance is also verified by the detection procedure, in which the proposed embedding is shown to be more robust.
Many detectors have been proposed in literature with the correlator being the most common. Their optimality mainly depends on the assumptions made about the distribution of the original image data. For instance, the DCT coefficients (excluding the dc coefficient) can be reasonably well approximated by the generalized Gaussian distribution, as shown in [14] and [15]. This distribution is employed for designing detectors for additive watermarks [16], [17] and for multiplicative watermarks [18]. In [19], where a multiplicative watermark is embedded in the discrete Fourier transform (DFT) domain, a Weibull distribution is used for the description of the coefficients’ magnitude and the construction of the corresponding detector. These detectors exhibit improved performance compared to the conventional correlator, which is optimal for data with Gaussian distribution. In many cases, however, it is difficult to find a satisfactory statistical model for the data [20], [21]. For example, for real images in spatial domain, it is reasonable to assume that flat regions have a Gaussian distribution, but textured areas or regions containing edges have some other highly peaked near zero distribution. In such cases, a common strategy is to consider a Gaussian model for the noise (the original image in our case) and use a correlation-based detector [20]. This strategy is often followed in spread-spectrum communications. In this work, we propose the use of an improved correlation-based detector by incorporating an efficient scheme that whitens effectively the noise process (i.e., the image itself). Specifically, in the detection process, the normalized correlation between the LS prediction error sequence of the received image and the filtered (with the LS prediction error filter) estimation of the masked watermark is computed. The proposed detector’s improved performance has been justified theoretically for the case of linear filtering plus noise attack, and has also been verified through extensive simulations. The theoretical analysis is independent of the proposed mask and is valid for any watermarking technique based on spatial masking. It should be noted though that in most cases, the detector performs better if the proposed mask is employed. Extensive experiments have shown that the proposed watermarking scheme is robust not only to linear filtering plus additive white noise attack but to several other attacks as well (nonlinear attacks, JPEG compression, etc.). This paper is organized as follows. In Section II, the problem is formulated, the new perceptual mask is derived, and its performance is studied. In Section III, the proposed detection scheme is presented and theoretical results concerning its performance are derived. Section IV discusses the suitability of the correlator for the problem at hand compared to another detector based on the generalized Gaussian distribution. Experimental results are presented in Section V, where the beneficial effect of the proposed mask on detection is also verified. Finally, in Section VI, the work is concluded. II. PROPOSED WATERMARK EMBEDDING A. Problem Formulation the watermark, which is a Let be a cover image and Gaussian distributed pseudorandom pattern with zero mean and variance . The watermark is of the same size (and uncorrelated) with the cover image. The watermarked image in the most
Fig. 1. General denoising scheme.
simple case, where the image content is not taken into account (i.e., no perceptual masking is used), can be written as
(1) If spatial perceptual masking is used, then denoting the involved mask by , the watermarked image can be written as
(2) stands for pointwise multiplication. The strength of where the watermark (i.e., its standard deviation) is incorporated into . The masked watermark is a zero mean white process. It depends on (via ), but is uncorrelated with because has zero mean. B. Image Denoising and Perceptual Masking Consider now the problem of watermark estimation. The watermark in (1) can be estimated by subtracting the estimated cover image from the watermarked image . The estimation of the cover image corresponds to the image denoising problem. A linear filter can be used for denoising, the impulse response of which should be selected so as to minimize some properly chosen distance between the original and the estimated image. A common scheme for image denoising is shown in Fig. 1. The mean value of the noisy image is subtracted, ensuring that will be an unbiased estimate of , [22]. The estimate of the original image is given by
(3) is a vector where is the denoising filter in vector form, containing the corresponding pixels of the noncausal neighborhood of taken row-wise, and vector contains the respective local mean values. We observe in (3) that the image is decomposed into a lowfrequency part and a high-frequency part . The denoising filter mainly affects the high-frequency part of the image (a fact that should be taken into account during watermark embedding). We would like to amplify the watermark in the high frequencies, which correspond to textured image areas and edges, in order to make a watermark robust to the denoising attack. This strategy matches the properties of the HVS, since noise is less noticeable in such areas. So, the next step is concentrated on finding a proper perceptual mask to compensate for denoising.
C. Derivation of the New Perceptual Mask
relation vector, computed as , where
and
When a perceptual mask is designed so as to make the embedded watermark resistant against denoising, the way a denoising filter acts on an image should be taken into account. In [3], the denoising attack is performed using adaptive Wiener filtering [22], that is, the original image is pixel-by-pixel estimated via the relation
(4) where and denote the local variances of the original image and the watermark, respectively. Assuming a nonstationary Gaussian model, the perceptual mask is defined as
(5) where NVF is the noise visibility function. In this paper, the denoising attack is assumed to be performed using the adaptive LS noncausal prediction error filter. Such an attack is based directly on the data, without invoking any assumptions concerning the statistics of the image [12], [13], as in the case of adaptive Wiener filtering where the original image is assumed to be a locally white process. The LS prediction error filter is computed by minimizing the cost function
The solution of the above system yields the linear predictor [12]. The prediction error filter is a array having 1 in the in the other positions. It is center and the coefficients reshaped in vector form and is denoted hereafter as . Then, the prediction error sequence is derived as (9) or (10) Using the prediction error filter in the denoising process, the estimation of the original image is
(6)
where denotes linear prediction, is the is the predicted value of number of pixels, and given by
(7) is a -length vector containing the linear where conpredictor’s coefficients taken row-wise, and vector noncausal tains row-wise the corresponding pixels of the (except for the central one at ), neighborhood of with assumed odd. Minimization of the cost function of (6) leads to the following system of normal with respect to equations:
where is the matrix of input , and
(11) is the LS prediction error filter computed over the where and are defined similarly to noisy image, and . The LS prediction error filter can also be computed adaptively using a recursive algorithm, for example, a two-dimensional (2-D) recursive least squares (RLS) [23] or a 2-D least mean squares (LMS) [24]. Then, the estimate of the original image is given by
(8)
(12)
sample auto-correlation is the respective sample cross-cor-
contains the filter’s coefficients for the where pixel. A more efficient procedure would be to compute the
filter’s coefficients for blocks of the image instead of computing them for each pixel. Let us now study the way that an LS prediction error filter (adaptive or not) acts on an image in order to remove its noise. and Note that the terms in relations (11) and (12) correspond to the prediction error sequence based on the nonadaptive and adaptive predictor, respectively. Note, however, that independently of the way the LS prediction error filter’s coefficients are computed, the resulting LS prediction error sequence is image adaptive. Actually, if the image is smooth, it is more predictable and the prediction error takes values near to zero. Thus, from (11) [or (12)], we can easily deduce that the estimated pixel tends to its local mean. If the image is textured or has too many edges, it is not particularly predictable and, as a result, the prediction error takes high values. In fact, in such areas, the pixels in (8) will in a neighborhood will be (ideally) uncorrelated, will be a diagonal matrix and the solution have zero values, of the system will be zero (i.e., the coefficients of the predictor will be zeros). Thus, (11) [or (12)] implies that the estimated . pixel is practically the noisy pixel The above analysis indicates that the prediction error is a good descriptor of the local image properties and, as a result, we can use it as a perceptual mask. It varies spatially in a manner well suited to the HVS, a fact that will be also verified by the study conducted in Section II-D concerning the perceptual quality of the watermarked images. In fact, the proposed mask is a normalized version of the prediction error magnitude, so as its values are in the range [0,1], that is
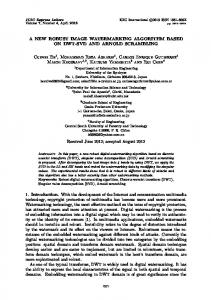
Fig. 2. Original images: Lenna and Mandrill.
subjective experiments. This is rather impractical for automatic watermarking techniques. In our experiments, for these parameters, we used the values provided in [9], which were determined via the evaluations of three subjects. More information concerning the construction of the mask can be found in [25] and [26]. We also note that a normalized version of was used (i.e., was divided by its maximum magnitude value), in order to be comparable to the other masks as far as the watermark strength is concerned. This normalization does not have any effect on the mask’s performance. For the and masks’ computation, we utilized 5 5 noncausal neighborhoods. The masks of the two examined images are shown in Fig. 3. seems to be overloaded in textured areas and around edges, especially for Mandrill, in contrast with the and the proposed mask , which have their high values more concentrated in those regions. In order to obtain identical values for the peak signal-to-noise ratio (PSNR) defined as
(13) Although this mask increases substantially the strength of the mask watermark, it decreases its visibility more than the . defined in (5) and an HVS-based mask [9], so-called Moreover, its superior performance as compared to demonstrates that the LS prediction error can provide a good estimation of the local masking capabilities. It should be noted that the computation of the LS prediction error filter, which is necessary for the mask’s computation, is a user-defined issue. For simplicity, in our implementation, we do not compute the filter adaptively. D. Study of the Proposed Mask’s Performance We tested the performance of the proposed mask through extensive simulations. We present here some experiments, applied to the well-known images of Lenna (512 512) and Mandrill (478 500), shown in Fig. 2. Lenna is an image with large, smooth areas, while Mandrill is a rather textured image. The experiments were performed for two cases, that is, the direct watermark embedding case, where image content is not taken into account (i.e., no masking is used), and the perceptual maskingbased watermark embedding case. In the second case, the proposed mask was compared to the and the masks. The mask contains parameters, the values of which are determined by means of
(14) is the Euclidean norm, we adjusted properly the where strength (i.e., the standard deviation) of the watermark for the compared embedding methods. As we can see in Table I for Lenna and in Table II for Mandrill, the new mask allows the insertion of substantially higher watermark strengths. This results in very robust watermarks as will be seen later in experiments concerning the watermark detection process. But what happens with the watermark visibility? In fact, there are two ways of measuring the perceptual quality of the data, namely, subjectively and objectively. The subjective method involves a panel of viewers, to whom host, watermarked, and received data are presented for grading. But since subjective quality assessment methods involve human interaction, they are obviously not suitable for automatic benchmarking. For an automatic benchmarking of the visual quality of the data, we have to rely on numerical measurements [27]. For objective quality assessment, advanced visual quality metrics have to take into account the fundamental aspects of the visual perception. Ideally, a perceptual model intended for automatic fidelity tests should match the results performed with human observers. However, for comparing different watermarking algorithms, it is sufficient for the model to provide a value that is monotonically related to
TABLE I LENNA-WATERMARK STRENGTH AND VISIBILITY FOR DIFFERENT EMBEDDING METHODS
Fig. 3. The NVF-based masks (a) and (b), the HVS-based masks (c) and (d), and the prediction-error-based (proposed) masks (e) and (f), for the images Lenna and Mandrill. The HVS mask and the proposed mask are amplified by a factor of 2 and 20, respectively, for viewing purposes.
the results of human tests. That is, it is not necessary for the model to match the exact results of tests performed with human
observers, but simply to predict the relative performance of different algorithms in those tests [28]. Carrying out subjective tests for the images’ quality assessment is a useful but also very complicated task since such experiments are statistical in nature. Different observers will behave differently. Thus, a large number of subjects is needed and a large number of trials should be performed. Such a procedure, if not done properly, may be quite misleading. As a result, in order to assess the watermarked images’ quality, we used some quality metrics from Checkmark [29], [30], which is an open-source, Web-accessible [31] benchmark. The first quality metric was the weighted PSRN (wPSNR), which is an adaptation of the classical PSNR that introduces different weights for the perceptually different regions, as opposed to the PSNR where all regions are treated with the same weight. So, the weighted PSNR is a more reliable quality measure. In Checkmark, the PSNR weighting is done using NVF. We can see in our experiments that the proposed masking offers higher wPSNR values, which implies improved performance as far as the watermark visibility is concerned. Note also that the values of wPSNR for the Mandrill image are higher than in the Lenna case, which is quite reasonable since a watermark is less visible in a textured image rather than in a smooth one. In order to further investigate the watermark visibility, two more quality metrics were used: the total perceptual error (TPE), which is a global perceptual measure, and the NLPE2 (number of blocks greater than the second local perceptual error threshold), which is a local one. These metrics have been derived from the Watson’s model [6] and are included in Checkmark. TPE is a global perceptual error independent of the image size. NLPE2 evaluates the image quality locally, in blocks of the image. Here, blocks of dimensions 32 32 were employed. The thresholds for these metrics that are default in Checkmark have been determined by subjective tests for different types of images and then taking the average values [30]. In all experiments we conducted, the smallest TPE values were achieved for the proposed watermark embedding. Thus, in addition to the wPSNR, TPE also indicates that the performance of the new mask, in terms of image quality, is better than that of and , despite the fact that the
TABLE II MANDRILL-WATERMARK STRENGTH AND VISIBILITY FOR DIFFERENT EMBEDDING METHODS
proposed mask allows the insertion of watermarks with much higher strengths. However, in some cases, even if the total perceptual error is small, the image is locally distorted in a visible manner. We use the NLPE2 in order to evaluate the local image quality. According to NLPE2, if the quality of a single block is unacceptable, the whole image is rejected as unacceptable. This seems to be excessively demanding since if the distortions take place in textured areas, they are hardly perceptible. Usually, an image is considered to be acceptable if PSNR is at least 45 dB. In Tables I and II, heavier embedding cases are also included. For a PSNR equal to 35 dB, our method seems to be inferior with respect to the local image quality, as more blocks of the watermarked images appear to have unacceptable quality compared to the other three methods. This obviously occurs because, in some regions, the watermark is “overembedded.” However, these regions are textures and edges and the distortion is hardly visible. On the other hand, if the images are watermarked with the other three methods, although they appear to have better local quality, they have such values for the wPSNR and the TPE that indicate worse global quality, which is a more serious problem. This statement is verified by the images shown in Fig. 4. The three compared masks have been used for embedding and the PSNR of the resulting watermarked images is equal to 35 dB. For the NVF- and the HVS-based masks, the images are shown to be noisy (less noisy for the HVS case), while for the proposed mask, there are no really perceptible artifacts. In Tables I and II, we also provide results for the cases that PSNR is 30 dB and 25 dB (i.e., the images are heavily watermarked). As can be seen, in those cases, our method offers better global as well as local quality. To justify the performance of the proposed mask, we should recall that it is a normalized version of the prediction error sequence. The prediction error is possible to have some very high (positive or negative) values if good prediction is not possible. This results in the “overembedding” of a watermark in such unpredictable regions. However, such values of error appear with very low probability. Refer, for example, to the histograms of the prediction errors for Lenna and Mandrill in Fig. 5. The maximum value of the prediction error for Lenna is 58.1253, while the minimum one is 33.1791. The corresponding values for Madrill are 108.0902 and 114.8250. Note though that the
Fig. 4. Images after watermark embedding: (a) and (b) for the NVF-based masking, (c) and (d) for the HVS-based masking, and (e) and (f) for the prediction-error-based (proposed) masking. The PSNR is 35 dB.
prediction error values range from 12 to 12 for Lenna and from 50 to 50 for Mandrill for the majority of the image’s pixels.
Fig. 5. Histograms for the prediction errors of (a) Lenna and (b) Mandrill. 33:1791, Max: val: = 58:1253; (b) Min: val: = (a) Min: val: = 114:8250, Max: val: = 108:0902.
0
0
Fig. 7. Histograms for the NVF-based masks of (a) Lenna and (b) Mandrill. (a) Mean value = 0:8276; (b) Mean value = 0:9501.
Fig. 8. Histograms for the HVS-based masks of (a) Lenna and (b) Mandrill. (a) Mean value = 0:1435; (b) Mean value = 0:2287.
Fig. 6. Histograms for the prediction error-based masks of (a) Lenna and (b) Mandrill. (a) Mean value = 0:0195; (b) Mean value = 0:0476.
with the HVS-based mask indicate that the proposed mask describes the HVS very well, having also the advantage of not requiring any parameters’ evaluation.
Hence, we could apply appropriate thresholds to the error values in order to cope with this local “overembedding” phenomenon. As we have already mentioned, our aim is to provide a good tradeoff between watermark visibility and watermark robustness. As it is concluded from the above analysis, the proposed mask exhibits efficient visibility properties. Even more interesting is that it also yields very high watermark energies. This results in rather robust watermarks, a fact which will be verified later, in the detection stage analysis. The new mask’s capability of providing high watermark energies is easily explained by the histograms of the masks for the examined images in Fig. 6. Note that their mean values are 0.0195 and 0.0476, for Lenna and Mandrill, respectively. Even in the case that each mask may be computed by the thresholded prediction error, as it was described above, the masks’ mean values are 0.0895 and 0.1087. Observe now the histograms of the NVF-based masks in Fig. 7 where the mean values are 0.8276 and 0.9501. The NVF-based mask’s values are concentrated in the opposite direction compared to the proposed mask. This explains why this latter mask cannot provide very high watermark strengths and why it seems to be overloaded around the edges. In Fig. 8, the histograms of the HVS-based mask’s magnitude (in order to be comparable to the other masks’ histograms) are shown. They resemble the proposed mask’s histograms, but the mean values are 0.1435 and 0.2287, indicating lower watermark strengths. Concluding the above study, we could say that the advantages of the proposed masking scheme are significant. Very high watermark energies are provided, while, at the same time, the watermark visibility is quite improved compared to the other three embedding methods. Moreover, the results of the comparison
III. PROPOSED DETECTION SCHEME Usually, the blind watermark detection procedure employs a similarity measure based on the correlation between the watermark and the received image. Recently, more sophisticated detectors have been developed based on the simple hypothesis testing problem [32]. However, since in the spatial domain it is difficult to find a satisfactory statistical model that properly describes a real image, we adopted here a correlation-based detector and we focused on improving its performance. The proposed detection scheme consists of two steps. In the first step, a proper prewhitening procedure is applied to the received image and the estimation of the masked watermark, while in the second step, the normalized correlation measure for the resulting prewhitened sequences is computed. The prewhitening filter is the LS prediction error filter that has also been used in Section II for the computation of the perceptual mask. The normalized correlation employed in the second step is one of the most common detection measures and is preferred (instead of the linear correlation) due to its robustness to amplitude changes in the image. There are two characteristics of the proposed detection scheme that deserve particular attention. The first one is that the estimation of the perceptually masked watermark is employed in detection, instead of the watermark itself. This is very important for the detector’s performance, since we have , where is the proved in [33] and [34] that if is its mean value, then it is preferable mask’s power and to use the masked watermark (its estimation actually) in the is detection procedure. Obviously, the condition
always true, except for the case that the mask is a constant. Assuming that the received image retains (approximately) the predictability properties of the cover image, we can obtain at the receiver’s end. a satisfactory estimate of the mask The second characteristic of the proposed detection scheme is that it incorporates an efficient prewhitening step based on the 2-D noncausal linear prediction error filter. In fact, it turns out that the proposed scheme is an extension of well-established techniques in communications for detecting signals in colored noise. Note that in our case, the signal to be detected is the masked watermark, while the colored noise is the attacked image. Of course, prewhitening techniques have already been presented in literature for the problem at hand (see [28] and the references therein). For example, the use of a prewhitening filter for image watermarking was first suggested in [35], where a horizontal difference filter is applied to the image rows. The LS prediction error filter proposed here has the important property that its output tends to a white process. Thus, it adapts itself to the input by absorbing all of its color. Actually, it reduces the image’s effect on the watermark detectability. In the following, the performance of the proposed detector is studied and compared against the conventional one (without the prewhitening step). Note that ideal conditions are usually considered in the detection procedure. That is, each watermark is assumed to be a white process completely uncorrelated with the other watermarks and the cover image. However, in a practical situation, the above assumptions are only approximately true. As a result, quantities that are ideally assumed to be zeros must now be taken into account, since they may affect the decision that is made about a watermark’s existence, mainly after heavy attacks. In fact, in all of the involved auto- and cross-correlation quantities, the expectation operators should be replaced by time averages (i.e., empirical correlations). Also, the empirical correlation between the received image (or its prediction error) and another watermark (different from the embedded one) will no longer be zero. The analysis presented here has been conducted for the general case of linear filtering plus noise attack. In such a case, the image is given by
(15) where vector contains the coefficients of a linear filter of size taken row-wise. It is assumed that, in general, . In our analysis, is considered to be the truncated central part of filter that has dimensions (i.e., equal to those an is additive white of the prediction error filter). Sequence Gaussian noise, with zero mean and variance . Three detection scenaria have been investigated (that is, a) detecting a nonmasked watermark using , b) detecting a masked watermark using , and c) detecting a masked watermark, using , where the mask is estimated from the received image. The third scenario is presented here, which is actually the most general one and also the most effective as mentioned above. The aim is to compare the derived correlation measures when either the image itself and the estima-
tion of the masked watermark (conventional scheme, without prewhitening) or the prediction error of the image and the filtered estimation of the masked watermark (proposed scheme) are used in the detection procedure. The prediction error for , the received image is given by while the filtered estimation of the masked watermark is given . by The performance analysis has been conducted following i) a deterministic approach, and ii) a statistical approach, which will be presented in the following two subsections. A. Deterministic Approach In the deterministic approach followed here, the correlation measures between different watermarks or between a watermark different from the embedded one and the image, are assumed to have a magnitude that is upper bounded by a small positive scalar . The normalized correlation measure computed for two and of size is defined as 2-D sequences
(16) is the number of pixels. The magnitude where tends to zero if and are uncorrelated or tends to of and are highly correlated. one if The normalized correlation measures for the detection schemes under comparison (i.e., the conventional and the and , respectively. proposed one) are denoted as and in order to find We compare the magnitudes of under which conditions the proposed scheme provides higher correlation values. After standard manipulations (details can be found in Appendix A), we obtain that
then
if
(17) where is a positive number smaller than 1, is a small scalar (it is zero in the ideal case), is the central element of the linear defined as filter, and is a matrix of dimensions
.. .
..
.
.. .
which is a -Toeplitz matrix with zeros in the primary equals , where diagonal. The quantity denotes sample averages. Assuming that is a reliable estimate , with being the power of , of mask . The expressions for the special cases of linear filtering attack, noise attack, and no attack can be easily derived by a proper selection of the involved parameters. In the case of
linear filtering attack, it turns out that inequality (17) is valid if . Such filters are those with a dominant central part as, for example, the Laplacian, the Gaussian, and the unsharp filter. On the contrary, for filters with a nondominant central part (e.g., average filter), the watermark is not detectable. Since the analysis is independent of the proposed mask’s properties, the derived result is general and valid for any type of spatial masking. Hence, if the condition in (17) holds, then the proposed correlation measure has higher values compared to the conventional one, indicating that the proposed detector has better performance. The case of a nonwatermarked image is not examined here since, in such a case, the outputs of the normalized correlations for both schemes under comparison will be approximately the same (recall that they are ideally considered to be zeros).
values of the desired means and variances very reliably and also help us to gain more insight in the attack’s effect on the detection. More details about the derivation of the expressions and the approximation’s reliability can be found in Appendix B. Next, we provide the derived expressions for both detectors under comparison, under each hypothesis
B. Statistical Approach To gain more insight in the detectors performance, a statistical approach follows, in which the normalized correlations’ outputs are considered as random variables. We formulate the watermark detection task as the following binary hypothesis testing problem:
where . Depending on whether the image is a filtered and noisy version of a watermarked or a nonwatermarked and . The perforimage, we distinguish the hypotheses mance of the watermark detection can be measured in terms of and the probability of detection the false alarm probability for a given original image. is the proportion of keys for which we erroneously decide that the image under test contains a specific watermark, whereas the image is not watermarked. is the proportion of keys for which we correctly decide that the image contains a specific watermark. Again, the measures for the two detection schemes under and , comparison are the normalized correlations which are now considered as random variables with Gaussian and . Generally, distributions, conditioned to hypotheses since the normalized correlations are bounded between 1, they can be assumed Gaussian only if some constraints are satisfied. That is, the standard deviations of the competing distributions must be small relative to 1, the means of these distributions should not be close to 1 or 1 and the distance between the means must be of the same order of magnitude as the standard deviations. These three constraints are satisfied in our case as verified by the experimental results shown in Section V. Due to the form of the normalized correlation, the means and variances of its outputs cannot be expressed by easy-to-interpret formulas. In order to avoid rather complicated forms, we derive here relatively simple expressions that approximate the actual
where are terms of order , where is a very small scalar. Such quantities are ideally considered to be zeros. Some of the quantities involved in the above computations are known is the power of the and others can be estimated. For example, received image . Also, knowing the key, we can reproduce the watermark and after estimating the mask from the received can also image , we can find . The prediction error filter be estimated from , enabling the computation of the prediction error sequence and the filtered estimation of the masked and watermark , as well as the corresponding variances . equals , where is a vector of length and , with . Note that is defined central element is present, which similarly to , but the central element hereafter. A similar notation is used for other is denoted as is given by quantities too.
The expression , where is the vecthe extorization operation, the Kronecker product, and pectation operator, contains terms of the order equal to or greater , than as well, but are not further analyzed here.
Finally,
and is given by
, where
is the identity matrix.
It is now easy to see which are the quantities that affect the means and variances of the detectors’ outputs and how they do it. These quantities are the noise variance, and those related to the and . Note that appears linear filter as, for example, in the numerator of the detectors’ variances. The noise results in higher variances of the normalized correlations’ outputs which, in turn, makes the watermark’s detection more difficult. The expressions for the special cases (i.e., no attack, additive white noise attack, linear filtering attack) can be derived by , and/or setting to one and (for omitting noise ) to zero. After the noise attack, for example, the correbecomes sponding expression for
A way of depicting the performance of a detector is to plot versus . Under our Gaussian model, the false alarm probability is given by
and . Thus, the proposed detector performs better compared to the conventional one. This is also verified by the experimental results presented in Section V. Based on the expressions that have been derived for the means and variances of the compared detectors’ outputs, proper thresholds can also be computed, adaptable to the attack conditions. IV. SUITABILITY OF THE PROPOSED DETECTOR As it has already been mentioned, due to the difficulty in finding satisfactory statistical models for real images in spatial domain [20], [21], the data are commonly assumed to be Gaussian distributed and correlation-based detectors are used. In other domains (FFT, DCT, wavelets), the image data can be more accurately described by some probability density function (pdf) and optimal detectors can be derived. We will try to verify the suitability of the proposed correlation-based detector for the problem at hand. Let us assume that images in spatial domain can be approximated by a generalized Gaussian distribution. The stationary generalized Gaussian model is adopted here, due to its wide use in image restoration and denoising [37], [38]. A zero-mean generalized Gaussian pdf is given by the expression (20) where
(18) and and the probability of detection is expressed in terms of
(21)
as (19)
The Gaussian and Laplacian distributions are special cases of this pdf, for and , respectively. Then, the optimum detector for the generalized Gaussian model [16] is given by
where
, is a threshold and , with and being the mean and variance of the detector’s output (under the hypothesis that the image is watermarked). Each point of the plot corresponds to a value for a given threshold . As increases, decreases (and vice-versa). This type of performance deand so does piction is known as the receiver operating characteristic (ROC) [32]. Hence, as shown in (19), the ROC of the watermark de. The larger tector depends exclusively on the value of , the larger the associated with a certain the value of and, as a consequence, the better the performance of the detector. We present ROC curves in Section V since they are very useful in assessing the overall detection behavior of watermarking methods [36]. These curves show error probabilities obtained via Monte Carlo simulations. Also note that the experimental curves match quite well with the theoretical formulas (18) and (19), which assume Gaussian distributions. This validates our assumption for Gaussian-distributed normalized correlation. If the condition in (17) holds, it can be shown that , where
(22) where is the image under test and is the estimation of the masked watermark. Here, the new spatial mask is used. and are the pdf’s parameters, which should be estimated from the image under test. This is a disadvantage of the above detector (22), since a parameter estimation stage has to be added before the detection stage. A moment matching method can be used for the estimation of these parameters [39]. Since the detector defined in (22) is parametric, its behavior can be studied for different distributions. If performs well for values of near to 2 (that correspond to a Gaussian pdf), this implies that a correlation-based detector is suitable. Thus, we conducted such experiments for values of between 0.1 and 2, with step 0.1. Moreover, we studied the effect of the proposed prewhitening on the detector defined in (22). The corresponding expression is
(23)
Fig. 9. SNR as a function of c after no attack for (a) Lenna and (b) Mandrill.
Fig. 10. SNR as a function of c after adaptive Wiener filtering plus noise (15 dB) attack for (a) Lenna and (b) Mandrill.
where is the prediction error of the received image , and is the filtered (with the prediction error filter) estimation of the masked watermark. The parameters and should now be estimated from the prediction error sequence (i.e., ), under test. In our experiments, the images Lenna and Mandrill were resized to dimensions 128 128 and 119 125, respectively, for reducing the computational time. The watermark embedding and detection processes have been conducted for 1000 wa. The termarks generated by 1000 different keys, for SNR has been calculated as defined in Section III-B. The embedding was such that the PSNR between the original and the watermarked image was equal to 40 dB. The case of no attack was first examined and the results are shown in Fig. 9. It can be . easily seen that the detector under test performs better for Moreover, the prewhitening process improves the performance of the detector, especially for the image of Lenna. Then, the attack case of our theoretical analysis was examined (i.e., the linear filtering plus noise attack). The images
were attacked with adaptive Wiener filtering (used in Checkmark for denoising) of size 5 5 and additive white Gaussian noise (15 dB). After the addition of noise, it is reasonable that the distribution of the examined image will be more Gaussian like. This is verified in Fig. 10, where we can see that the . We furthermore observe detector performs better for that prewhitening has a beneficial effect on the detector. The above experiments justify the selection of a correlationbased detector for the problem at hand, which is also a simpler detector that does not require any parameter estimation. Moreover, we conclude that the use of the proposed prewhitening is useful, even for a detector different from the correlator (since it enhances the detector’s output for almost every value of c). V. EXPERIMENTAL RESULTS Extensive experiments have been conducted in order to test the robustness of the proposed detection scheme to different attacks. Furthermore, the performance of the proposed detector combined with the new mask was tested. The images Lenna
Fig. 11. Experimental ROCs after adaptive Wiener filtering plus noise attack for (a) Lenna and (b) Mandrill.
Fig. 12. Experimental versus theoretical ROCs for Lenna and Mandrill, after adaptive Wiener plus noise attack.
and Mandrill have been resized to dimensions 128 128 and 119 125, respectively, for reducing the computational time. In all cases, ROC graphs were plotted. To generate these graphs, the same number of watermarked and nonwatermarked images were tested. The watermark embedding and detection processes have been applied for 100 000 keys taken randomly. The embedding was such that the PSNR between the cover and the watermarked image was equal to 40 dB. We studied the following detection cases. First, the normalized correlation is computed between the received image and the watermark itself . Then, the normalized correlation between the received image and the estimation of the masked watermark is computed for each of the three masks under comparison, that is, the NVF-based mask, the HVS-based mask, and the proposed one ( with , with , and with ). Finally, the proposed detection scheme is tested for the three masking cases ( with , with , and with ). Note that here we denote with for simplicity, and a similar notation is used for the estimated masks. For the above cases, we first tested the robustness against the linear filtering plus noise attack, which is the case of our the-
oretical analysis. The examined images were filtered with an adaptive Wiener filter of size 5 5, which is a noise-removal filter. Then, white Gaussian noise (15 dB) was added. The ROC curves for the two examined images, obtained via Monte Carlo simulations, are shown in Fig. 11. We can see that the proposed detector performs much better than the conventional one. Moreover, if it is combined with the new mask, it usually exhibits superior performance. This verifies the theoretical analysis and our claim that the use of the proposed mask further improves the proposed detector’s performance. Note also that the proposed mask improves substantially the conventional detector (without the prewhitening step) as well. Specifically for Lenna, the conventional detector combined with the proposed mask gives similar results with the proposed detector combined with the NVF-based mask. This is reasonable since the proposed mask enables the embedding of a very-high-strength watermark and, as a result, the embedding of a rather robust watermark. In Fig. 12, the experimental curves versus the theoretical curves are depicted. It is shown that they match quite well, thus validating our assumption that the normalized correlations’ outputs are Gaussian distributed. Additionally, in Tables III and IV, for Lenna and Mandrill, respectively, we see the means and stan-
TABLE III LENNA COMPETING DISTRIBUTIONS STATISTICS
TABLE IV MANDRILL COMPETING DISTRIBUTIONS STATISTICS
Fig. 13. Experimental ROCs after template removal attack (from Checkmark) for (a) Lenna and (b) Mandrill.
Fig. 14. Experimental ROCs after denoising and perceptual remodulation (DPR from Checkmark) for (a) Lenna and (b) Mandrill.
dard deviations’ values of the competing distribution. The absolute means are much less than 1 and differ between each other more than two orders of magnitude. Similar results are obtained for other attack cases as well. Subsequently, we examined the case of estimating the watermark and then removing it. The template removal attack from Checkmark was used, where the watermark is estimated by an adaptive Wiener filter. We used here a 5 5 filter. The results are shown in Fig. 13. Again, the proposed mask substan-
tially improves the performance of both detectors (with and without prewhitening), while the proposed detectors performs much better than the conventional one. One more attack from Checkmark was used for testing the compared watermarking techniques’ performance, the so-called denoising followed by perceptual remodulation (DPR) attack. The size of the denoising filter was 5 5, and the ROCs are shown in Fig. 14. We should note here that for Lenna, the proposed detector performs much better for the NVF-based mask
Fig. 15. Experimental ROCs after JPEG compression with quality factor 75 for (a) Lenna and (b) Mandrill.
Fig. 16. Experimental ROCs after JPEG compression with quality factor 30 for (a) Lenna and (b) Mandrill.
Fig. 17. SNR for different attacks for (a) Lenna and (b) Mandrill.
than the HVS-based mask. For Mandrill, the curves with the best performance correspond to the two compared detectors, using the mask. Finally, we examined the case of attacking an image with JPEG compression. This case is of particular importance, since images are usually stored and distributed in .jpg format. Compression can be approximated by a combination of filtering (that selects proper frequencies) and noise (quantization). Therefore, it was expected that the proposed detector would be robust to JPEG
compression. Indeed, this is verified in Figs. 15 and 16. In Fig. 15, the standard compression case is shown (the quality factor was equal to 75). It should be noted that for the proposed detector, and have similar performance for Lenna and a bit better than , while Mandrill’s performance is similar to all masks. In Fig. 16, a high compression case (the quality factor equals 30) was examined. For the image of Lenna, the best performance is achieved from the proposed mask, while for Mandrill, the proposed detector combined with performs better.
The results for all of the above attacks are also shown in Fig. 17. As already mentioned, the ROC curves depend exclusively on the value of SNR. Thus, in Fig. 17, the SNR is plotted for each detector, for all of the examined attacks’ cases. The new mask combined with the proposed detector performs well for other attacks too. Many other experiments, not shown here, have been conducted for a large set of images, and all verify the mask compared to the above results. The superiority of the other two is also verified.
The involved auto- and cross-correlations, which are ideally considered to be zero, are assumed here to have a magnitude upper bounded by a small positive scalar
Replacing
in inequality
, we obtain
(24) VI. CONCLUSION The contribution of this paper is twofold. First, a new spatial perceptual mask is proposed which matches very well with the properties of the HVS. It is based on the LS prediction error sequence of the cover image and substantially increases the watermark strength while, at the same time, the watermark visibility is decreased. Second, an improved blind detector based on proper prewhitening has been developed. Its improved performance has been justified theoretically for the case of linear filtering plus noise attack. The theoretical analysis is independent of the new mask and the derived expressions are valid for any spatial masking. This has been also verified from the simulations, where it is shown that the proposed detection is superior even . However, when is emfor a mask different from the ployed, the proposed detector’s performance usually improves even further. APPENDIX A PROOF OF (17)
Using the triangle inequality, (24) can be written as
(25)
with
being a lower bound for . If (25) is true, (24) is also true. Then,
(25) can be written as
(26)
and it remains to be found under which constraints (26) is true. and a To this end, we will find an upper bound for . lower bound for : Lower Bound for
The aim is to find under which conditions inequality is true. At first, the quantities involved in this inequality is used here to denote sample averare defined. Note that ages and should not be confused with the usual expectation operator
With “~” we denote the vectors that do not contain the central element of the corresponding vectors without “~.” Note that
So where
(27)
Upper Bound for
: (28)
To end up with interpretable formulas, we replace the denominator by a constant related to the mean powers of the image, the watermark, and their prediction errors
The upper bound for norm can be found by the following manipulations similar to those used for the compuand is equal to tation of , where
(32) Thus
(29) To conclude, the inequality
is true if
(30) is true. the For final condition that must be satisfied in order to have is
(31)
Although the denominator is, in fact, a random variable, its replacement by a constant can be justified as follows. In case of , it turns out that the denominator has a mean value of (for an image with pixels) and variance , order whereas the mean value and variance of the numerator are both . Assuming , we may conclude that the mean will remain practically unaffected if value and variance of , we replace the denominator by its mean value. In case of (depending the mean value of the denominator is less than on the predictability properties of the image) but the proposed approximation is still valid. In order to validate our claims, we calculated the actual correlation measures and their approximations based on (32). Their means and variances are then shown in Tables V and VI for Lenna and Mandrill, respectively. It is obvious that the formulas in (32) provide very good approximations. Subsequently, the means and variances under each hypothesis are computed
where
(33) where is of order since , , and quantities
The above inequality (31) is true for filters with dominant central parts.
APPENDIX B DERIVATION OF THE CORRELATIONS’ MEANS AND VARIANCES As also mentioned in Section III-B, the means and variances of the normalized correlation outputs cannot be expressed by easy-to-interpret formulas. Even if the numerator can be adequately approximated by a Gaussian distribution, the case of the denominator is much more complicated, leading to long and impractical, for our purposes, formulas. Our aim here is to derive approximate expressions for the computation of the desired means and variances so as to gain more insight concerning the attacks’ effect on the detection.
are ideally uncorrelated
TABLE V LENNA—ACTUAL VERSUS APPROXIMATE STATISTICS
TABLE VI MANDRILL—ACTUAL VERSUS APPROXIMATE STATISTICS
(37)
(34) Note that in (34) contains terms of order due to uncorrelated (ideal) quantities. We do not further analyze and similar quantities here since we should provide large expressions that have very small values actually. For the rest means and variances, we provide the initial terms needed for their computation and the final result. The terms of order are not shown here for simplicity, but a term is added in each expression in order to keep in mind that such terms exist
(38)
(35)
(39)
(36)
(40)
REFERENCES [1] I. J. Cox and M. L. Miller, “A review of watermarking and the importance of perceptual modeling,” in Proc. SPIE Electronic Imaging, Storage Retrieval for Image Video Databases V, San Jose, CA, Feb. 1997. [2] I. J. Cox, J. Killian, F. T. Leighton, and T. Shamoon, “Secure spread spectrum watermarking for multimedia,” IEEE Trans. Image Process., vol. 6, no. 12, pp. 1673–1687, Dec. 1997. [3] S. Voloshynovskiy, A. Herrigel, N. Baumgaertner, and T. Pun, “A stochastic approach to content adaptive digital image watermarking,” in Proc. 3rd Int. Workshop Information Hiding, Dresden, Germany, Sep. 1999, pp. 211–236. [4] M. Kutter, F. Jordan, and F. Bossen, “Digital signature of color images using amplitude modulation,” in Proc. SPIE Electronic Imaging, Storage Retrieval for Image Video Databases V, San Jose, CA, Feb. 1997, pp. 518–526. [5] C. I. Podilchuk and W. Zeng, “Image-adaptive watermarking using visual models,” IEEE J. Selected Areas Commun., vol. 16, no. 4, pp. 525–539, May 1998. [6] A. B. Watson, “DCT quantization matrices visually optimized for individual images,” in Proc. SPIE Conf. Human Vision, Visual Processing Digital Display VI, San Jose, CA, Feb. 1993, pp. 202–216. [7] S. Pereira, S. Voloshynovskiy, and T. Pun, “Optimal transform domain watermark embedding via linear programming,” Elsevier Signal Process., vol. 81, pp. 1251–1260, Jun. 2001. [8] J. F. Delaigle, C. D. Vleeschouwer, and B. Macq, “Watermarking algorithm based on a human visual model,” Signal Process., vol. 66, no. 3, pp. 319–335, May 1998.
[9] M. Kutter and S. Winkler, “A vision based masking model for spreadspectrum image watermarking,” IEEE Trans. Image Process., vol. 11, no. 1, pp. 16–25, Jan. 2002. [10] G. C. Langelaar, I. Setyawan, and R. L. Lagendijk, “Watermarking digital image and video data, a state-of-the-art overview,” IEEE Signal Process. Mag., vol. 17, no. 6, pp. 20–46, Sep. 2000. [11] R. B. Wolfgang, C. I. Podilchuk, and E. J. Delp, “Perceptual watermarks for digital images and video,” Proc. IEEE, vol. 87, no. 7, pp. 1108–1126, Jul. 1999. [12] S. L. Marple, Jr., Digital Spectral Analysis. Upper Saddle River, NJ: Prentice-Hall, 1987. [13] S. Haykin, Adaptive Filter Theory, 4th ed. Upper Saddle River, NJ: Prentice-Hall, 2002. [14] R. J. Clarke, Tranform Coding of Images. New York: Academic, 1985. [15] K. A. Birney and T. R. Fischer, “On the modeling of the DCT and subband image data for compression,” IEEE Trans. Image Process., vol. 4, no. 2, pp. 186–193, Feb. 1995. [16] J. R. Hernández, M. Amado, and F. Pérez-González, “DCT-domain watermarking techniques for still images: detector performance analysis and a new stusture,” IEEE Trans. Image Process., vol. 9, no. 1, pp. 55–68, Jan. 2000. [17] Q. Cheng and T. S. Huang, “An additive approach to transform-domain information hiding and optimum detection structure,” IEEE Trans. Multimedia, vol. 3, no. 3, pp. 273–284, Sep. 2001. [18] ——, “Robust optimum detection of transform domain multiplicative watermarks,” IEEE Trans. Signal Process., vol. 51, no. 4, pp. 906–924, Apr. 2003. [19] M. Barni, F. Bartolini, A. De Rosa, and A. Piva, “A new decoder for the optimum recovery of nonadditive watermarks,” IEEE Trans. Image Process., vol. 10, no. 5, pp. 755–766, May 2001. [20] J. R. Hernández and F. Pérez-González, “Statistical analysis of watermarking schemes for copyright protection of images,” Proc. IEEE, vol. 87, no. 7, pp. 1142–1166, Jul. 1999. [21] A. N. Netravali and B. G. Haskell, Digital Pictures. Representation, Compression and Standards. New York: Plenum, 1995. [22] J. S. Lim, Two-Dimensional Signal and Image Processing. Upper Saddle River, NJ: Prentice-Hall, 1990. [23] A. M. Sequeira and C. W. Terrien, “A new 2-D fast RLS algorithm,” in Proc. IEEE ICASSP, Apr. 3–6, 1990, vol. 3, pp. 1401–1404, . [24] M. Ohki and S. Hashiguchi, “Two-dimensional LMS adaptive filters,” IEEE Trans. Consum. Electron., vol. 37, no. 1, pp. 66–73, Feb. 1991. [25] P. Vandergheynst and J. F. Gobbers, “Directional dyadic wavelet transforms: design and algorithms,” IEEE Trans. Image Process., vol. 11, no. 4, pp. 363–372, Apr. 2002. [26] S. Winkler, “Vision models and quality metrics for image processing applications,” Ph.D. dissertation, Electron. Eng. Dept., Ecole Polytechnique Federale de Lausanne (EPFL), Lausanne, Switzerland, 2000. [27] B. Macq, J. Dittmann, and E. J. Delp, “Benchmarking of image watermarking algorithms for digital rights management,” Proc. IEEE, vol. 92, no. 6, pp. 971–984, Jun. 2004. [28] I. J. Cox, M. L. Miller, and J. A. Bloom, Digital Watermarking. San Mateo, CA: Morgan Kaufman, 2002. [29] S. Pereira, S. Voloshynovskiy, M. Madueno, S. Marchand-Maillet, and T. Pun, “Second generation benchmarking and application oriented evaluation,” in Proc. Information Hiding Workshop, Pittsburgh, PA, Apr. 2001. [30] S. Voloshynovskiy, S. Pereira, V. Iquise, and T. Pun, “Attack modeling: toward a second generation benchmark,” Signal Process., vol. 81, pp. 1177–1214, Jun. 2001. [31] [Online]. Available: http://watermarking.unige.ch/Checkmark/index. html [32] S. M. Kay, Fundamentals of Statistical Signal Processing, Volume II, Detection Theory. Upper Saddle River, NJ: Prentice-Hall, 1998. [33] I. Karybali and K. Berberidis, “Blind image-adaptive watermarking,” in Proc. 10th IEEE Int. Conf. Electronics Circuits Systems, Sharjah, United Arab Emirates, Dec. 2003, pp. 894–897. [34] ——, “A new blind image-adaptive watermarking scheme: theoretical and experimental results,” in Proc. XII European Signal Processing Conf., Vienna, Austria, Sep. 2004, pp. 1489–1492. [35] G. Depovere, T. Kalker, and J. P. Linnartz, “Improved watermark detection using filtering before correlation,” in Proc. IEEE Int. Conf. Image Process., Chicago, IL, Oct. 1998, pp. 430–434. [36] M. Kutter and F. Petitcolas, “A fair benchmark for image watermarking systems,” in Proc. SPIE, San Jose, CA, Jan. 1999, vol. 3657, pp. 219–239. [37] C. Bouman and K. Sauer, “A generalized Gaussian image model for edge-preserving map estimation,” IEEE Trans. Image Process., vol. 2, no. 3, pp. 296–310, Jul. 1993.
[38] P. Moulin and J. Liu, “Analysis of multiresolution image denoising schemes using generalized Gaussian and complexity priors,” IEEE Trans. Inform. Theory, vol. 45, no. 3, pp. 909–919, Apr. 1999. [39] S. G. Mallat, “A theory for multiresolution signal decomposition: the wavelet representation,” IEEE Trans. Pattern Anal. Mach. Intell., vol. 11, no. 7, pp. 674–693, Jul. 1989.
Irene G. Karybali (M’06) received the Diploma degree in computer engineering and informatics in 1999, the M.Sc. degree in signal and image processing in 2001, and the Ph.D. degree in image registration and image watermarking in 2005 from the University of Patras, Patras, Greece. From 2002 to 2003, she was a Researcher in the R&D department of the Research Adademic Computer Technology Institute (RACTI), Patras. She is currently teaching Computer Graphics in the postgraduate program on Computer Science of the Technological Educational Institute of Larissa, Larissa, Greece. Her research interests include image watermarking and image registration. Dr. Karybali is a member of the Technical Chamber of Greece.
Kostas Berberidis (S’87–M’90) received the Diploma degree in electrical engineering from the Democritus University of Thrace, Thrace, Greece, in 1985 and the Ph.D. degree in signal processing and communications from the University of Patras, Patras, Greece, in 1990. From 1986 to 1990, he was a Research Assistant with the Research Adademic Computer Technology Institute (RACTI), Patras, and a Teaching Assistant in the Computer Engineering and Informatics Department (CEID), University of Patras. In 1991, he served in the Greek Army, working at the Speech Processing Laboratory of the National Defense Research Center. From 1992 to 1994 and from 1996 to 1997, he was a Researcher at the R&D department of RACTI. During academic year 1994-1995 he was a Postdoctoral Fellow with Centre Commun d’Etudes de Telediffusion et Telecommunications (CCETT), Rennes, France. Since 1997, he has been with CEID, School of Engineering, University of Patras, where he is an Associate Professor and Head of the Signal Processing and Communications Laboratory. His research interests include fast algorithms for adaptive filtering and signal processing for communications. Dr. Berberidis has served as a member of the scientific and organizing committees of several international conferences and is currently serving as Associate Editor of the IEEE TRANSACTIONS ON SIGNAL PROCESSING and the EURASIP Journal on Applied Signal Processing. He is a member of the Technical Chamber of Greece.