Efficient Techniques for Network Attack Identification Sanjeeb Nanda and Narsingh Deo School of Computer Science University of Central Florida Orlando, Florida 32816-2362
[email protected],
[email protected]
Abstract The ubiquity of the Internet has set off an explosion in the number of networked applications developed for the consumption of users. Unfortunately, many are maliciously designed to harm network infrastructure and systems. Considerable effort has been focused on detecting attacks by such applications that are known as malware, and predicting the breaches in security rendered by them. However, large networks pose a formidable challenge to representing and analyzing such attacks using scalable models. Furthermore, the availability of only partial information on the vulnerabilities admitted by a large fraction of the networked systems makes forecasting the future targets of such applications equally hard. In this paper, we present innovative methods to identify and characterize network attacks, and to forecast their propagation over time.
1.
Introduction
Directed graphs serve as an intuitive way to represent network attacks. Existing formulations [10], [11], [13] use vertices to represent a tuple of attributes comprised of a source system, a target system, a vulnerability that exists on the target as a precondition, and the postcondition of an atomic attack from the source to the target using that vulnerability. Then, an arc exists from one exploit to another if only if the corresponding systems are connected, and an atomic attack can leverage the postcondition in the former to utilize the precondition in the latter. To produce such attack graphs, the set of vulnerabilities at each system in the network is first obtained using scanners such as Nessus, Saint, ISS’ Internet Scanner and the CISCO Security Scanner. Then, a model checker such as NuSMV or Spin is applied to a graph on all possible exploits to generate every path that breaches an explicitly stated security condition that is stated as the goal. Finally, the result produced by the model checker is rendered using a visualization application such as GraphViz. However, a drawback of the aforementioned approach is that a scanner is required to determine all the vulnerabilities admitted by each system. This is due to the fact that, a scanner’s comprehensiveness in identifying vulnerabilities is limited to the breadth and sophistication of the rules defined by human programmers for that purpose. Since vulnerabilities are typically exposed to public forums long after they have been discovered and exploited by hackers, it is reasonable to assume that publicly available vulnerability scanners are insufficient for detecting all vulnerabilities. Hence, the attack graphs they yield are potentially incomplete. In this paper, we describe the topology of a network containing honeypots that can be used to determine attack paths without requiring knowledge of vulnerabilities. First, we state the following definitions. Definition 1 A network is a pair G = (V, E), where V = {v1, v2, …, vn} is a set of systems and E is a set of 2-tuples, where (vi, vj) is in E if and only if vi and vj can communicate with each other. We assume that a system vi can communicate with a system vj if physical cabling can be traced from vi to vj, and the routers that controls the flow of data on the cabling between those systems, permits data from vi to reach vj. Definition 2 A network service is an application on a system that has the ability to transmit and receive data to and from network services on other systems. Each service utilizes a well-known port number for the transmission and reception of data from its peers. Definition 3 A network service on a system v is said to be targeted by an exploit e if e attempts to utilize it to enhance its privileges on v.
Since we want to determine how applications with vulnerabilities are exploited by their peers in a network, we restrict our discussion to network services only. Hence, for brevity, we shall hereafter refer to each simply as a service. Definition 4 A service s on a system v is said to be compromised if an exploit that targets s succeeds in gaining privileges on v. We refer to v as the host of s. Definition 5 A service s is ranked using the set of permissions on a system hosting s that can be usurped by an attacker by compromising s. Thus, given services s1 and s2, the rank of s1 is greater than that of s2, if the set of permissions yielded by compromising s2 is a subset of the set of permissions yielded by compromising s1. We denote the rank of a service s as rank(s). An example of rank is illustrated using the services winlogon.exe, lsass.exe and alg.exe on the Windows operating system. The first two govern user login and security policies respectively while the last one serves as the application layer gateway. Compromising the last one yields unauthorized access to its host’s network interface, while compromising the first two yields unauthorized access to all resources on their host including their network interfaces. Hence, winlogon.exe and lsass.exe can be assigned a higher rank than alg.exe. Definition 6 A honeypot is a system in a network that admits exploits that target it and enables security experts to analyze the characteristics of such exploits to determine the behavior of the attackers that perpetrate them. In the following section we shall construct the network required to derive attack graphs from observed exploits, and explain the motivation for each significant aspect of its architecture. 2.
Construction of the Network to Derive Attack Graphs
Suppose that U = {u1, u2, …, un} and V = {v1, v2, …, vn} are two sets of honeypots where each vi in V rejects any transmissions to it other than those from ui in U, for 1 ≤ i ≤ n. This can be easily achieved, for instance, by confining each pair of systems {ui, vi} to a unique domain, and rejecting all transmissions to vi originating from outside its own subnetwork. However, systems outside the subnetwork of vi may attempt to counter this by impersonating ui. They can achieve this by overwriting the valid 2-tuple comprised of the IP and media access control (MAC) addresses of ui in the ARP cache of vi with the spurious 2tuple comprised of the IP address of ui and the MAC address of the impersonator. To prevent this from occurring, the initially valid 2-tuple that associates the IP and MAC addresses of ui, is never allowed to be replaced.
Each system in U and V is actually a virtual machine that is simulated within a physical server using tools such as VMware WorkStation. This enables a physical server to simulate multiple systems in a network, and thereby provides a practical means for realizing the large number of systems needed to implement our proposed solution. For the sake of brevity, we shall henceforth refer to each virtual machine simply as a system.
U S – {s1}
S – {s2}
S – {sn}
u1
u2
un
V S
S
S
v1
v2
vn
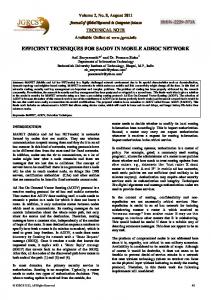
Figure 1. Network with 2n honeypots. Initially, the honeypots are initialized such that, no service on any system in U transmits data to any service on any system in V. Any transmission that is observed thereafter is scanned to determine if it is harmless. For example, a SYN packet that is typically used to initiate a TCP connection or to conduct a port scan may be judged harmless. On the other hand, an unfamiliar transmission is considered to be an exploit. In the latter case, the system in U from which the transmission originated is deemed to have been compromised. Suppose that S = {s1, s2, …, sn} is the set of services on which attack paths are to be determined. Then, we initialize each system ui in U to contain each service in S – {si}, for 1 ≤ i ≤ n. Figure 1 illustrates the aforementioned network. The rectangle with rounded corners shown within each system specifies the services on that system, and arc (ui, vi) indicates the exploits that are permitted to originate from ui to target vi, but not vice versa. Legal liabilities inhibit honeypots from permitting attacks that are known to it to be propagated by it [14]. As a result, an attacker can identify a system v that has been already compromised as being a honeypot, if exploits designed by the
attacker to originate from v do not occur. To ensure that attackers continue to launch exploits targeting systems in V from system in U, it is essential that they are not alerted to the fact that systems in V are honeypots. Hence, we must permit attacks from systems in V to be propagated out. To this end, we allow systems in V to transmit only to another set of systems W say, where each system in W is protected with up-to-date internet security software. 3.
Deriving the Attack Graphs
We define an attack graph as a pair H = (S, A), where S = {s1, s2, …, sn} is a set of services and A is a set of arcs, with (si, sj) in A if and only if si can be compromised to yield the postcondition necessary to exploit sj. Then, si is called the predecessor of sj. We now show how to derive such attack graphs. Suppose that k systems in V are each targeted on port p by an instance of exploit e. Since, each service utilizes unique port numbers we can assume that the same service s has been targeted by e on each of the k systems. Now, an instance of e targeting a given system in V must originate from a unique system in U, since ui in U is permitted to transmit to vi in V only, for 1 ≤ i ≤ n. Let p be the probability that a service on a system v has been compromised given that v is the source of an exploit e. Assuming that the probability of an internal attack on v, such as one perpetrated by a disgruntled employee with administrative privileges on v, is relatively low, we have p ≈ 1. However, it is possible that a service has been compromised in v even when no exploit is observed to originate from it. For instance, an attacker may have compromised a service on v but not yet leveraged it to launch an exploit. So, let q be the probability that a service in v has been compromised given that v is not a source of e. Now, in our proposed network each system in V can be targeted by an exploit launched from a unique system in U only. Hence, an attack that is keen to propagate itself to all systems in V is very likely to eventually use a compromised service s in each system in U to launch the corresponding exploit that required the attacker to compromise s in the first place. In other words, when v is not a source of e, it is very likely that no service has been compromised on v to launch e. Thus, we have (1 – q) ≈ 1, and therefore, 0 ≈ q < p ≈ 1. Let C(n, k) denote the number of k-combinations of an n-set. Now, suppose that e originates from k given systems in U. Since, there are C(n – k, r – k) r-sets of systems, with every system in each of those r-sets containing each service common to those k systems, the probability pk that a service common to k such systems has been compromised equals C(n – k, r – k)pkqr – k. Then,
pk p ( r − k + 1) p ( n − k ) , since r = n – 1 in our network. = = p k −1 q ( n − k + 1) q ( n − k + 1)
Since 0 ≈ q < p ≈ 1, it is easy to see that p k > 1 , for 1 ≤ k < n. p k −1 Thus, the probability that a service has been compromised is greater when the number of systems k in which it exists and which are the origins of a common exploit is greater. Now consider the following cases. Case 1 k = (n – 1) The intersection of the sets of services contained in the (n – 1) systems in U from which instances of e exploit the (n – 1) systems in V, must contain exactly one service, r say. Based on our preceding discussion, we therefore conclude that the likelihood of an attack having compromised r to yield the postcondition to exploit s must be high. Hence, we designate r as the predecessor of s. Case 2 k < (n – 1) The intersection of the sets of services that are the origins of e has (n – k) services, s1, s2, …, sn – k say, where (n – k) > 1. Let R = {s1, s2, …, sn – k}. In that case, each service in R may be a predecessor of v in the derived attack graph. However, if k is relatively small, and the actual number of services in S that admit the precondition necessary for the occurrence of e is small, then the use of this attack graph yields larger numbers of false positives. To avoid this, we may wait further till the value of k is observed to be larger. In the meantime we may apply the following criteria to prune the number of services amongst R that are predecessors of s. (a) Suppose that exactly (n – 1) systems in U containing the service r have been observed to target the service s as well as the service si on systems in V, where i ∈ {1, 2, …, k}. By our argument in Case 1, r must be therefore a predecessor of both si and s. Then, we cannot have si as a predecessor of s for the following reason. If an attacker has already found a service r to compromise in order to exploit s, then there is no benefit in compromising si as an intermediate step after compromising r in order to exploit s. Hence we can eliminate si from the set of likely predecessors of s. (b) Suppose that exactly (n – 1) systems in U containing the service si are observed to be targeting the service t on systems in V, where i ∈ {1, 2, …, k}, and rank(t) < rank(s). Then, by our argument in Case 1, si is a predecessor of service t. Now an attacker that has compromised service si earlier to exploit t cannot be exploiting s later if rank(t) < rank(s). This is because exploits are designed by an attacker to usurp privileges with reasonable confidence of success. Hence, an attacker that intends to exploit a higher ranked service s will do so without exploiting a lower ranked service t first. Therefore, we can eliminate si from the set of likely predecessors of s.
Case 3 k = n Unfortunately, this implies that two or more services have been compromised to enable exploit e to be launched from each system in U. However, this is rare because of the following reason. In order to obtain the desired privileges on a system u that enables the launch of e from u, an attacker has to first find a vulnerability admitted by a service on u that can be compromised to yield those privileges, and then develop a program to achieve that. Neither task is trivial. Hence, upon finding a vulnerability in a service s and the exploit necessary to compromise it, there is little reason for the attacker to find an alternative service that can be compromised to enable the launch of e, unless the existing mechanism to compromise s is no longer effective. Hence, the occurrence of this case should be limited. 4.
Conclusion
The technique we have described earlier allows attack graphs to be constructed gradually over time. However, there is no conclusive way to determine the point in time when the construction process can be deemed complete. This is an area of future research. 5.
References
[1]
P. Ammann, D. Wijesekera and S. Kaushik, “Scalable graph-based network vulnerability analysis,” Proceedings of the 9th ACM Conference on Computer and Communications Security, pp. 217 – 224, 2002.
[2]
J. Dawkins and J. Hale, “A systematic approach to multi-stage network attack analysis,” Proceedings of the Second IEEE International Information Assurance Workshop, pp. 48 – 56, 2004.
[3]
S. Mylavarapu, J. Zachary, D. Ettlich, J. McEachen and D. Ford, “A model of conversation exchange dynamics for detection,” The 47th Midwest Symposium on Circuits and Systems, vol. 3, pp. 231 – 234, 2004.
[4]
S. Nanda and N. Deo, “A highly scalable model for network attack identification and path prediction,” Proceedings of the IEEE SoutheastCon 2007, pp. 663 – 668, 2007.
[5]
S. Noel, M. Jacobs, P. Kalapa and S. Jajodia, “Multiple coordinated views for network attack graphs,” Proceedings of the IEEE Workshop on Visualization for Computer Security, pp. 99 – 106, 2005.
[6]
S. Noel and S. Jajodia, “Understanding complex network attack graphs through clustered adjacency matrices,” Proceedings of the 21st Annual Computer Security Applications Conference, pp. 160 – 169, 2005.
[7]
S. Noel and S. Jajodia, “Managing attack graph complexity through visual hierarchical aggregation,” Proceedings of the 2004 ACM workshop on Visualization and data mining for computer security, pp. 109 – 118, 2004.
[8]
S. Noel, E. Robertson and S. Jojodia, “Correlating intrusion events and building attack scenarios through attack graph distances,” Computer Security Applications Conference, pp. 350 – 359, 2004.
[9]
S. Patton, W. Yurcik and D. Doss, “An Achilles’ heel in signature based IDS: squealing false positives in Snort,” Fourth International Symposium on Recent Advances in Intrusion Detection, 2001.
[10] C. Phillips and L. Swiler, “A graph-based system for network-vulnerability analysis,” Proceedings of the 1998 Workshop on New Security Paradigms, pp. 71 – 79, 1998. [11] R. Ritchey and P. Ammann, “Using model checking to analyze network vulnerabilities,” Proceedings of the 2000 IEEE Symposium on Security and Privacy, pp. 156 – 165, 2000. [12] K. Shah, S. Bohacek and A. Broido, “Feasibility of detecting TCP-SYN scanning at a backbone router,” Proceedings of the 2004 American Control Conference, vol. 2, pp. 988 – 995, 2004. [13] O. Sheyner, J. Haines, S. Jha, R. Lippmann and J. Wing, “Automated generation and analysis of attack graphs,” Proceedings of the 2002 IEEE Symposium in Security and Privacy, pp. 272 – 284, 2002. [14] L. Spitzner, “Honeypots: Are they illegal?,” http://www.securityfocus.com/infocus/1703, 2003. [15] F. Valeur, G. Vigna, C. Kruegel and R. Kemmerer, “A comprehensive approach to intrusion detection alert correlation,” IEEE Transactions on Dependable and Secure Computing, vol. 1, no. 3, pp. 146 – 169, 2004. [16] Y-M. Wang, Z-L. Liu, X-Y. Cheng and K-J. Zhang , “An analysis approach for multi-stage network attacks,” Proceedings of 2005 International Conference on Machine Learning and Cybernetics, vol. 7, pp. 3949 – 3954, 2005.