also present a tool, called DUA-FORENSICS, that we implemented ... republish, to post on servers or to redistribute to lists, requires prior specific permission ...
Efficiently Monitoring Data-Flow Test Coverage Raul Santelices and Mary Jean Harrold Georgia Institute of Technology College of Computing Atlanta, Georgia, USA 30332 {raul|harrold}@cc.gatech.edu ABSTRACT Structural testing of software requires monitoring the software’s execution to determine which program entities are executed by a test suite. Such monitoring can add considerable overhead to the execution of the program, adversely affecting the cost of running a test suite. Thus, minimizing the necessary monitoring activity lets testers reduce testing time or execute more test cases. A basic testing strategy is to cover all statements or branches but a more effective strategy is to cover all definition-use associations (DUAs). In this paper, we present a novel technique to efficiently monitor DUAs, based on branch monitoring. We show how to infer from branch coverage the coverage of many DUAs, while remaining DUAs are predicted with high accuracy by the same information. Based on this analysis, testers can choose branch monitoring to approximate DUA coverage or instrument directly for DUA monitoring, which is precise but more expensive. In this paper, we also present a tool, called DUA-F ORENSICS, that we implemented for this technique along with a set of empirical studies that we performed using the tool. Categories & Subject Descriptors: D.2.5 [Software Engineering]: Testing and Debugging—Testing tools, Monitors General Terms: Algorithms, Experimentation, Measurement, Performance
1.
INTRODUCTION
Software testing is an expensive component of the software development and maintenance process. One type of testing, white box (or structural) testing, is based on covering program entities, such as statements, branches, and data-flow relationships. The testing determines the coverage of these entities by monitoring the execution of the program with test cases. Such monitoring can add considerable overhead to the execution of the program, which can adversely affect the cost of running a test suite. Thus, minimizing the necessary monitoring activity could reduce the cost of running test cases, letting testers save time or execute more test cases, or facilitating monitoring of the software after it is deployed.
Permission to make digital or hard copies of all or part of this work for personal or classroom use is granted without fee provided that copies are not made or distributed for profit or commercial advantage and that copies bear this notice and the full citation on the first page. To copy otherwise, to republish, to post on servers or to redistribute to lists, requires prior specific permission and/or a fee. ASE’07, November 4–9, 2007, Atlanta, Georgia, USA. Copyright 2007 ACM 978-1-59593-882-4/07/0011 ...$5.00.
A basic structural testing strategy is to cover all statements or branches. A more effective strategy is to cover data-flow relationships, such as all definition-use associations (DUAs) [8, 11]. Researchers have developed efficient monitoring techniques for statements and branches (e.g., [4]). However, monitoring DUAs is remarkably more expensive [17], and there is little previous work on reducing its cost. Moreover, efficiently monitoring DUAs that span multiple procedures (i.e., interprocedural DUAs) or whose variables are aliased are challenges not addressed to date. The most common approach to monitoring for data-flow testing is a technique known as last definitions. Under this approach, each definition d of a variable v that is executed is recorded. Then, when a use u of that variable is executed, the last d recorded is the definition that reaches u, and the DUA (d,u,v) is marked as being satisfied. Misurda et al. [17] reported the timings of the performance of this last-definition approach. They reported the overhead of their demand-driven approach, which dynamically inserts and removes the probes required for the monitoring, but did not report the overhead of the non-demand-driven, static version of their last-definition approach. However, we can infer from their timing reports on the SPECjvm98 benchmarks1 that the overhead can be considerable, even for the demand-driven approach: for the programs, the overhead of the demand-driven last-definition approach ranged from 4% to 279% with the average being 127%. Clearly, this overhead is unacceptable for most programs. Because of the overhead imposed by instrumentation for monitoring various entities, previous work has produced methods to identify a minimal subset of entities of the same type that need to be instrumented [1, 2, 4, 5, 14, 15], so that the coverage of any entity outside the subset can be inferred by the coverage of some entity in the minimal subset. However, to date, limited work has been done to identify inference among entities of different types. In previous work [20], we presented a subsumption algorithm for entities of any type, based on commonly required branches. Another method infers DUAs from nodes [16], but this method is incomplete and is only intraprocedural (i.e., within procedures). To address the expense of monitoring for intraprocedural and interprocedural DUAs, we present in this paper a novel technique that we developed to enable monitoring of DUAs based on branch monitoring. Our technique has three phases: static analysis, which is performed before execution of the program; dynamic analysis, which is performed during execution of the program with a test suite; and reporting, which uses the results of the static and dynamic analyses to determine which DUAs were executed by the test suite. In the static phase, the technique analyzes the program to find the DUAs and properties of those DUAs, and instruments 1
http://www.spec.org/jvm98.
the program for monitoring based on input from the tester. In the dynamic phase, the instrumented program is executed, and coverage data from that execution is recorded. Finally, in the reporting phase, the technique uses the results of the static and dynamic analyses to produce a DUA-coverage report. Depending in part on the type of instrumentation chosen, the technique reports each DUA as definitely covered, possibly covered, or not covered. These two approaches have tradeoffs in terms of monitoring overhead and precision. The branch-monitoring approach results in little monitoring overhead because only branches are monitored during execution, but it may not be able to determine definite coverage of some DUAs. The DUA-monitoring approach results in additional overhead because the DUAs are directly monitored but it is able to determine definite coverage of all DUAs in the program. In this paper, we also present a tool, called DUA-F ORENSICS, in which we implement all aspects of our technique. We also report on a set of empirical studies that we performed using the tool. The main contributions of the paper are: • The presentation of a technique that provides efficient monitoring of intraprocedural and interprocedural DUAs based on branch monitoring. • A description of a tool that performs the required static analysis, lets the user decide whether to perform branch or DUA monitoring, instruments the program accordingly, monitors it during runtime, and produces a DUA-coverage report. The implementation of direct DUA monitoring, in particular, is very efficient and permits a fair comparison. • A set of studies that show for the subject programs: – The static analysis can identify a considerable number of DUAs as inferable from branches (up to 50%). – The static analysis identifies the remaining DUAs as conditionally- or non-inferable from branches. The percentage of these DUAs, marked as possibly covered during runtime, that are actually covered ranges from 76% to 100%. – The overhead of the branch monitoring is usually less than 10%, considerably lower than direct DUA instrumentation.
2.
BACKGROUND
This section briefly describes the required analyses and data-flow coverage criteria on which our technique is based. Our analyses use the control-flow graph of the program. A controlflow graph (CFG) for a procedure P is a directed graph in which each node represents a block of code and each edge, possibly labeled, represents the flow of control between blocks. A CFG has two distinguished nodes representing entry to and exit from P ; the entry node has no predecessors, and the exit node has no successors. To illustrate, consider graph G in Figure 1, which represents a procedure with six blocks of code. Node 1, for example, ends in a conditional statement with two outgoing edges: the true branch (1,2) labeled “T”, and the false branch (1,3) labeled “F”. Node “En” represents the entry to the procedure and node “Ex” represents the exit from the procedure. A CFG represents a single procedure and can be used for intraprocedural (within the procedure) analyses. However, by connecting CFGs for procedures, we get an interprocedural controlflow graph (ICFG) that can be used to perform interprocedural (across procedures) analyses. We use a common ICFG, similar to those previously presented (e.g., [9, 19]).
Figure 1: A complete control-flow graph (CFG) G with definitions, uses and kills for some nodes, and a partial CFG G � .
Our technique requires reachability analysis on the CFG (and ICFG). A node a is reachable from a node b if there exists a valid path in the CFG (resp. ICFG) from b to a. Finding such a valid path in a CFG is straightforward and requires simply traversing the CFG. Finding a valid path for an ICFG is more complex and requires identifying only realizable paths, which consider the calling context during the traversal. In particular, a path in an ICFG is realizable if, whenever control leaves a procedure through a normal procedure exit, such as the end of the procedure or a return statement, it returns to the procedure that invoked it. Our technique uses dominance and postdominance. Given a CFG (or ICFG) G, a node u in G dominates a node v in G if every valid path from the entry of G to v contains u. Analogously, a node u in G postdominates a node v in G if every valid path from v to the exit of G contains u. A node dominates itself but does not postdominate itself [7]. A node n properly dominates all nodes dominated by n, except n itself. To illustrate, consider again Figure 1. Node En dominates all nodes, node 1 dominates all nodes except En, node 4 dominates itself and nodes 5, 6, and Ex, nodes 2, 3, and 5 dominate only themselves, and node 6 dominates itself and node Ex. Node Ex postdominates all nodes except Ex, node 6 postdominates all nodes except itself and Ex, node 4 postdominates nodes En, 1, 2, and 3, and node 1 postdominates En. Another analysis required by our technique is control-dependence. For a CFG G and nodes u and v in G, node u is control dependent on node v if and only if v has successors v� and v�� such that u postdominates v� but u does not postdominate v�� [7]. Control dependence analysis adds to G a special Start node, a “T” branch from Start to the entry node, and a “F” branch from Start to the exit node. The “T” branch at the Start node represents the event of program control entering G. For example, consider Figure 1. Nodes En, 1, and 6 are control dependent on Start taking the “T” branch, node 2 (resp. node 3) is control dependent on node 1 taking the “T” (resp. “F”) branch, node 5 is control dependent on node 4 taking the “T” branch, and node 4 is control dependent on on Start taking the “T” branch and node 6 taking the “T” branch. Another required analysis is data-dependence analysis. A definition of a variable v is a point where v is assigned a value and a use of v is a point where v is accessed but not changed. A kill of
Figure 2: Processing phases of our DUA-monitoring technique. v is a redefinition of the variable that occurs on a subpath from a definition to a use. A definition-use association (DUA) is a triple (d,u,v), where d is a CFG node containing a definition of v and u is a node (distinct from d) or branch containing a use of v, and there is a path between d and u that does not contain a kill of v. To illustrate, consider the CFG G in Figure 1. For the definition in node 1, there are DUAs (1,3,x), (1,4,x), and (1,6,x). For the definition in node 3, there is DUA (3,5,y). For the definition in node 6, there is DUA (6,5,y). A DUA can span multiple procedures if the variable is defined in one procedure and used in another procedure. The variable can be a global, a field, or any variable (possibly local) passed as a parameter in a procedure call, either by value or by reference. Our technique uses test-data adequacy criteria (e.g., [8, 13, 18], which select particular DUAs as test requirements. Then, test cases are generated that, when used for a program’s execution, satisfy these test requirements. A test case satisfies a DUA if executing the program with the test case causes traversal of a definition-clear subpath from d to u. Test-data adequacy criteria distinguish two types of uses. A computation use (or c-use) occurs when a value is used in a computation or output statement; a predicate use (or p-use) occurs when a value is used in a predicate statement. For a DUA containing a c-use, a test case must traverse a definition-clear subpath from d to u, whereas for a p-use, test cases must traverse definition-clear subpaths from d to both successors of u. One criterion, the “all-uses” criterion, requires that each feasible DUA in the program be tested. For example, a test suite that executes paths {En,1,3,4,5,6,Ex} and {En,1,2,4,6,4,5,6,Ex} would satisfy all DUAs.
3.
DUA-COVERAGE TECHNIQUE
Figure 2 shows a dataflow diagram2 with the phases of our DUAmonitoring technique for determining the coverage of DUAs based on branch-coverage information and direct DUA instrumentation. The technique inputs a program P and outputs a DUA-coverage report for P . The technique has three phases: static, dynamic, and 2 In a dataflow diagram, rectangles represent processing elements and edges represent the flow of data between the processing elements. In addition, we include a rhombus to indicate the particular element where the tester makes a choice.
reporting. In the static phase, the technique analyzes the program to find the DUAs and properties of those DUAs, and instruments the program for monitoring based on input from the tester. In the dynamic phase, the instrumented program is executed with a test case t, and coverage data from that execution is output. Finally, in the reporting phase, the technique uses the results of the static and dynamic analyses to produce a DUA-coverage report. Depending in part on the type of instrumentation chosen, the technique reports each DUA as definitely covered, possibly covered, or not covered. In the next sections, we discuss each of these phases in detail.
3.1 Static Phase Figure 2 shows that, in the static phase, the technique first performs two steps: Find DUAs and Compute DUA inferability. Find DUAs performs a data-flow analysis to find the set of intraprocedural and interprocedural DUAs in P , using standard iterative dataflow algorithms (e.g., [10, 19]). Variables passed as paramaters are considered to flow from caller to callee, rather than being “used” at the call site and “defined” at the entry of the called procedure. The analysis, however, treats formal parameters at entry points of the program (e.g., main) as definitions, because it assumes that external calling code is inaccessible for analysis. For the same reason, the analysis treats any variable passed as a parameter to a library as a use at the call site. The DUA analysis also associates with each DUA the kills that might be encountered between the definition and the use. The Compute DUA inferability analysis determines which DUAs can be infered from branch information alone. The ratio of inferable DUAs in a program is a static indicator of the precision that can be achieved with branch-based monitoring of DUAs. In the next step, the tester considers the DUAs and their inferability, and decides on branches or direct DUA instrumentation. Instrumenting only for branches requires inferring DUA coverage later, with some loss of precision. Instrumenting DUAs directly is precise but more expensive. The tester’s decision is represented by the rhombus in Figure 2. If the tester chooses the branch-based approach (top part of Figure 2), the static phase proceeds to the Find required branches step for the DUAs. This step outputs the required branches for the Instrument P with branches step, which produces program PBR . If the tester chooses direct DUA monitoring instead (bottom part of Figure 2), the static phase immediately proceeds to Instrument P directly, producing program PDU A .
Algorithm DUAInferability Input: P: the program to be analyzed duaSet: set of DUAs in P to classify Output: inferMarks: set of marks, one per DUA 1: // required analyses 2: R ← ComputeReachability(P) 3: D ← ComputeDominance(P) 4: PD ← ComputePostdominance(P) 5: // deal with multiple-alias variables 6: Remove multiple-alias DUAs from duaSet and mark them non-inferable 7: // find def-use order property 8: for all dua ∈ duaSet do 9: if !(use R def) ∨ def D use ∨ use PD def then 10: // def-use order guaranteed 11: if |kills| == 0 then 12: inferMarks[dua] ← inferable 13: else if !(use R def) ∧ all kills aligned with def-use then 14: inferMarks[dua] ← inferable 15: else 16: inferMarks[dua] ← cond-inferable 17: else 18: // def-use order not guaranteed 19: inferMarks[dua] ← non-inferable 20: return inferMarks Figure 3: Algorithm for DUA inferability The inferability and required branches analyses constitute the core contribution of our technique, and we describe them in detail in Sections 3.1.1 and 3.1.2, respectively. In Section 3.1.3 we discuss the instrumentation step, and Section 3.1.4 provides an analysis of the computational complexity of the static phase.
3.1.1 Inferability The inferability analysis classifies DUAs into three categories: inferable, conditionally inferable, and non-inferable. A DUA is inferable if its coverage can always be inferred from branch coverage. A DUA is conditionally inferable if it can be inferred from branch coverage in some program executions, but not in all executions. A DUA is non-inferable if its coverage can never be determined with certainty from branch coverage. Figure 3 presents the algorithm that classifies DUAs. Lines 2-4 compute required control-flow relations. Line 6 marks as non-inferable all DUAs whose variables have multiple aliases or are accessed through pointers that cannot be resolved to a single variable, and excludes them from further analysis. Lines 9-19 correspond to the main processing loop, where the inferability of each remaining DUA is determined, based on definition-use ordering and associated kills. The key component of the inferability analysis is the definitionuse order of DUAs. We say that a DUA is in def-use order if, whenever the definition and the use are covered, the definition is guaranteed to occur before the use. There are three conditions to determine whether a DUA is in def-use order. If any of these conditions hold, then the DUA is in def-use order. The conditions (line 9) are: 1. The definition is not reachable from the use. 2. The definition properly dominates the use. 3. The use postdominates the definition. If condition 1 holds, the definition cannot occur after the use, and thus, the def-use order is guaranteed. For most DUAs in realistic programs, however, the definition is reachable from the use. Programs often contain one main processing loop, or they are designed
to respond to events with handlers, where the same handler can execute more than once. Hence, the reachability condition often does not hold. In that case, the algorithm checks condition 2. If the definition properly dominates the use, then whenever the use executes, the definition will have been executed before it, so the def-use order is guaranteed. If this condition does not hold either, the algorithm checks the third and final condition. If the use postdominates the definition, then whenever the definition executes, the use will occur afterward, and the def-use order is guaranteed. If none of these conditions hold for a DUA, then it is possible that during execution the definition and the use are both covered, but the use occurs only before the definition, in which case the DUA is definitely not covered. Hence, if the DUA is not in defuse order, our technique cannot guarantee in any case that the DUA is covered, and the DUA is marked non-inferable (line 19). If the algorithm finds that the DUA is in def-use order, the DUA is either inferable or conditionally inferable (lines 11-16). The key in differentiating both DUA types is the existence of kills associated with the DUA (checked in line 11). If the DUA has no kills, it is definitely inferable (line 12). If, however, the DUA has associated kills, additional information about the kills is needed to determine how those kills affect the inferability of the DUA. For a DUA in def-use order with associated kills, the guarantees about the order in which events occur decide again how the DUA is classified. A kill prevents the DUA from being covered if it occurs always between the definition and the use. We say that such a kill is aligned with the definition and the use. An aligned kill never occurs before the definition or after the use. The algorithm uses the same three def-use order conditions to determine whether the definition-kill and the kill-use orders hold (line 13, second clause). If there is a kill for which these conditions do not hold, then whenever the definition, the use, and that particular kill are covered, the algorithm cannot decide with certainty whether or not the DUA was killed; in some executions satisfying these conditions, the DUA is covered, but in others, it is not. The algorithm classifies DUAs with non-aligned kills as conditionally inferable (line 16), because their coverage can only be guaranteed under a certain condition (i.e., that no non-aligned kill occurs). Finally, a DUA in def-use order whose definition is reachable from the use (as checked in line 13, first clause) poses an additional difficulty. If the definition and the use are covered, branch coverage information cannot always tell whether the definition and the use executed once or many times. Even if all associated kills are aligned, if any kill occurs, the definition might have been killed on every iteration before reaching the use, but is it also possible that in one iteration the definition was not killed and reached the use. Hence, the algorithm also classifies this DUA as conditionally inferable, because its coverage can be guaranteed only if no kill occurred at all. To illustrate how the inferability analysis classifies DUAs, consider CFG G in Figure 1. For variable x, DUAs (1,3,x), (1,4,x), and (1,6,x) are all inferable, because condition 1 holds (the definition is not reached by the uses), and there are no kills for definition (1,x). If we add G� to the example, however, G is called from a loop located in G� . In this case, the DUAs for x are still inferable, but for a different reason. Condition 1 does not hold, because definition (1,x) is reachable from each use, but condition 2 holds, because the definition (1,x) properly dominates all three uses of x. For variable y, there are two DUAs: (3,5,y) and (6,5,y). In the case of (3,5,y), although the definition is not reachable from the use (condition 1), there exists a kill (6,y) that is not aligned with the definition and the use. Because of the loop between nodes 4 and 6, this kill might occur before or after y flows from (3,y) to (5,y).
For example, knowing that the definition, the use, and the kill were covered, does not imply that the DUA was definitely not covered. The reason is that there exist two executions (paths) that cover the three entities: {En,1,3,4,6,4,5,6,Ex} and {En,1,3,4,5,6,Ex}. The first path does not cover the DUA, but the second path covers it. DUA (6,5,y) is non-inferable, because none of the three conditions hold: the definition is reachable from the use, the definition does not properly dominate the use, and the use does not postdominate the definition. Knowing that definition (6,y) and use (5,y) are covered is not enough to tell whether the DUA was covered or not. There are two paths, {En,1,2,4,5,6,Ex} and {En,1,2,4,6,4,5,6,Ex}, both covering the defintion and the use, such that the first path does not cover the DUA, but the second path covers it.
3.1.2 Required Branches For each node n in the program, our technique determines the set of branches on which n is control dependent. We call this set required branches(n), because taking any one of these branches during runtime implies that n is executed. The size of required branches(n) is usually one. Note, for a p-use, the required branches set is exactly the p-use branch. Some nodes are dependent on the execution entering a method. For that reason, for each method in P , the technique defines a special entry branch (e.g., Start-T in Figure 1), on which such nodes are dependent. To determine whether a DUA is covered, at least one required branch for the definition and one for the use must be covered. If a required branch for a kill is taken, and the definition and the use are also taken, then the technique will report that the DUA was either not covered or possibly covered, according to the inferability analysis. To illustrate required branches, consider Figure 1. For DUA (1, 3, x), the definition requires that the entry branch Start-T be executed, and the use requires that branch 1F be executed. Similarly, DUA (6, 5, y) requires execution of branches 4F (for the definition) and 4T (for the use).
3.1.3 Instrumentation In Figure 2, when the tester chooses to monitor DUAs based on branches, the branch instrumenter module inputs the original program P and the required branches for all DUAs, and instruments it using any well known efficient approach (e.g., [4, 5]) to produce the instrumented program PBR . If the tester chooses direct DUA instrumentation, the direct DUA instrumenter inputs the program P and the set of DUAs, and instruments P using an efficient implementation of the last-definition approach, such as the one described in our DUA-F ORENSICS tool (see Section 4.1), to produce the instrumented program PDU A .
Table 1: DUA coverage results for reporting. DUA type Inferable Conditionally inferable Non-inferable
Definition and use covered No kills Kill(s) Definitely covered Not covered Definitely covered Possibly or not covered Posibly covered Posibly covered
the DUA analysis, because reachability, dominance, and postdominance can also be formulated as a set of monotone and distributive data-flow equations. For the last two steps, let D be the number of DUAs, which is quadratic in the number of nodes in the worst case, but in practice is almost linear. Multiple-alias variables can be identified during DUA computation, so line 6 is O(D). The last step is the loop formed by lines 8-19, which iterates once per DUA. This loop is O(D). Required branches analysis visits the branches postdominated by each node or branch to find control dependencies. This analysis is O(N 2 ), but in practice the number of branches to visit per node is much less than N . Therefore, the time complexity of the static phase is O(N 2 ), but in practice we expect it to be close to linear.
3.2 Dynamic Phase In Figure 2, for the branch-based approach (top), the dynamic phase consists of the Monitor execution of PBR step. This step inputs the instrumented program PBR and analysis results from the static phase, as well as individual test cases t from the tester. The dynamic phase then produces a branch coverage report for the next phase. When the approach is direct DUA monitoring (bottom of figure), this phase consists of the Monitor execution of PDU A step, which inputs the instrumented program PDU A and the set of DUAs from the static phase. The tester provides test cases t to this step, and the phase produces a final DUA-coverage.
3.3 Reporting Phase In Figure 2, the Compute DUA coverage step of the reporting phase (top) takes four inputs from the dynamic phase: the set of DUAs, the inferability of the DUAs, the required branches, and the branch coverage for each test case t. The reporting phase checks the coverage of definitions, uses, and kills using branch coverage, and based on that determines the coverage for every DUA. Depending on the inferability type of a DUA, this phase reports the DUA as definitely covered, possibly covered, or not covered. If no required branch is met for the definition or the use, the DUA is reported as not covered. If the conditions for a DUA are met, Table 1 lists the results that can be output, according to the inferability type of the DUA and the kills covered.
3.1.4 Complexity Analysis The static phase performs several analyses, all of which contribute to the computational complexity of this phase. A standard interprocedural DUA analysis is O(N 2 ), where N is the number of nodes in the ICFG, but the iterative data-flow analysis can be made more efficient by utilizing the loop structure of the program, as shown by Kam and Ullman [12]. Doing so requires at most d(G) + 3 passes over each node, where d(G) is the loop depth of graph G (the ICFG). Hence, the complexity of the DUA analysis is actually O(N ∗ d(G))). The upper bound of d(G) is N , but in practice we expect d(G) to be much less than N . Inferability analysis (Figure 3) consists of five steps. The first three steps (lines 2-4) have the same computational complexity as
4. EMPIRICAL EVALUATION The goal of our study is to empirically investigate the effectiveness of our branch-monitoring DUA-coverage technique and the efficiency of our branch-monitoring and DUA-monitoring techniques relative to each other and to existing monitoring reports. To this end, we developed a prototype tool, DUA-F ORENSICS, and used it to perform an empirical study on a set of subjects. The study investigates three research questions: RQ1: What percentage of DUAs are classified as inferable, conditionally inferable, and non-inferable?
Table 2: Subject programs in our studies. Program Tcas Compress Db Mtrt Scimark2 Jess
LOC 150 587 663 1242 1805 6365
Description Aircraft collision avoidance SPEC - common substrings SPEC - database on memory SPEC - raytracer that depicts dinosaur Computational kernels, reports Mflops SPEC - Java Expert Shell System
RQ2: What percentage of conditionally and non-inferable DUAs that are reported as possibly covered at runtime are actually covered? RQ3: What overhead do the branch monitoring and the DUA monitoring impose on the program? This section first presents an overview of the prototype tool, then presents the empirical setup, and finally presents the results and discussion.
4.1 The DUA-F ORENSICS Tool DUA-F ORENSICS implements all phases of the technique shown in Figure 2. We developed DUA-F ORENSICS in Java, using the Soot analysis framework [22]. Our tool analyzes and instruments compiled Java 1.4 bytecode programs, through the Jimple intermediate representation. In preliminary investigations, we found that most of the Java programs we surveyed as potential subjects of study have more DUAs for local variables than for fields. Thus, for the study of our technique, we concentrated our efforts on DUAs of local variables first. We implemented a DUA analyzer to find all DUAs of local variables, both intraprocedural and interprocedural, using iterative data-flow algorithms [10, 19]. The analysis also identifies aliases caused by actual parameters at call sites, and when it encounters such an use of an aliased variable with more than one possible origin (definition), it marks all DUAs associated with the use as non-inferable. The inferability analysis requires interprocedural reachability, dominance, and postdominance relations, which DUA-F ORENSICS also computes. DUA-F ORENSICS can instrument the program for any given set of branches and DUAs. Branch instrumentation is straightforward. To instrument DUAs directly, we designed an efficient probe scheme for the last-definition monitoring method. At runtime, the tool creates a DUA coverage matrix m initialized with zeroes, where each column corresponds to a use, and each cell in a column represents a definition for that use. The height of each column corresponds to the maximum number of definitions per use, for all DUAs. Because uses normally have different numbers of associated definitions, not all cells are used. However, this layout helps reduce the runtime cost of the probe by quickly accessing the matrix using two indices: a use ID and a definition ID. Moreover, the dimensions of the matrix are enlarged to the next highest power of two, so multiplications to access cells are replaced with shift operations, which are more efficient. During execution, the probes track the last definition of a variable with a register that contains the ID of the last executed definition for that variable. At each use, the instrumenter inserts code that reads the last definition ID and uses it as the row index when accessing the corresponding cell in the matrix. However, the intrumenter eliminates the need for many last-definition registers when each use of a variable has only one reaching definition. In such
cases, the instrumenter inserts a probe at each use that sets a predetermined cell in the matrix, thus avoiding the cost of indexing. For example, in Figure 1, there is only one definition of variable x. Therefore, the instrumenter inserts probes of this type at use nodes 3, 4, and 6. For the remaining variables, the tool inserts a probe at each definition that updates the last-definition register of each distinct variable associated with a definition ID. For example, the definitions of variable y at nodes 3 and 6 in Figure 1 are instrumented with an instruction of the form ldy = IDy , where IDy is either 0 or 1, assumming these are the respective IDs assigned to the definitions of y. At each use, a probe with the instruction m[IDuse , ldv ] = 1 is inserted. This probe, unlike the simpler version for singledefinition variables, is more expensive. It requires fetching from memory the last-definition ID and adding it to the base address of the use column, before updating the appropriate cell.
4.2 Empirical Setup 4.2.1 Subject Programs As subjects for our study, we used a set of six Java programs, ranging in size from 150 LOC to 6365 LOC. Table 2 provides information about the programs. For each program, the first column lists the program’s name, the second column lists the number of lines of Java code, and the third column provides a brief description. Tcas is from the Siemens suite,3 first described by Hutchins et al. [11], and used for many testing and debugging experiments. We selected Tcas because, although small, it is an example of the style of programs written for critical avionics systems, and often require testing of the data flows in the system (see DO-178B standard, which is used for certifying avionics software). Scimark2 is a benchmark for measuring the performance of the Java platform for scientific computing.4 We selected this program because, although it is used to evaluate high-performance computers, it was developed independently of the rest of our subject programs. The other four programs are from the SPECjvm98 benchmark suite,5 which is a standard set of benchmarks used to evaluate Java virtual machines (JVMs). We selected these programs, in part, because they were used by Misurda et al. [17] for their experiments on monitoring expense for DUAs. Using some of the same programs lets us compare our results with theirs.
4.2.2 Experiment Design and Analysis Strategy To perform the studies, we used the implementation of our technique, DUA-F ORENSICS. The tool performs analysis and instrumentation as shown in Figure 2 and described in Section 4.1. We ran our experiments on a laptop with an Intel Core Duo 2 GHz processor and 1 GB RAM. For each subject program, we computed the set of DUAs and then used the two versions of the process: Version 1. After the tool computed the inferable DUAs, we selected branch instrumentation. The tool then computed the required branches, instrumented for branch coverage, measured the time required for branch monitoring, used the branch report to identify those DUAs that were definitely covered and those DUAs that were possibly covered by the test suite, and reported the definitely and possibly covered DUAs along with the branch-monitoring time. Version 2. We selected the DUA instrumentation. The tool then instrumented for DUA coverage, measured the time required for 3
http://www.cc.gatech.edu/aristotle/Tools/subjects. http://math.nist.gov/scimark2. 5 http://www.spec.org. 4
Table 3: Numbers of inferable, conditionally inferable, and non-inferable DUAs. Program Tcas Compress Db Mtrt Scimark2 Jess
# Inferable DUAs 136 209 252 30 319 2461
# Conditionally inferable DUAs 0 41 71 9 201 636
# Non-inferable DUAs 0 195 203 62 534 9830
DUA monitoring, and reported by the set of DUAs covered along with the DUA-monitoring time. We used the results of these two versions of the DUA-monitoring to answer our research questions.
Figure 4: Percentage of DUA inferability types.
4.2.3 Threats to Validity Like any empirical study, these studies have limitations that must be considered when interpreting their results. We applied our two DUA-monitoring techniques on only six programs, and cannot claim that these results generalize to other workloads. However, the programs are real programs that have been used for many studies, including testing and monitoring studies, and thus, we can gain some insight as to the relative effectiveness of our techniques. Also, the experiments we are performing are not dependent on the size of the program, and results should apply as well to larger programs. Threats to internal validity mostly concern possible errors in our techniques’ implementations and measurement tools. In particular, we needed to ensure the correctness of our computation of such data as the inferable DUAs, computed statically, and the covered DUAs, computed by the two monitoring approaches at runtime. To control for these threats, we validated the implementations on small programs, spot checked the results of the larger programs, and performed several sanity checks.
4.3 Results and Discussion In this section, we present the results of the study and discuss how they address the three research questions that we are investigating.
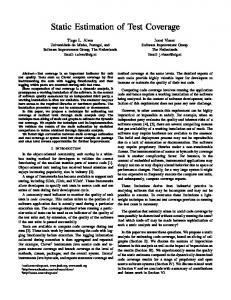
4.3.1 RQ1: Percentage of Inferable DUAs To address this first question, we used three results of running DUA-F ORENSICS: the set of inferable DUAs in each program, the set of conditionally inferable DUAs in each program, and the set of non-inferable DUAs in each program. Table 3 shows the results of the experiment. The first column gives the program’s name. the second column lists the number of DUAs inferable by branches using our technique, the third column lists the number of DUAs conditionally inferable by branches, and the fourth column lists the number of DUAs not inferable by branches. For example, for Compress, 209 DUAs are classified by our technique as inferable, 41 are classified as conditionally inferable, and 195 are classified as noninferable. Figure 4 shows for all subjects the percentage of DUAs in each of the three categories: inferable, conditionally inferable, and noninferable. The horizontal axis gives the subject programs and the vertical axis gives the percentage. For each subject program there are three bars. The first bar represents the inferable percentage, the second bar represents the conditionally-inferable percentage, and the third bar represents the non-inferable percentage.
By inspecting Table 3 and Figure 4, we can see that, for our subject programs, in most cases, over 30% of the DUAs are inferable from branches, and in many cases the percentage is greater than 40%. This means that, without adding the overhead of direct DUA monitoring, for our subject programs, we can measure the coverage of a considerable number of DUAs. This information can be used in several ways. First, the tester may be interested in covering only a subset of DUAs in the program. If these DUAs are inferable, she can monitor them using the less expensive branch monitoring, and avoid the more expensive DUA monitoring. Second, the tester can use the percentage of inferable DUAs, along with the precision of the predicted DUAs, which is evaluated below, to decide whether to select the branch monitoring or the more expensive DUA monitoring to determine the DUA coverage. For example, on one hand, in Jess the inferable and conditionally inferable DUAs together constitute less than 25% of the DUAs, and thus, this program might not be a good candidate for branch-based monitoring. On the other hand, for subjects with a high number of inferable and conditionally inferable DUAs, such as Compress or Db, branch coverage might be a good choice for DUA monitoring. We can also see that for one subject, Tcas, all DUAs are inferable from branches. This 100% inferability by branches occurs, in this case, because there are no loops in the program. Although small, Tcas is written in a constrained style similar to many critical avionics systems, which also may have a considerable number of DUAs inferable from branches. Because branch coverage is required for such systems, coverage of many of the DUAs can be obtained for free. Furthermore, the remaining DUAs can be monitored for directly, reducing the overall cost of measuring DUA coverage.
4.3.2 RQ2: Precision of Predicted DUAs To address this second question, we used three results of running DUA-F ORENSICS: the set of conditionally- and non-inferable DUAs, the set of DUAs predicted as covered at runtime (i.e., DUAs reported as possibly covered), and the set of DUAs actually covered during runtime. For each subject, we computed these sets by running the same test cases on the program instrumented with branches and the program instrumented for DUAs. Table 4 and Figure 5 shows the results. In Table 4, the first column gives the program’s name, the second column lists the number of conditionallyand non-inferable DUAs predicted as being covered during runtime, the third column lists the number of these predicted DUAs actually covered during runtime, and the fourth column lists the percentage of DUAs (computed using the ratio of the second and
Table 4: Precision of DUA prediction. Program Tcas Compress Db Mtrt Scimark2 Jess
Predicted DUAs NA 189 170 34 587 2343
Covered DUAs NA 158 129 34 515 1813
Precision of prediction NA 83.6% 75.9% 100% 87.7% 77.4%
Figure 5: Precision of DUA prediction. third columns) correctly predicted as covered. For example, for Compress, 189 DUAs were reported by our technique as possibly covered by the test suite, and 158 of those were actually covered during runtime, which corresponds to 83.6% accuracy. By inspecting the table and figure, we can see that, for our subject programs, the precision for the predicted DUAs is high—in all cases, over 75%—and in one case, for Mtrt, the precision is 100%. Note that for Tcas, because all DUAs are inferable, no DUAs are conditionally inferable, and thus, there are no applicable values for this subject. The results for RQ1 and RQ1 demonstrate a viable way to estimate the number of DUAs that were covered during runtime, based only on covered branches. This prediction can assist the tester in deciding whether to monitor for branches or to use the more expensive DUA monitoring. Because we believe that the particular characteristics of each program affect the predictability of the DUAs by branches, a tester could run the program a few times, monitoring for both branches and DUAs, and determine the precision of the predictability for that program. Using this information, along with DUA inferability results, the tester can estimate the percentage of covered DUAs using branch monitoring, and decide which type of monitoring to use.
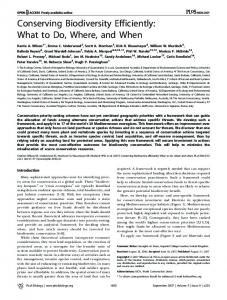
4.3.3 RQ3: Overhead of Monitoring To address this third question, we used the results of running DUA-F ORENSICS, and gathered the running time of the programs with the branch monitoring and the DUA monitoring. Table 5 shows the results. In the table, the first column gives the program’s name, the second column lists the running time of the full test suite on the uninstrumented version in seconds, the third and
Table 5: Overhead of branch, DUA monitoring. Program Tcas Compress Db Mtrt Scimark2 Jess
Base time (sec.) 190.08 4.16 11.83 1.13 0.19 2.44
Overhead % branch DUA 1.92 17.91 32.37 132.00 2.30 8.68 1.13 1.31 5.39 160.38 10.76 74.89
Figure 6: DUA to branch overhead ratios.
fourth columns list the overhead as a percentage for the branch monitoring and the DUA monitoring. For example, for Compress, the uninstrumented version took 4.16 seconds, the branch monitoring added 32.37% overhead, and the DUA monitoring added 132% overhead. Figure 6 illustrates the relative costs of branch and DUA monitoring. For example, monitoring DUAs directly in Jess is 7 times as expensive as monitoring branches. The wild variations observed in overheads across subjects can be explained by several factors: portion of running time spent on I/O operations and library calls (which are not instrumented and thus do not contribute overhead), branch and DUA density, and the impact of instrumentation on register allocation as well as on instruction and data locality (cache effectiveness). The percentages in the table show clearly that, in most cases, the DUA monitoring is considerably more expensive than the branch monitoring. For example, the difference in overhead of branch monitoring and DUA monitoring for Scimark2 is 154.99% and for Compress it is 99.63%. Because of this difference in overhead, it may be beneficial to infer DUA coverage using branch coverage in some cases. For example, we saw for Compress, in the results of the studies for RQ1 and RQ2, that approximately 47% of the DUAs are inferable from branches (Table 3), and that another 9% are conditionally inferable (Table 4). We also saw that for Compress, there is 84% precision of prediction. This means that by monitoring only for branches, we could infer with certainty between 47% and 56% DUA coverage of the program, while obtaining a good estimate on the remaining DUAs. More studies are needed to determine whether this holds for other programs. The overhead for DUA monitoring, for most subject programs, is considerably more expensive than branch coverage (see Figure 6). However, it can incur less overhead than that reported by Misurda et
al. [17] To see this, consider the four SPECjvm98 benchmark programs: Compress, Db, Mtrt, and Jess. In their paper, Misurda et al. reported that demand-driven DUA monitoring incurred overhead of 41% for Compress, 4% for Db, 105% for Mtrt, and 179% Jess. Our technique reported 132%, 8.7%, 1.3%, and 74.9%, respectively for these four programs. For Mtrt and Jess, our approach results in less overhead than the demand-driven approach. Note that the DUAs that Misurda et al. monitor are intraprocedural only, whereas ours are both intraprocedural and interprocedural. This could account for the difference in Compress and Db. Also note that we used the Sun JVM version 6, released by the end of 2006, whereas Misurda et al. published their work in 2005 and used the Jikes JVM. Any differences in optimizations performed by these JVMs, as well as the hardware utilized, might affect the comparison of our respective techniques. Although we cannot draw any definitive conclusions from this comparison, we can see that our direct DUA-monitoring technique appears to be efficient compared with the one used in the study of the demand-driven approach. Additional experiments are needed to determine whether we can generalize these results. We are also confident that incorporating demand-driven instrumentation in our tool [17, 21], will further reduce the overhead of both our branch and DUA instrumentation. The reason lies in the 80-20 rule: 80% of the running time is spent in 20% of the code. Our instrumentation is not removed after branches or DUAs are covered, thus incurring in extra overhead whenever a branch or DUA is covered multiple times. With dynamic removal of probes, we expect the overheads of both types of instrumentation to be reduced considerably.
5.
RELATED WORK
A number of existing techniques are related to ours in that they attempt to reduce monitoring costs by identifying a subset of entities that must be monitored to ensure that coverage of all entities is achieved. Ball and Larus [4] present a technique for placing a minimal number of branch probes from which profiling of all branches can be inferred. Although they can reduce the number of probes required to monitor the branches, unlike ours, their approach provides no assistance in determining the DUAs that are covered using the branch monitoring. Some techniques make explicit use of subsumption (coverage implication) to infer the coverage of one entity from the coverage of another entity. Agrawal presents intraprocedural [1] and interprocedural [2] techniques for identifying sets of mutually subsuming basic blocks such that, if any block in a set is covered, then all blocks in the set are covered. Thus, it is only necessary to instrument one block from each set. Bertolino and Marré [15] construct a subsumption hierarchy to identify spanning sets of entities that are “unconstrained,” that is, not subsumed by any other entity. By covering these unconstrained entities, coverage of the remaining entities is guaranteed. Their main goal, however, is to guide test case generation to cover as many entities as possible by targetting unconstrained entities. For the purpose of reducing instrumentation, their work can be seen as a generalization of Agrawal’s methods. They have applied their technique to different types of entities, including branches [5] and DUAs [14]. However, unlike ours, their approach does not consider the interaction of different kinds of entities, and thus, does not provide a method for inferring DUA coverage from coverage of other entity types, such as branches. Two previous approaches address inference among entities of different types. One of them is a subsumption algorithm [20] for entities of any type, based on commonly implied branches. How-
ever, no empirical study of this general approach for entity-to-entity subsumption has been performed to date. The other approach, by Merlo and Antoniol [16], is a technique to identify implications between CFG nodes and data dependences. They define relations to estimate intraprocedural data dependences whose coverage is implied by coverage of statements. Their work is similar in spirit to ours. However, their technique is limited to a subset of intraprocedural data dependences, and they use statement coverage, which is weaker than branch coverage in predictive power. Other approaches are related to ours in that they attempt to reduce monitoring overhead with dynamic insertion and deletion of probes. Many of these techniques are based on “trampolines,” which provide mechanisms for inserting and deleting binary code at runtime. Tikir and Hollingsworth [21] present a technique, based on DYNINST [6], that inserts probes for statement coverage and removes the probes after they are executed. A similar approach [17], also based on trampolines, inserts probes on-demand when target code is executed, and then removes those probes when no longer needed. The authors applied their approach to node, branch, and intraprocedural DUA coverage. Arnold and Ryder [3] take a different approach by replicating instrumented code and adding switches that decide when to run instrumented code instead of the original code. Although their goal is to reduce overhead costs with sampling-based instrumentation, which is too imprecise for our purposes, their approach can also be used to reduce the cost of more precise coverage monitoring. Their approach does not require specialized support from the virtual machine and works exclusively at the application level, and thus provides an alternative to trampolines. Our approach differs from all these approaches in that it performs no dynamic insertion or removal of probes. Instead, we perform different analyses before instrumentation and after execution to infer the DUAs covered from branch coverage. Thus, on one hand, our approach does not incur the overhead of inserting and deleting probes during runtime or switching to alternative code, but, on the other hand, our approach can take advantage of these dynamic approaches for those probes located in the most frequently executed paths. Although it is difficult to compare our timings with these dynamic approaches without a complete implementation of these approaches, comparing the overhead incurred by our implementation with that of Misurda et al. suggests that ours can be as efficient as the dynamic approaches, for both our branch-based and direct DUA-monitoring techniques.
6. CONCLUSION AND FUTURE WORK In this paper, we presented a technique for inferring DUA coverage from branch monitoring along with an efficient implementation of the last-definition monitoring approach for direct measurement of DUA coverage. The two approaches for monitoring DUAs have efficiency and precision trade-offs. The branch-monitoring technique incurs little overhead during execution but may not be able to infer all the required DUAs from the branch-coverage information. The direct DUA-monitoring technique incurs considerably more overhead but provides precise DUA-coverage information. We discussed several scenarios under which a tester would want to use this branch-monitoring technique for measuring DUA coverage. Our empirical studies provide evidence that our technique can provide savings over previous approaches to monitoring for DUA coverage, but they also lead to a number of areas for future work. First, our empirical study shows that, for the subjects we studied, many DUAs are inferable from branch-monitoring information. However, our subject suite is small, and these results may not
generalize. Thus, our future work will include obtaining additional and more diverse subjects and performing the same set of experiments on them. Second, our empirical study also showed that many DUAs that are predicted as being covered using the branch-monitoring information are actually covered during execution. We suggested that one way to get an approximation of the number of inferable DUAs was to first run the program some number of times, using both branch monitoring and DUA monitoring, to “learn” how well the DUAs can be predicted and then use this estimate to approximate the DUAs that will be covered during execution. Although this is a reasonable approach, we did not experiment with it for our subjects. Thus, we do not know the feasibility or accuracy of such an approach. In future work, we will perform experiments by selecting various-sized subsets of the test suite, computing the precision of the prediction, and determining the accuracy of the prediction. Third, our empirical study showed the overhead penalty for the branch- and DUA-monitoring approaches. In some cases, these differences are quite significant. Because of these differences, we plan to investigate the development of a hybrid-monitoring approach that provides precise DUA coverage, monitoring inferable DUAs indirectly through branches and instrumenting conditionally- and non-inferable DUAs directly. Finally, we discussed several related techniques, including the demand-driven instrumentation approach for monitoring DUAs. For the four subject programs that our empirical study shares with that approach, we believe that our techniques for branch and DUA monitoring perform well in comparison. However, we need to perform a more controlled study to verify this. Also, by incorporating dynamic instrumentation removal as shown in Section 5, we expect to further improve the performance of both our branch and direct DUA monitoring, as well as our proposed hybrid approach.
7.
ACKNOWLEDGMENTS
This work was supported in part by NSF awards CCF-0541049, CCF-0429117, and CCF-0306372 to Georgia Tech and by Tata Consultancy Services, Ltd.
8.
REFERENCES
[1] AGRAWAL , H. On slicing programs with jump statements. In Proceedings of the ACM SIGPLAN ’94 Conference on Programming Language Design and Implementation (June 1994), pp. 302–12. [2] AGRAWAL , H. Efficient coverage testing using global dominator graphs. In PASTE ’99: Proceedings of the 1999 ACM SIGPLAN-SIGSOFT workshop on Program analysis for software tools and engineering (September 1999). [3] A RNOLD , M., AND RYDER , B. G. A framework for reducing the cost of instrumented code. In SIGPLAN Conference on Programming Language Design and Implementation (June 2001), pp. 168–179. [4] BALL , T., AND L ARUS , J. R. Optimally profiling and tracing programs. In POPL ’92: Proceedings of the 19th ACM SIGPLAN-SIGACT symposium on Principles of programming languages (New York, NY, USA, 1992), ACM Press, pp. 59–70. [5] B ERTOLINO , A. Unconstrained edges and their application to branch analysis and testing of programs. Journal of Systems and Software 20, 2 (Feb. 1993), 125–133. [6] B UCK , B., AND H OLLINGSWORTH , J. K. An API for runtime code patching. The International Journal of High Performance Computing applications 14 (2000), 317–329.
[7] F ERRANTE , J., OTTENSTEIN , K. J., AND WARREN , J. D. The program dependence graph and its use in optimization. ACM Transactions on Programming Languages and Systems 9, 3 (July 1987), 319–349. [8] F RANKL , P., AND W EYUKER , E. J. An applicable family of data flow criteria. IEEE Transactions on Software Engineering 14, 10 (Oct. 1988), 1483–1498. [9] H ARROLD , M., AND ROTHERMEL , G. Performing dataflow testing on classes. In Proceedings of the Second ACM SIGSOFT Symposium on Foundations of Software Engineering (December 1994), pp. 154–163. [10] H ARROLD , M. J., AND S OFFA , M. L. Efficient computation of interprocedural definition-use chains. ACM Trans. Program. Lang. Syst. 16, 2 (1994), 175–204. [11] H UTCHINS , M., F OSTER , H., G ORADIA , T., AND O STRAND , T. Experiments on the effectiveness of dataflowand controlflow-based test adequacy criteria. In Proceedings of the 16th International Conference on Software Engineering (May 1994), pp. 191–200. [12] K AM , J. B., AND U LLMAN , J. D. Global data flow analysis and iterative algorithms. Journal of the ACM 23, 1 (Jan. 1976), 158–171. [13] L ASKI , J. W., AND KOREL , B. A data flow oriented program testing strategy. IEEE Transactions on Software Engineering 9, 3 (May 1983), 347–54. [14] M ARRÉ , M., AND B ERTOLINO , A. Unconstrained duas and their use in achieving all-uses coverage. In ISSTA ’96: Proceedings of the 1996 ACM SIGSOFT international symposium on Software testing and analysis (New York, NY, USA, 1996), ACM Press, pp. 147–157. [15] M ARRÉ , M., AND B ERTOLINO , A. Using spanning sets for coverage testing. IEEE Transactions on Software Engineering 29, 11 (November 2003), 974–984. [16] M ERLO , E. M., AND A NTONIOL , G. A static measure of a subset of intra-procedural data flow testing coverage based on node coverage. In CASCON ’99: Proceedings of the 1999 IBM conference of the Centre for Advanced Studies on Collaborative research (November 1999). [17] M ISURDA , J., C LAUSE , J., R EED , J., C HILDERS , B. R., AND S OFFA , M. L. Demand-driven structural testing with dynamic instrumentation. In International Conference on Software Engineering (May 2005), pp. 156–165. [18] N TAFOS , S. On required elements testing. IEEE Transactions on Software Engineering SE-10 (November 1984), 795–803. [19] PANDE , H. D., L ANDI , W. A., AND RYDER , B. G. Interprocedural def-use associations for c systems with single level pointers. IEEE Trans. Softw. Eng. 20, 5 (May 1994), 385–403. [20] S ANTELICES , R., S INHA , S., AND H ARROLD , M. J. Subsumption of program entities for efficient coverage and monitoring. In SOQUA ’06: Proceedings of the 3rd international workshop on Software quality assurance (New York, NY, USA, 2006), ACM Press, pp. 2–5. [21] T IKIR , M., AND H OLLINGSWORTH , J. Efficient instrumentation for code coverage testing. In Proceedings of the ACM SIGSOFT International Symposium on Software Testing and Analysis (July 2002). [22] VALLEE -R AI , R., H ENDREN , L., S UNDARESAN , V., L AM , P., G AGNON , E., AND C O , P. Soot - a java optimization framework. In Proceedings of CASCON 1999 (Sept. 1999), pp. 125–135.