Effort Distribution in Model-Based Development Werner Heijstek1 and Michel R. V. Chaudron1,2 1
Leiden Institute of Advanced Computer Science, Leiden University Niels Bohrweg 1, 2333 CA Leiden, The Netherlands
[email protected] 2 Department of Mathematics and Computer Science Technische Universiteit Eindhoven P.O.Box 513, 5600 MB Eindhoven, The Netherlands
[email protected]
Abstract. In this paper we explore how the total effort spent on software development projects is distributed over different development disciplines over time. In particular, we focus on projects that employ modelbased development practises. We present empirical data that was collected from 20 industrial software development projects. We discuss how the pattern that emerges from these industrial data sets relates to the humps-picture that has become iconic for the RUP development process.
1
Introduction
Empirical assessment of industrial software engineering process is necessary because there is a lack of empirical data regarding software engineering practice. We focus on relationships between effort distribution and software engineering process characteristics such as productivity, development time, system quality, code rework and system size. Resulting observations could lead to improved project planning practices and increased accuracy in terms of planning intervention during the execution of a project. Increased accuracy in planning practice enables better allocation of resources which could lead to cost reduction. For example, earlier work in this direction investigated the relation between effort distribution and defects found [1]. That research suggests that the ratio of the effort spent on requirements-, analysis and design- and implementation-disciplines, could serve as an indicator of the amount of defects that will be found during a software development project. This study focusses on effort distribution in model-based software engineering processes specifically ie. software development in which models play a central role. The nature of this study is two-fold. First it tries to answer the question: How is effort distributed over disciplines, as defined by the Rational Unified Process, in model-based development? By looking at the relation between the effort spent on the main engineering disciplines in industrial practice, the role of the design phase can be determined. A figure that is commonly referred to in the context of project planning is the Rational Unified Process’ humps-figure which depicts the effort that would
be spent during a project on each of the methodology’s nine disciplines. In the light of model-based development, the validity of this icon is investigated by asking: To what extent does the Rational Unified Process ‘hump’ chart resembles real projects?. We attempt to quantitatively validate the RUP chart much like Port, Chen and Kruchten did earlier [2], but using a set of industrial projects. Section three contains a brief introduction of the Rational Unified Process (RUP) and the RUP hump chart. In section four, the project data set and visualisation method will be elaborated on. The plotted humps will be discussed and presented in section five.
2
State of the Art
Distribution of effort in software engineering process is mostly researched in the context of estimation and planning of software projects: [3], [4], [5], [6]. A large volume of the research in that area however is involved with estimating the total amount of effort needed for a project under different conditions or development methods; e.g. reuse of code [7], or use-case based requirement specifications [8]. An open question in research on software engineering process effort is to find out: “What is an effective distribution of effort over disciplines?” Recent work in this direction includes that of Huang and Boehm [9] and Yiftachel [10]. Both aforementioned approaches try to come up with a predictive model for deciding on an optimal effort distribution for different phases based on defect-introduction and defect-slippage. Recent work in investigations in effort distribution as a base for optimising system quality with a limited amount of resources [10] is based on theory or on experiments which are rather restricted in size as well as circumstances. This research aims to assess industrial projects.
3
Research Setting
The projects that were examined for this research all made use of services offered by a specialized department for software delivery that is part of a major IT service delivery organization. The tooling that was used by the projects in our data set consists of: – – – – – 3.1
IBM Rational ClearQuest, used for tracking defects QSM SLIM-Estimate, a tool for estimating time, effort and cost QSM SLIM-Control, used to assess the status of a project. Open Workbench, an open-source alternative to Microsoft Project CA Clarity, a web-based project portfolio management (PPM) system The Rational Unified Process
The Rational Unified Process (RUP) is an adaptable process framework that can be used for iterative software development and is described in detail by
Kruchten [11]. The RUP lifecycle organizes software engineering processes into phases and iterations. A project has four phases which roughly correspond to the first four main stages of the waterfall model: requirements definition, system and software design, implementation and unit testing, and integration and system testing. In the inception phase (a) the business case and the financial forecast are created as well as a use-case model, a risk assessment and project description. The elaboration phase (b) is used to perform problem domain analysis and to shape the architecture. During the construction phase (c) the development and integration of components are the central activities. Finally, the transition phase (d) the software system that is developed will be implemented at the customer’s organisation. In the light of separation of concerns, RUP has a distinct set of activity types which are called disciplines. The effort that is spent on activities are categorised into 9 disciplines. The business modeling discipline (1) is concerned with activities that bridge business and software engineering in order to understand business needs and to translate them to software solutions. The requirements engineering discipline (2) is concerned with elicitation and organization of functionality and non functional demands and aims to create a description for what the system should do. The analysis and design discipline (3) is concerned with the mapping of requirements to a formal design. The resulting design model acts as a blueprint for the source code. A modeling language such as the Unified modeling Language (UML) can be used to design classes and structure them in to packages with well-defined interfaces which represent what will become components in the implementation. During the implementation discipline (4), the actual implementation of the components is done, either by reuse or by creation of new components. The test discipline (5) is executed throughout the project and serves to verify the interaction between objects and the completeness and correctness of the implementation of the requirements. This discipline is also responsible for the elicitation of defects and their respective fixes. The deployment discipline (6) is concerned with product releases and end-user delivery of these releases. Activities that fall in the configuration and change management discipline (7) deal with change requests with regard to project artifacts and models, and version control of these changes. The project management (8) discipline focusses on progress monitoring of iterations through metrics, planning iterations and management of risk. The environment discipline (9) aims at activities that facilitate the configuration of a project and project support in general by means of tools and supporting processes. 3.2
RUP Humps
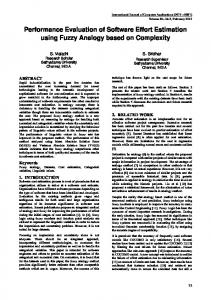
The term ‘RUP hump’ refers to a plot of effort spent over time during a particular discipline. The RUP ‘hump chart’ consists of a collection of humps for all RUP disciplines. Its final form was published by Kruchten in 1998 [11]. An older version was later used by Jacobson, Booch and Rumbaugh [12] and an altered version was used by Royce [13]. The latest version of the RUP chart is depicted in figure 1. Over the years this diagram has become increasingly connected with
Fig. 1. The latest version of the original RUP chart diagram
RUP in such a manner that sometimes it is perceived as if it was intended as a logo for the process. The chart has then since been spread widely over the internet. A misconception about the hump chart is, that it is based on empirical assessment of actual projects rather then on the educated guess of Kruchten. “(. . . )a gentleman from Korea once wrote me to ask for a large original diagram to measure the heights, and “integrate” the area under the humps, to help him do project estimation!” [14] In 2005, Port, Chen and Kruchten [2] tried to empirically validate the RUP chart. They assessed the effort spent in a group of 26 student projects which served as an introduction to software engineering. The projects all ran for 24 weeks, were all executed by graduate-level students at the University of Southern California’s Center for Software Engineering and were structured around the CS577 ModelBased Architecting and Software Engineering (MBASE) guidelines [15]. In their research, Port, Chen and Kruchten create a mapping from the CS577 effort reporting categories to the RUP disciplines and they note that, although CS577 projects are representative of RUP projects, they “do not strictly follow all the RUP guidelines”. Their finding was that “CS577 project generally follow the suggested RUP activity level distributions with remarkably few departures”. An important difference between the former and this investigation is that the effort was already reported in terms of RUP disciplines. An effort mapping was therefore not necessary.
4 4.1
Approach Data Collection
Data was primarily gathered by means of examining data from CA Clarity, Open Workbench, IBM ClearQuest and the log files of automated SLOC counters. This
data was triangulated by looking at various other sources of electronic data. As a first check, project documentation stored in IBM ClearCase systems such as management summaries and memos were consulted. Incomplete or inconsistent data was later compared to the measurement rapports created by the Estimation and Measurement team of which backups are kept on the delivery facility’s own servers. These servers contain information on both current and past projects in which the delivery facility’s services were used. If ambiguities regarding project data still exist after consulting the prescribed administration systems, the informal project documentation and the measurement assessments, the project’s process coach and project manager were consulted. 4.2
Visualising Effort Data
Visual representations were made by automated interpretation of effort information that was entered by project members into Clarity. This information can be opened with Niku Workbench which serves as an offline viewer for Niku Clarity. A custom view for the effort data was created so that the columns task type, task description, effort in person-hours, starting-date and ending-date were listed in that particular order. The ordering of the items was hierarchical so that a project consists of phases, phases consist of iterations, iterations consist of disciplines and disciplines consist of tasks.
5
Findings
Of the projects in our data set, eight projects used Java 2 Enterprise Edition for development, 11 used Microsoft .NET and one developed using C++. The average project spent 11,504 person-hours during a development lead time of 336.1 calendar-days and produced 84,908.53 lines of code which were derived from an initial assessment of 941.47 function points. In 25% of the projects, software development was offshored. The average peak team size during construction phase was 10 FTE and the average project manager experience in the software engineering industry was 15.25 years of which 7.5 were spent in a managerial role. The projects were executed in a CMM level 3 certified development environment. Offshored development processes were handled by a CMM level 5 certified organisation. 5.1
Model and size metrics
The projects in our data set all created use case diagrams in order to create a wide variety of models, most of which were not conform any standard. Valid UML models were very rare. And although model syntax was adhered to rather loosely, the models served a very important role in development as they were used for communication and reference. Table 1 gives an overview of the amount of source lines of code, the function points that were counted and the use-case points [16] that were counted.
Table 1. Size metrics metric
mean
median
min max
sloc 85,500.85 59,030.21 2559 226041 function points 972.67 891.47 104 3762 use case points 54.50 50.76 6 198
5.2
Effort Distribution Validation
The total effort per phase that was measured for projects in our dataset was compared to the total phase-effort reported by 4 other sources: a sample of 600 projects by Reifer [17], an average estimate of effort based on experience of IBM Rational Manager of Methods Kroll [18], a representative sample of 564 projects which were analysed by Quantitative Software Management Inc. [19] and data presented by Boehm, Brown and Fakharzadeh [20]. The data presented by Boehm et al. also contained indications for duration of phase length. These values are added to the table in parentheses. From the comparison (table 2) Table 2. Comparison of total effort per RUP phase RUP phase data set
Reifer Kroll QSM Boehm ea.
inception elaboration construction transition
5% 20% 65 % 10%
7% (15%) 14% (21%) 63% (37%) 16% (27%)
9% 26% 51% 13%
9.9% 16.5% 65.8% 7.9%
5 % (10%) 20% (30%) 65% (50%) 10% (10%)
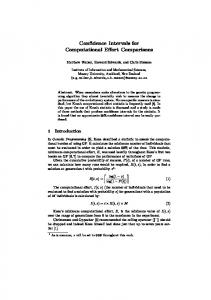
we can see that the effort spent during the inception and construction phases measured in our collected dataset are comparable to the mean of the values that Reifer, Kroll and QSM Inc. found for inception (¯ x = 7.23%) and construction (¯ x = 61.7%) whereas the mean value for the phase elaboration (¯ x = 20.63%) is slightly higher and the mean value for transition (¯ x = 10.23%) is slightly lower. The relatively lower amount of effort spent on the elaboration phase for projects from our data set could indicate that the translation of requirements to a formal design had a lower priority. It is unlikely that the reason for this difference is an aberrant definition the scope of the elaboration phase as the QSM tooling that was used contains industry averages to benchmark project planning. The higher value for transition effort that was found could be explained by a higherthen-average amount of rework or testing. In the many books and articles on RUP, often indications are given about the relative length and resource cost of the four phases. Kruchten presented a diagram [11] in which an indication is given of the relative relationship between the resources and time spent during each of the four RUP phases. The dimensions of the rectangles are very similar to the values Boehm et al. presented. As they do not mention a source for their data in their presentation, it seems plausible that they used Kruchten’s diagram
as a reference. This diagram is depicted in figure 2. A similar plot was made
Fig. 2. Indication of relative resources and time spent per phase
for the data found for the projects in our data set. This plot is shown in figure 3. Comparing the data in table 2, the duration of the inception discipline of
60
construction
effort (%)
50 40 30 20 transition
elaboration
10 inception 0 0
20
40
60
80
100
time (%)
Fig. 3. Relative resources and time spent per phase for projects in our data set
projects in our data set is 50% longer than Boehm et al. presented, while the duration of the elaboration phase is about 30% shorter. This difference could be attributed to the delivery facility’s definitions of where the inception phase ends and the elaboration phase begins. This explanation seems plausible as, for example, some early modelling ventures in the inception phase usually occur. Work on these ventures is usually pursued onwards ‘in the background’ as project initiation formalities take most attention during these early stages. The problem of attributing the effort spent on these modelling activities to the inception or elaboration phase is usually not pressing and as such effort is randomly assigned to one or the other. Interestingly enough, while the amount of effort spent during the construction phase for the projects in our data set is very close to what Boehm et al. presented, projects from our data set seem to use a significantly shorted duration to apply this effort. An explanation for this phenomenon could be that it is customary to increase the size of the development team during the construction phase. Although an increase of developers does not always lead to improvements
in development lead time, the estimation and measurement team of the delivery facility prepares optimal scenarios for construction on forehand in order to quantify the added benefit of each added developer. This value-aware type of planning could have lead to a decreased lead time for the construction phase. The significantly longer duration of the transition discipline could be an indicator of problematic testing and deployment ventures. This could be a direct result the problematic nature of the increased amount of developers that had to cooperate during the construction phase. 5.3
Software Engineering Disciplines
Some projects in our data set use a discipline called quality assurance to write down effort. This discipline is not formally defined by RUP and encompasses activities that are geared towards the increase of process quality. Effort that is spent during this discipline is mostly used to interact with the development facility’s process coach and tool support and assembly line department. Some projects argue that effort spent on these activities should be recorded as effort spent on the disciplines project management and environment. An overview of the relative effort spent on each discipline as a percentage of total effort spent of the projects of our data set is depicted in figure 4. We see that the effort
deployment 2% quality assurance 0% environment 3%
other 9%
analysis and design 11% requirements engineering 8%
change and configuration management 4%
testing 12%
project management 13% implementation 38%
Fig. 4. Effort per discipline as a percentage of total project effort
spent on analysis and design discipline is less then a third of the discipline spent on implementation. Although we could not find comparable data to verify these findings, we would expect the values found for implementation and analysis and design to be at least equal in model-based development.
5.4
RUP Hump Diagram
After averaging the data we obtain from the industrial project, we created a plot of the RUP discipline effort distribution hump chart (see figure 5). In this section we will compare, for each discipline, the graph generated from our projects with that of the RUP hump-figure. One difference that stands out is that the graphs from our projects are much more spiky than the RUP humps.
2.00
requirements
1.50 1.00 0.50
1.40
analysis and design
1.20 1.00 0.80 0.60 0.40 0.20
10.00
implementation
8.00 6.00 4.00 2.00
0.60
configuration and change management
0.50 0.40 0.30 0.20 0.10
5.00
test
4.00 3.00 2.00 1.00
1.00
deployment
0.80 0.60 0.40 0.20
2.50
project management
2.00 1.50 1.00 0.50
0.80 0.70 0.60 0.50 0.40 0.30 0.20 0.10
environment
0.16 0.14 0.12 0.10 0.08 0.06 0.04 0.02
quality assurance
Fig. 5. Redraw of the RUP hump chart based on collected effort data (effort in absolute person hours)
Requirements Discipline To enable visual comparison, figure 6 shows an overlay of the hump drawn for the effort–time relationship by Kruchten and the average hump that was drawn for the projects in our data set. The humps are strikingly similar, from the main, initial, effort hump that gradually builds up from the beginning of the project to the smaller humps that appear later. There
Fig. 6. Comparison of RUP humps from data and from RUP documentation for requirements discipline
are three interesting features of the new hump compared to the prescriptive hump. First, the large effort hump that peaks for only a short period of time at the very first beginning of the time line. Second, the rather coarse fashion in which the effort is distributed between halfway and the end of the project. And third, the surprisingly large effort hump at the end. The requirements peak at the beginning can be explained by the fact that the delivery facility does not do the business modelling for projects. Often, a thorough assessment of the business needs has been made by the consulting division of the IT service delivery company in which the delivery facility resides. Crude requirements have therefore already been made so that the project team that works with the delivery facility can immediately start by reworking the requirements in greater detail. The work done in that first phase serves as input for the first analysis and design effort as can be seen in figure 7. The rather coarse manner in which the requirements effort declines towards the end of the project is a phenomenon that could be explained by the iterative approach of the projects in our data set as a peak in requirements effort is followed by a peak in analysis and design effort. This is most visible towards the end of the project time line. The large effort hump in requirements engineering can most likely be attributed to the relatively large amount of rework that is done at the end of projects. Both the analysis and design and implementation disciplines portray similar patterns of behaviour. Analysis and Design Discipline The two humps for the analysis and design discipline differ mainly in the sense that the bulk of the effort lies more towards the middle than to the centre, as the original RUP hump seems to imply. Furthermore, there seem to be four distinguishable peaks for the new hump whereas the hand-drawn image had only three. Another interesting observation is that a fair amount of effort is done near the end of the project. Apparently, there is less consistency with regard to when analysis and design effort is focussed on mostly during a project. A possible explanation might be project member’s definition of what defines analysis and design effort. Some developers log the time that is spent on preparing to code with techniques such as pseudo coding, as effort spent on analysis and design while others would define such effort as implementation effort. The overlap with the implementation discipline apparently is not that large as the implementation discipline shows a much more defined pattern of behaviour. Another explanation of the seemingly more randomly distributed
Fig. 7. Comparison of RUP humps from data and from RUP documentation for analysis and design discipline
analysis and design effort could be that the analysis and design discipline is a discipline that is very affected by the chosen development strategy. The use of a design varies strongly from method to method. Some project managers use design and modelling for requirement elicitation while other project managers have their team members create parts of the design after implementation. Implementation Discipline The shapes of the implementation humps in Fig. 8 look quite similar. The main difference that can be seen is that the hump drawn by Kruchten has a plateau before it peaks towards the main hump whereas the hump drawn for the projects in the data set shows a steeper slope towards that same main peak. It seems therefore that the effort is mostly spent during that one peak of implementation. The image seems to suggest a waterfall-type of approach. In Fig. 5, the range of the effort of the implementation discipline
Fig. 8. Comparison of RUP humps from data and from RUP documentation for implementation discipline
hump, shows that the peak of the main hump lies at roughly 12 person-hour per time unit. It also illustrates that the effort spent during the smaller slopes before and after the main hump are in the range between approximately two and four person-hours. These values are a multitude of the peak values for most other discipline effort humps. This leads to the observation that in almost any given period, the bulk of the effort is spent on implementation. Test Discipline The fairly substantial effort peak at roughly 30% into the project in the testing effort hump in Fig. 9 could be the result of strongly increased test effort that is required after the first implementation effort in more agile oriented approaches. There also follows a block of increased testing after the main peak of the implementation discipline, but that block is not so high as that of the testing peak at 30% of the project. The concentration of the test effort
Fig. 9. Comparison of RUP humps from data and from RUP documentation for test discipline
seems to be before the beginning of the implementation hump. Looking at the individual projects, we can see that some projects did a lot of testing throughout the project and started relatively early with executing this discipline. More early test peaks in separate projects could be the result of the continuous implementation effort that is sometimes seen to be starting immediately after project initiation and which initially lacks corresponding test effort which then has to be made up for, hence the test peak. One particular project had an unusually long deployment period and therefore, a relatively early test peak. Yet an alternative explanation is that the projects define test soon after requirements have stabilized and hence before the main implementation activities.
6
Conclusion and Future Work
A relatively small portion of total effort is spent during the analysis and design discipline. This implies that the time spend on creating models for implementation was rather limited. This is not as expected in model-based development. Effort seems to be focussed on the implementation discipline. The question is whether it is so that certain modelling tasks are being logged as implementation effort or that modelling is not such a central activity in model-based development. The trends of the RUP Hump chart are surprisingly accurate, although actual project data is more spiky and more spread. This can be partly explained by differences in discipline definition, but also by differing numbers of iterations. The original RUP humps were not drawn with model-based development in mind. The similarity of the humps therefore underlines the similarity between model-based software engineering projects and more traditional approaches.
References 1. Heijstek, W.: Empirical investigations in rational unified process effort distribution in industrial software engineering projects. Master’s thesis, Leiden University Graduate School (2007) 2. Port, D., Chen, Z., Kruchten, P.: An empirical validation of the RUP “hump” diagram. In: ISESE ’05: Proceedings of the 4th International Symposium on Empirical Software Engineering. (2005) 3. Milicic, D., Wohlin, C.: Distribution patterns of effort estimations. euromicro 00 (2004) 422–429
4. Iwata, K., Nakashima, T., Anan, Y., Ishii, N.: Improving accuracy of multiple regression analysis for effort prediction model. icis-comsar 0 (2006) 48–55 5. Baldassarre, M.T., Boffoli, N., Caivano, D., Visaggio, G.: Speed: Software project effort evaluator based on dynamic-calibration. icsm 0 (2006) 272–273 6. Menzies, T., Chen, Z., Hihn, J., Lum, K.: Selecting best practices for effort estimation. IEEE Transactions on Software Engineering 32(11) (2006) 883–895 7. Lopez-Martin, C., Yanez-Marquez, C., Gutierrez-Tornes, A.: A fuzzy logic model based upon reused and new & changed code for software development effort estimation at personal level. 15th International Conference on Computing (CIC’06) 0 (2006) 298–303 8. Braz, M.R., Vergilio, S.R.: Software effort estimation based on use cases. compsac 1 (2006) 221–228 9. Huang, L., Boehm, B.: Determining how much software assurance is enough?: a value-based approach. In: EDSER ’05: Proceedings of the seventh international workshop on Economics-driven software engineering research, New York, NY, USA, ACM Press (2005) 1–5 10. Yiftachel, P., Peled, D., Hadar, I., Goldwasser, D.: Resource allocation among development phases: an economic approach. In: EDSER ’06: Proceedings of the 2006 international workshop on Economics driven software engineering research, New York, NY, USA, ACM Press (2006) 43–48 11. Kruchten, P.: The Rational Unified Process: An Introduction. Addison-Wesley Longman Publishing Co., Inc., Boston, MA, USA (2003) 12. Jacobson, I., Booch, G., Rumbaugh, J.: The unified software development process. Addison-Wesley Longman Publishing Co., Inc., Boston, MA, USA (1999) 13. Royce, W.: Software project management: a unified framework. Addison-Wesley Longman Publishing Co., Inc., Boston, MA, USA (1998) R 14. Kruchten, P.: A brief history of the RUP ’s “hump chart”. Technical report, University of British Columbia (2003) 15. Boehm, B., Abi-Antoun, M., Brown, A., Mehta, N., Port, D.: Guidelines for the life cycle objectives (lco) and the life cycle architecture (lca) deliverables for modelbased architecting and software engineering (mbase)– usc technical report usccse-98-519. Technical report, University of Southern California, Los Angeles, CA, 90089 (February 1999) 16. Carroll, E.R.: Estimating software based on use case points. In: OOPSLA ’05: Companion to the 20th annual ACM SIGPLAN conference on Object-oriented programming, systems, languages, and applications, New York, NY, USA, ACM Press (2005) 257–265 17. Reifer, D.: Industry software cost, quality and productivity benchmarks, software. Tech News 7(2) (July 2004) 18. Kroll, P.: Planning and estimating a RUP project using IBM rational SUMMIT ascendant. Technical report, IBM Developerworks (May 2004) 19. QSM Inc.: The QSM Software Almanac: Application Development Series (IT Metrics Edition) Application Development Data and Research for the Agile Enterprise. Quantitative Software Management Inc., McLean, Virginia, USA (2006) 20. Boehm, B., Brown, A.W., Fakharzadeh, C.: MbaseRUP phase and activity distributions (presentation at cocomo international forum 14. Technical report, University of Southern California, Los Angeles, CA, 90089 (October 1999)