Eigenvector spatial filtering for large data sets: fixed and random effects approaches
Daisuke Murakami Center for Global Environmental Research, National Institute for Environmental Studies, 16-2 Onogawa, Tsukuba, Ibaraki, 305-8506, Japan Email:
[email protected]
Daniel A. Griffith Richardson, Dallas, TX, 75083, USA School of Economic, Political and Policy Sciences, The University of Texas at Dallas Email:
[email protected]
Abstract: Eigenvector spatial filtering (ESF) is a spatial modeling approach, which has been applied in urban and regional studies, ecological studies, and so on. However, it is computationally demanding, and may not be suitable for large data modeling. The objective of this study is developing fast ESF and random effects ESF (RE-ESF), which are capable of handling very large samples. To achieve it, we accelerate
eigen-decomposition and parameter estimation, which make ESF and RE-ESF slow. The former is accelerated by utilizing the Nyström extension, whereas the latter is by small matrix tricks. The resulting fast ESF and fast RE-ESF are compared with non-approximated ESF and RE-ESF in Mote Carlo simulation experiments. The result shows that, while ESF and RE-ESF are slow for several thousand sample size, fast ESF and RE-ESF require only several minutes even for 500,000 sample size. It is also verified that their approximation errors are very small. We subsequently apply fast ESF and RE-ESF approaches to a land price analysis.
Keywords: Eigenvector spatial filtering; computational complexity; large spatial data; dimension reduction; random effects
1. Introduction Large spatial data are rapidly increasing in accordance with the development of technologies relating to sensors (e.g., remote sensors, human sensors) and internet of things (IoT), which enables us to connect and accumulate a wide variety of spatial information (e.g., vehicle location, building energy use) through internetworking. In the era of BigData, fast statistical methods that are applicable for very large spatial samples
are needed by both researchers and practitioners. Statistical methods for spatial data have been developed mainly in geostatsitics (e.g., Cressie, 1993), whose principal interest is spatial interpolation and other data-driven analyses (Anselin, 2010), and spatial econometrics (e.g., LeSage and Pace, 2009), whose major interest is statistical inference in the presence of spatial dependence. Unfortunately, estimation of geostatistic and spatial econometric models typically requires computational complexity of O(n3), which makes them intractable if the sample size n is large. A number of computationally efficient approximations have been developed in these study areas. They include likelihood approximations (e.g., Stein et al., 2004; Griffith, 2004a; LeSage and Pace, 2007; Arbia, 2014), low rank approximations (e.g., Cressie and Johannesson, 2008; Hughes and Haran, 2013; Burden et al., 2015), spatial process approximations (e.g., Banerjee et al., 2008), and Gaussian Markov random field-based approximations (Lindgren et al., 2011) (See Sun et al., 2012 for review). Among them, low rank approximation is a popular one. This approach attempts to describe spatial variation using a linear combination of L basis functions (L 0. This approach is expected to have coefficient estimates that are similar to case (i) as long as L 0: 2-1: The l-th eigenvector, eˆ l , is extracted using Eq. (16), 2-2: If the correlation coefficient between eˆ l and y exceeds a threshold value,
eˆ l X and eˆ l y are calculated. ˆ X [eˆ X, eˆ X, eˆ X] is obtained by combining eˆ X for the L eigenvectors 3: E l 1 l L
selected in step 2-2. Eˆ y [eˆ 1 y , eˆ l y , eˆ L y ] is calculated as well. 4: β and γ, and σ2 are estimated using Eqs. (20) and (21): ˆ Xy βˆ XX XE ˆ ˆ , and y I E γˆ EX
ˆ 2
ε ε , NK
(20)
(21)
where ε'ε = (y Xβ Eˆ γ )(y Xβ Eˆ γ ) can be written using by Eq. (22) as ˆ β XX XE Xy ε ε y y 2[β , γ ] ˆ [β , γ ] , ˆ X E I Ey γ
(22)
The calculation procedure for case (i) is obtained by replacing the step 2-2 with a step
calculating eˆ l X and eˆ l y for all eˆ l . 5: The covariance matrix of the coefficient estimates is calculated as 1
ˆ βˆ XX XE Cov ˆ 2 , ˆ I EX γˆ
(23)
ˆ and γˆ . where the diagonal entries are useful to test the statistical significance of β Because this procedure stores only one eigenvector in each step, the memory consumption is small relative to the usual estimation for ESF. Although step 2-1 still requires storing CnL with size n × L, the burden can be lighten by dividing the n samples into Q subsets, and calculating eigenfunctions for each subset separately. In that case, the required memory space is nq × L for the q-th subset, where nq is the sample size for the q-th subset. This property is useful to parallelize the computation. For case (i), the calculation procedure is the same but without step 2-2. While this procedure is still useful to save memory and parallelize the computation, it can be replaced with the direct application of OLS to Eq. (18), which is usually fast enough. Note that both procedures provide the same result.
4.3. Estimation: fast RE-ESF This study proposes the following estimation procedure for fast RE-ESF: 1: X' X and X'y are calculated.
ˆ [eˆ , eˆ , eˆ ] : 2: The following steps are performed for each eigenvector in E 1 l L
2-1: the l-th eigenvector, eˆ l , is extracted using Eq. (16), 2-2: eˆ l X and eˆ l y are calculated. 3:
ˆ X [eˆ X, eˆ X, eˆ X] E 1 l L
and
ˆ y [eˆ y , eˆ y , eˆ y ] are constructed by E 1 l L
combining eˆ l X and eˆ l y , which are obtained in step 2-2, respectively. 4: θ { , 2 } are numerically estimated by maximizing their profile log-likelihood
ˆ X , and Eˆ y (see, Murakami and Griffith, 2015), Eq. (24), in which X' X, X'y, E already are given in steps 1-3:
ˆV ˆ (θ) N K XX XE 1 loglik R (θ) log ˆ ˆ ˆ 2 2 2 V (θ)EX V (θ) I L
2 (εε uu) , (24) 1 log N K
ˆ ( )1 / 2 , and u ~ N(0L, IL), and ˆ (θ) Λ ˆ (θ )u , V where γ V ˆV ˆ (θ ) β XX Xy XE , u ] , ε ε y y 2[β , u ] ˆ β [ ˆ ˆ (θ)E ˆ X ˆ (θ) 2 u V V V (θ)Ey
(25)
ˆV ˆ (θ) 1 Xy βˆ XX XE ˆ ˆ . ˆ ˆ 2 uˆ V (θ)EX V (θ) I L V (θ)Ey
(26)
5: β and σ2 are estimated by substituting estimated θ { , 2 } into Eqs. (26) and (27)2:
ˆ 2
ˆ (θ)u )( y Xβ Eˆ V ˆ (θ )u ) ( y Xβ Eˆ V , N K
6: The covariance matrix of the coefficient estimates is evaluated as 2
ˆ (θ)uˆ . γ is estimated by γˆ V
(27)
1
ˆV ˆ (θ) βˆ XX XE Var ˆ 2 , ˆ ˆ ˆ 2 uˆ V (θ)EX V (θ) I L
(28)
in which the diagonal entries are available to test the significance of βˆ and uˆ . Interestingly, owning to steps 1-3, n disappears from the profile log-likelihood function, Eq. (24). As a result, the computational complexity for the profile log-likelihood is only O((K + L)3). The computational time for the optimization of θ would be short even if n is large. Furthermore, as with the fast ESF, the large memory consumption by CnL (n × L), which appears in step 2-1, can be reduced by dividing the processing into Q sub-samples. In summary, this section proposes the fast ESF and RE-ESF approaches, which are applicable for large samples. Eigenfunctions in their models are calculated as discussed in Section 3, and their parameter estimations as explained in Section 4.
4. A simulation study This section summarizes results from a Monte Carlo simulation experiment comparing the proposed approaches with standard ESF/RE-ESF approaches, in terms of computational time and parameter estimation accuracy. Section 4.1 outlines the setting of the experiment. Sections 4.2 and 4.3 compare standard ESF-based and RE-ESF-based
specifications,
respectively.
Section
4.4
compares
these
two
specifications, and the linear regression model (LM).
4.1. An outline of the study Simulated data are generated from Eq. (29):
y 0 1 x1 1 x 2 2 Eγ ε , γ ~ N (0, 2 Λ ( )) ,
(29)
ε ~ N (0, 2 I ) ,
where x1 and x2 are vectors of explanatory variables, and β0, β1, and β2 are coefficients. Spatial coordinates of the simulated data are generated from a standard normal distribution3. Matrix X needs to include spatial dependent variations because they can confound with residual spatial dependence, and make parameter estimates unstable (spatial confounder: e.g., Paciorek, 2010; Hughes and Haran, 2013). With this in mind,
x k {x1 , x 2 } is generated with Eq. (30): x k Eγ x ( k ) ε x ( k ) ,
γ ~ N (0, 2( x ( k )) Λ ( ))
(30)
ε x ( k ) ~ N (0, (1 ( x ( k )) ) 2 I )
where σγ(x(k)) is the rate of spatial dependent variation accounting for the total variation in x1 or x2. 3
An assumption of the standard normal distribution is that implicitly fewer samples are in the suburbs of a target area, a likely feature of most regional data.
We assume a sample size of 5,000. E and Λ are given by non-approximated eigenvectors and eigenvalues corresponding to λl > 0, respectively. True regression coefficients are set as follows: α = 1.0, β1 = 2.0, and β2 = –0.5. Their estimates and standard errors are evaluated by varying variance σγ {0,
{0.5,
1.0, 2.0} for Eγ, and σγ(x(k))
0.6} for Eγx(k). Each of the six cases have 200 replications. Another assumption is
that σ2 = 1.0 and α = 1.0. Murakami and Griffith (2015) show that changing σ2 and α has a relatively small impact on the accuracy of regression coefficient estimates. All of our calculations are implemented in a Windows 10 64-bit system with 48 GB of memory, and coded using R (version 3.3.0).
4.2. Comparison among ESF specifications This section compares fast and standard ESF. Section 4.2.1 outlines the ESF models, and Section 4.2.2 discusses comparisons of result.
4.2.1 Models Table 1 summarizes ESF models we compare. A non-approximated ESF is used as a baseline model. Because the basic ESF is very slow and difficult to apply here, ESF-LASSO (Elasso; Seya et al., 2015) is adopted for the baseline. An ESF-LASSO first
selects eigenvectors with the LASSO, and then applies OLS to the ESF model with the selected eigenvectors. Seya et al. (2015) demonstrate that an ESF-LASSO is a good alternative to standard ESF with stepwise eigenvector selection. The other models entail fast approximations. fE100 and fE100* approximate the first 100 eigenfunctions (i.e., L = 100), whereas fE200 and fE200* approximate 200 eigenfunctions. L = 100 and 200 are reasonable because they are small relative to n = 5,000. fE100 and fE200 use all eigenvectors whose approximated eigenvalues are positive. fE100* and fE200* further exclude eigenvectors whose correlation coefficients with y are below 0.01. fE200(lasso) applies the LASSO for the first 200 approximated eigenvectors corresponding to positive eigenvectors.
Table 1: ESF model comparison Model Elasso
Eigenvectors Exact
Candidate eigenvectors λl > 0
fE100
ˆl > 0| l {1,... 100}
fE200
ˆl > 0 | l {1,... 200}
Selection LASSO
All
fE100* fE200* fE200(lasso) 1)
Nyström extension
ˆl > 0 | l {1,... 100} ˆl > 0 | l {1,... 200}
Cor(y, eˆ l ) > 0.011) LASSO
0.2, 0.1, and 0.01 are tested for the threshold. The result shows that 0.01 is the best in
terms of the estimation error of regression coefficients.
4.2.2 Results Because results for β1 and β2 are very similar, we report results for β1 only. The accuracy of estimates is evaluated by the bias and the root mean squared error (RMSE), which are formulated as follows: 1 200 Bias( ˆ1 ) ( ˆ1iter 1 ) , iter 1 200 RMSE ( ˆ1 )
(31)
1 200 ( ˆ1iter 1 ) 2 , iter 1 200
(32)
where iter denotes iteration number, ˆ1iter is the estimate of β1 given in the iter-th iteration. The accuracy of standard error estimate, sd [ ˆ1 ] , is also important to appropriately test the statistical significance of β1. To compare accuracy of sd [ ˆ1 ] , whose true value changes across iterations, the root mean squared percentage error (RMSPE) is evaluated. RMSPE is formulated as 2
RMSPE ( sd [ ˆ1 ])
ˆ iter ] sd [ iter ] 1 200 sd [ 1 1 , iter iter 1 200 sd [ ] 1
(33)
where sd [ ˆ1iter ] is sd [ ˆ1 ] obtained in the iter-th iteration, and sd[β1iter] is the true standard error, which is given based on the true parameter values. Figure 1 summarizes the biases and the RMSEs for β1. Interestingly, Bias ( ˆ1 ) and RMSE ( ˆ1 ) in fE100, fE200, and fE200(lasso) are comparable with the exact model,
Elasso. Furthermore, fE200, and fE200(lasso) also are comparable with Elasso in terms of RMSPE ( sd [ ˆ1 ]) (see Figure 2). Thus, approximation errors in fE200 and fE200(lasso) are
found to be small. Figure 3 compares computation time. Unfortunately, E(lasso) and fE200(lasso) are slow due to their cross-validation step in the LASSO procedure . Furthermore, fE200(lasso) tends to be slower than E(lasso), probably due to the non-orthogonality of the approximated eigenvectors, which increases the number of iterations when undertaking the cross-validation. Among fast ESF specifications, we prefer fE200 that yield fast and accurate approximations of E(lasso), and the standard ESF as well.
Figure 1: Bias and RMSE of β1 (ESF specifications). Note: σγ and σγ(x(k)) intensify the spatial dependence in ε and xk, respectively
Figure 2: RMSPE of sd(β1) (ESF specifications). Note: See Figure 1
Figure 3: Computational time (ESF specifications)
4.3. Comparisons among RE-ESF specifications This section compares fast and standard RE-ESF approaches. Section 4.3.1 outlines the RE-ESF approaches, and Section 4.3.2 discusses the comparison result.
4.3.1. Models Table 2 describes RE-ESF models we compare. They include the basic RE-ESF model, and fast RE-ESF models with 50, 100, and 200 approximated eigenfunctions, respectively.
Table 2: RE-ESF model comparison Model RE
Eigenvectors Exact
Candidate eigenvectors
Selection
λl > 0
ˆl >0 | l {1,... 50}
fRE50 fRE100
Nyström extension
ˆl >0 | l {1,... 100}
All
ˆl >0 | l {1,... 200}
fRE200
4.3.2. Results Following Section 4.2, the bias and the RMSE of ˆ1 , the RMSPE of sd [ ˆ1 ] , and computational time are summarized in Figures 4, 5, and 6, respectively. The bias of
ˆ1 are quite small across cases. Bias ( ˆ1 ) and RMSPE ( sd [ ˆ1 ]) decrease as the number of eigenvectors, L, increases. When L = 200 (i.e., fRE200), the biases and the RMSPEs are essentially the same as for the original RE-ESF model (i.e., RE). This result suggests that approximation of the first 200 eigenvectors is sufficient in a fast RE-ESF specification. Besides, fRE200 is fast enough, as shown in Figure 6. Thus, we recommend fRE200 among the RE-ESF specifications.
Figure 4: The bias and the RMSE of β1 (RE-ESF specifications). Note: See Figure 1
Figure 5: The RMSPE of sd(β1) (RE-ESF specifications). Note: See Figure 1
Figure 6: Computational time (RE-ESF specifications)
4.4. Comparisons across the LM, ESF, and RE-ESF specifications This section compares the LM, three spatial models without eigenvector approximations, including ESF (E), ESF-LASSO (Elasso), and RE-ESF (RE), and two models including eigenvector approximations, fE200 and fRE200, which are selected in Sections 4.2 and 4.3 (see Table 3).
Table 3: A comparison of the LM, ESF, and RE-ESF models Model LM
Eigen-decomposition Candidate eigenvectors N.A.
N.A.
N.A. All
E Elasso
Selection
Exact
λl > 0
Nyström extension
ˆl > 0 | l {1,... 200}
LASSO
RE fE200 fRE200
All
Figures 7, 8, and 9 summarize the bias and the RMSE of ˆ1 , the RMSPE of sd [ ˆ1 ] , and computation time, respectively. As expected, the LM has a large bias and
RMSE of ˆ1 , and RMSPE of sd [ ˆ1 ] . This outcome confirms that ignoring spatial dependence results in an erroneous conclusion. Figure 7 shows that the ESF and RE-ESF specifications furnish ˆ1 with an unbiased and small RMSE irrespective of whether or not approximated eigenvectors are
used. Figure 8 demonstrates that the RMSPE of sd [ ˆ1 ] is relatively large in E and fE200. Still, their RMSPEs are 14% at maximum, whereas 120% in the LM. Besides, the RMSPEs of E and fE200 are less than 6% in 5/6 cases. Thus, E and fE200 effectively reduce errors in sd [ ˆ1 ] . Elasso also has small RMSPEs for sd [ ˆ1 ] whose values are less than 6% in all cases. The RMSPEs in RE and RE200 are below 3% across cases. The RE-ESF specifications tend to outperform the ESF specifications. Figure 9 portrays a comparison of computation time. For reference, the basic ESF with stepwise eigenvector selection is estimated five times, and the average computational time is plotted. As expected, the basic ESF was the slowest due to the eigenvector selection involved. Although E, Elasso, and RE do not require such selection, they are still slow because of the eigen-decomposition involved. In contrast, interestingly, fE200 and fRE200 take only several seconds for 10,000 samples, and several minutes for 500,000 samples. This section reveals that fE200 and fRE200 estimate ESF and RE-ESF models in a very short time and with little approximation error. The next section employs these models in a land price analysis.
Figure 7: The Bias and RMSE of β1 (the LM and selected ESF/RE-ESF specifications). Note: See Figure 1
Figure 8: The RMSPE of sd(β1) (the LM and selected ESF/RE-ESF specifications) Note: See Figure 1
Figure 9: Computational time (selected ESF and RE-ESF specifications)
5. An empirical study This section applies fast ESF and RE-ESF in a hedonic analysis for the Tokyo metropolitan area, Japan. Section 5.1 outlines the hedonic analysis, and Section 5.2 discusses the analysis results.
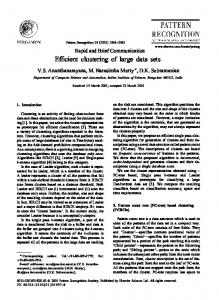
5.1. An outline of the study The response variables are the logarithm of officially assessed residential land prices in 2010 (sample size: 9,215; Figure 10; see Tsutsumi et al., 2011), which are obtained from the National Land Numerical Information download service (NLNI; http://nlftp.mlit.go.jp/ksj-e/index.html). Explanatory variables are as listed in Table 4. We compare the LM, fE200, and fRE200, which were assessed in the simulation analysis. Subsequent results are from the R implementation provided by The Comprehensive R Archive Network (http://cran.r-project.org/), and mappings are from ArcGIS provided by ESRI Inc. (http://www.esri.com/).
Figure 10: 2010 land prices in the Tokyo metropolitan area Table 4: Explanatory variables Variables Description Logarithm of the distance from the nearest railway station to Tokyo Tokyo_dist Station [km] Station_dist Logarithm of the distance to the nearest railway station [km] Urban_dum 1 if the site is in an urban promotion land, and 0 otherwise Transport Trunk transportation land Urban land other than building and Other_land transportation lands2 Paddy Paddy fields Agriculture Other agricultural land in 1 km grids Ratio of Forest Forest Wild Wild land River/lake River and lake Beach Beach Ocean Ocean 1) All of these variables are collected from NLNI. 2) Building land, which is another land use category, is excluded to avoid exact multicollinearity
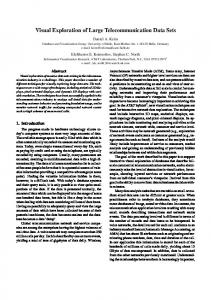
4.2. Results Computational times for the LM, fE200, and fRE200 are 0.02, 2.24, 2.27 seconds, respectively. Figure 11 plots knots used to estimate eigenvectors. The 200 knots should effectively covers the sample space. Figure 12 plots the 1st, 10th, and 100th eigenvectors using the knots. As with the usual Moran’s eigenvectors, the 1st eigenvector has a global map pattern, the 10th has a moderate-scale map pattern, and the 100th has a local map pattern. We verified that our approximation successfully captures spatial characteristics of Moran’s eigenvectors.
Figure 11: 200 knots and 9,215 sample sites
Figure 12: The approximated 1st, 10th, and 100th eigenvectors
Table 5 summarizes estimated parameters. The residual standard error (SE) of fE200 and fRE200, which are 0.198 and 0.196, respectively, are less than half of that for the LM, 0.424. These results demonstrate that more than half of the residual variation in the LM is attributable to spatial dependence, and explained by the Moran’s eigenvectors. Coefficient estimates of the LM have some differences with those of the fE200 and fRE200 models. The LM suggests that all explanatory variables are statistically significant at the 1 % level. However, fE200 and fRE200 based coefficient estimates for Other_land and Beach are not significant, and Wild (–) is significant at the 10% level. Furthermore, the estimated coefficients for land use-related variables in the fE200 and fRE200 models are considerably smaller in absolute value than those for the LM.
Considering the simulation study findings, results for the fE200 and fRE200 models are more reliable. Estimation results of fE200 and fRE200 are quite similar. In these models, Tokyo_dist (–), Station_dist (–), Urban_dum (+), Transport (+), Paddy (–), Agriculture (–), Forest (–), Gold (–), River/lake (–), and Ocean (–) are significant at the 1% level. Based on these results, convenient urban areas are valued more than non-urban areas with an abundance of green and water. The preference for an urban area location might have been a cause of urban sprawl in the Tokyo metropolitan area. Regarding fRE200, the estimated α shows that the underlying spatial dependence is best described by a (doubly-centered) connectivity matrix with degree 1.358.4 In other words, the estimated spatial dependence is more global than the spatial dependence captured by MCM, which implies α = 1. The estimated σγ demonstrates that the standard deviation of the estimated spatial dependence component is 0.188, which is slightly smaller than the residual SE.
Eγ, where γ ~ N(0, σγ2Λα), describes spatial connectivity with Cov[Eγ] = σγ2EΛαE' = σγ2(MCM)α. Hence, the α parameter represents the degree of the latent spatial dependence. 4
Covariate Constant Tokyo_dist Station_dist Urban_dum Transport Other_land Paddy Agriculture Forest Wild Golf River/lake Beach Ocean
Table 2: Parameter estimates LM fE200 Estimate t-value Estimate t-value *** 12.48 527.54 12.09 280.08 *** -0.08 -0.02 0.54 1.25 -0.50 -1.32 -0.76 -0.50 -1.37 -0.32 -0.68 2.22 0.25
-28.60 -79.21 31.26 7.67 -10.37 -35.81 -19.88 -13.22 -9.13 -2.82 -12.19 2.61 2.53
*** *** *** *** *** *** *** *** *** *** *** *** ***
-0.09 -0.02 0.58 0.29 0.02 -0.43 -0.35 -0.42 -0.15 -0.24 -0.32 -0.34 -0.12
-41.63 -15.57 61.70 3.61 0.75 -20.82 -15.86 -18.96 -2.07 -4.45 -11.35 -0.83 -2.45
*** *** *** ***
*** *** *** ** *** ***
***
fRE200 Estimate t-value 12.03 293.93 *** -0.08 -0.01 0.59 0.29 0.02 -0.45 -0.35 -0.41 -0.12 -0.27 -0.33 -0.22 -0.19
-37.57 -15.62 62.81 3.59 0.71 -22.26 -16.11 -18.90 -1.68 -5.08 -11.64 -0.55 -3.96
*** *** *** ***
*** *** *** * *** ***
***
α 1.358 σγ 0.188 Residual SE 0.424 0.198 0.196 1) * ** , , and *** denotes statistical significance level of 10%, 5%, and 1% , respectively.
5. Concluding remarks This study develops the fast ESF and RE-ESF approaches for large spatial data, and reveals that both of these approaches accurately estimate regression coefficients with computational efficiency. These findings are meaningful because computational complexity is one of the biggest drawbacks of ESF (Dormann et al., 2007). The fast ESF model is identical to the LM. But, it does not require the stepwise
eigenvector selection as long as n is large. The fast ESF is easily extended to non-Gaussian models, non-linear models, and many others (see, Griffith 2002; 2004b), by simply introducing the approximated L eigenvectors for explanatory variables, although L = 200 may not be the best even in these models. The fast RE-ESF also can be extended to models whose likelihood function is identical to Eq. (14). Such models include the RE-ESF-based spatially varying coefficient model (Murakami et al., 2017), and the linear RE-ESF model with extra random effects, such as group effects. Bates (2007; 2010) develops a linear approximation for non-Gaussian/non-linear (non-spatial) mixed effects models whose approximated likelihood functions are of the form of Eq. (14). Extension of the fast RE-ESF approach to non-Gaussian and/or non-linear modeling for large data is an important next step. We focus on “large sample size,” which is an aspect of recent spatial data. Yet, recent data, which are typically collected through sensors, also contain observation error, location error, and sampling bias due to concealment processing (see. Arbia et al., 2016). Another important future research effort is to extend the fast ESF and RE-ESF approaches to large and noisy spatial data.
Acknowledgement This work was supported by Grants-in-Aid for Scientific Research from JSPS (Research Project Number: 15H04054).
Reference -
Anselin L (2010) Thirty years of spatial econometrics. Papers in regional science, 89 (1): 3–25.
-
Anselin L and Rey S (1991) Properties of tests for spatial dependence in linear regression models. Geographical Analysis, 23 (2): 112–131.
-
Arbia G (2014) Pairwise likelihood inference for spatial regressions estimated on very large datasets. Spatial Statistics, 7: 21–39.
-
Arbia G, Espa G, and Giuliani D (2016) Dirty spatial econometrics. The Annals of Regional Science, 56 (1): 177–189.
-
Banerjee S, Gelfand AE, Finley AO, and Sang H (2008) Gaussian predictive process models for large spatial data sets. Journal of the Royal Statistical Society: Series B (Statistical Methodology), 70 (4): 825–848.
-
Bates
DM
(2007)
Linear
mixed
model
implementation
in
lme4.
http://download.nextag.com/cran/web/packages/lme4/vignettes/Implementation.pdf.
-
Bates
DM
(2010)
lme4:
Mixed-effects
modeling
with
R.
http://lme4.r-forge.r-project.org/book. -
Borcard D and Legendre P (2002) All-scale spatial analysis of ecological data by means of principal coordinates of neighbor matrices. Ecological Modeling, 153 (1-2): 51–68.
-
Burden S, Cressie N, and Steel DG (2015) The SAR model for very large datasets: a reduced rank approach. Econometrics, 3 (2): 317–338.
-
Chun Y, Griffith DA, Lee M, and Sinha P (2016) Eigenvector selection with stepwise regression techniques to construct eigenvector spatial filters. Journal of Geographical Systems, 18 (1): 67–85.
-
Cressie N (1993) Statistics for spatial data. John Wiley & Sons, New York.
-
Cressie N and Johannesson G (2008) Fixed rank kriging for very large spatial data sets. Journal of the Royal Statistical Society: Series B (Statistical Methodology), 70 (1): 209–226.
-
Dormann CF, McPherson JM, Araujo MB, Bivand R, Bolliger J, Carl G, Davies RG, Hirzel A, Jetz W, Kissling WD, Kühn I, Ohlemüller R, Peres-Neto PR, Reineking B, Schröder B, Schurr FM, and Wilson R (2007) Methods to account for spatial autocorrelation in the analysis of species distributional data: a review. Ecography,
30: 609–628. -
Drineas P and Mahoney MW (2005) On the Nyström method for approximating a gram matrix for improved kernel-based learning. Journal of Machine Learning Research, 6: 2153–2175.
-
Dray S, Legendre P, and Peres–Neto PR (2006) Spatial modelling: a comprehensive framework for principal coordinate analysis of neighbour matrices (PCNM). Ecological Modeling, 196 (3–4): 483–493.
-
Fan J and Lv J (2008) Sure independence screening for ultrahigh dimensional feature space. Journal of the Royal Statistical Society: Series B (Statistical Methodology), 70 (5): 849–911.
-
Griffith DA (2000) Eigenfunction properties and approximations of selected incidence matrices employed in spatial analyses. Linear Algebra and its Applications, 321 (1): 95–112.
-
Griffith DA (2002) A spatial filtering specification of the auto-Poisson model. Statistical Probability Letters, 58 (3): 245–251.
-
Griffith DA (2003) Spatial autocorrelation and spatial filtering: gaining understanding through theory and scientific visualization. Berlin: Springer.
-
Griffith DA (2004a) Faster maximum likelihood estimation of very large spatial
autoregressive models: An extension of the Smirnov–Anselin result. Journal of Statistical Computation and Simulation, 74 (12): 855–866. -
Griffith DA (2004b) A spatial filtering specification for the autologistic model. Environment and Planning A, 36 (10): 1791–1811.
-
Griffith DA (2015) Approximation of Gaussian spatial autoregressive models for massive regular square tessellation data. International Journal of Geographical Information Science, 29 (12): 2143-2173.
-
Griffith DA and Chun Y (2014) Spatial autocorrelation and spatial filtering. In: Fischer MM and Nijkamp P (eds), Handbook of Regional Science. Berlin: Springer, pp.1435–1459.
-
Hughes J and Haran M (2013) Dimension reduction and alleviation of confounding for spatial generalized linear mixed models. Journal of the Royal Statistical Society: Series B (Statistical Methodology), 75 (1): 139–159.
-
LeSage JP and Pace RK (2007) A matrix exponential spatial specification. Journal of Econometrics, 140 (1): 190–214.
-
LeSage JP and Pace RK (2009) Introduction to spatial econometrics. Chapman & Hall/CRC, Boca Raton, Florida.
-
Lindgren F, Rue H, and Lindström J (2011) An explicit link between Gaussian fields
and Gaussian Markov random fields: the stochastic partial differential equation approach. Journal of the Royal Statistical Society: Series B (Statistical Methodology), 73 (4): 423–498. -
Murakami D and Griffith DA (2015) Random effects specifications in eigenvector spatial filtering: a simulation study. Journal of Geographical Systems, 17 (4): 311– 331.
-
Murakami D, Yoshida T, Seya H, Griffith DA, and Yamagata Y (2017) A Moran coefficient-based mixed effects approach to investigate spatially varying relationships. Spatial Statistics: 68–89.
-
Pace RK, LeSage JP, and Zhu J (2013) Interpretation and computation of estimates from regression models using spatial filtering. Spatial Economic Analysis, 8 (3): 352–369.
-
Paciorek CJ (2010) The importance of scale for spatial-confounding bias and precision of spatial regression estimators. Statistical Science: A Review Journal of the Institute of Mathematical Statistics, 25 (1): 107.
-
Seya H, Murakami D, Tsutsumi M, and Yamagata Y (2015) Application of LASSO to the eigenvector selection problem in eigenvector based spatial filtering. Geographical Analysis 47 (3): 284–299.
-
Stein ML, Chi Z, and Welty LJ (2004) Approximating likelihoods for large spatial data sets. Journal of the Royal Statistical Society: Series B (Statistical Methodology), 66 (2): 275–296.
-
Sun Y, Li B, and Genton M (2012) Geostatistics for large datasets. In: Porcu E, Montero JM, and Schlather M (eds.), Space-Time Processes and Challenges Related to Environmental Problems. Berlin: Springer, pp.55–77.
-
Tibshirani R (1996) Regression shrinkage and selection via the lasso. Journal of the Royal Statistical Society. Series B (Methodological), 58 (1): 267–288.
-
Tiefelsdorf M and Griffith DA (2007) Semiparametric filtering of spatial autocorrelation: the eigenvector approach. Environment and Planning A, 39(5): 1193–1221.
-
Thayn JB and Simanis JM (2013) Accounting for spatial autocorrelation in linear regression models using spatial filtering with eigenvectors. Annals of American Association of Geographers, 103 (1):47–66.
-
Tsutsumi M, Shimada A, and Murakami D (2011) Land price maps of Tokyo metropolitan area. Procedia-Social and Behavioral Sciences, 21, 193–202.
-
Zhang K and Kwok JT (2010) Clustered Nyström method for large scale manifold learning and dimension reduction. IEEE Transactions on Neural Networks, 21 (10):
1576–1587.