sphere description for polarization states.4. Our the- ..... We now define a geometric-phase representation of the modulation ..... In fact the quadrature PM data have a notice- ..... oratory, Pasadena, Calif., 2001, http: antares.ligo.caltech.
Electro-optic modulator capable of generating simultaneous amplitude and phase modulations Benedict J. Cusack, Benjamin S. Sheard, Daniel A. Shaddock, Malcolm B. Gray, Ping Koy Lam, and Stan E. Whitcomb
We report on the analysis and prototype characterization of a dual-electrode electro-optic modulator that can generate both amplitude and phase modulations with a selectable relative phase, termed a quadrature variable modulator 共QVM兲. All modulation states can be reached by tuning only the electrical inputs, facilitating real-time tuning, and the device has shown good suppression and stability properties. A mathematical analysis is presented, including the development of a geometric-phase representation for modulation. The experimental characterization of the device shows that relative suppressions of 38, 39, and 30 dB for phase, single sideband, and carrier-suppressed modulations, respectively, can be obtained as well as that the device is well behaved when scanning continuously through the parameter space of modulations. The QVM is compared with existing optical configurations that can produce amplitude and phase-modulation combinations in the context of applications such as the tuning of lock points in optical-locking schemes, single-sideband applications, modulation fast-switching applications, and applications requiring combined modulations. © 2004 Optical Society of America OCIS codes: 230.0230, 230.4110, 230.2090, 230.5440, 230.0250.
1. Introduction
Electro-optic modulators are ubiquitous in modern optics laboratories. Typical devices are designed specifically to produce either amplitude modulation or phase modulation, mounted on laser beams. Many applications use modulation as a means of information transmission or as a means of measurement by exploiting a frequency-dependent dispersion in the subject’s optical system. In these applications a single device capable of producing an arbitrary quadrature of modulation 共amplitude or phase or a combination兲 is invaluable for simplifying the design of experiments, for improving the quality of results, and for diagnostics. Existing optical configurations capable of producWhen this work was done, B. J. Cusack 共benedict.cusack@ anu.edu.au兲, B. S. Sheard, D. A. Shaddock, M. B. Gray, and P. K. Lam were with the Department of Physics and Theoretical Physics, Faculty of Science, The Australian National University, Canberra ACT 0200, Australia. D. Shaddock is now at the Jet Propulsion Laboratory, Pasadena, California 91109. S. E. Whitcomb is at LIGO Laboratory, MS 18-34, California Institute of Technology, Pasadena, California 91125. Received 7 August 2003; revised manuscript received 3 May 2004; accepted 6 May 2004. 0003-6935兾04兾265079-13$15.00兾0 © 2004 Optical Society of America
ing arbitrary combinations of amplitude and phase modulations include an arrangement of a phase modulator and amplitude modulator in series1 and also an arrangement of two-phase modulators used in a Mach–Zehnder interferometric setup, also known as a Mach–Zehnder modulator 共MZM兲. A fiber-optic version of the MZM is commercially available as a one-piece unit.2 MZM devices have been well characterized elsewhere, particularly for fiber-optic applications.3 In this paper we present an experimental characterization of a new dual-electrode electro-optic device called the quadrature variable modulator 共QVM兲. In brief the QVM 关see Fig. 1共a兲兴 consists of two modulating crystals in series, with separate voltage electrodes, with crystal axes aligned perpendicularly to each other. With the appropriate selection of input voltages and the optical polarization state, all possible single-frequency modulation states can be produced. Like the fiber-optic MZM the non-fiber-optic QVM is also a one-piece device 共excepting polarization optics兲 that gives both devices an advantage by reducing the number of degrees of freedom able to drift or creep. In addition we present a geometric-phase theory of electro-optic modulation, called the modulationsphere formulation, in analogy with the Poincare´ sphere description for polarization states.4 Our the10 September 2004 兾 Vol. 43, No. 26 兾 APPLIED OPTICS
5079
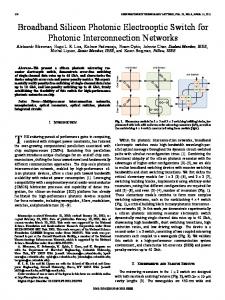
Fig. 1. 共a兲 Schematic of the QVM. Two modulating crystals are positioned in series with the modulating axes at 90°. A laser beam of elliptical polarization passes through each crystal and then through a vertically polarizing element. 共b兲 The subset of input beam polarization states considered here is all states where there is an equal optical-field amplitude in both the left- and the right-diagonal components. The term equals the phase between these components: ⫽ 0 共vertical兲, 兾4, 兾2 共circular兲, 3兾4, and 共horizontal兲. 共c兲 Phasor diagram representing the transfer function given by Eq. 共3兲. If the input electrical signals are represented as rotating phasors 共␦˜ 1 and ␦˜ 2兲, the corresponding phasors that represent the output phase and amplitude modulations 共P˜ and ˜ 兲 are proportional to 共␦˜ 1 ⫹ ␦˜ 2兲 and 共␦˜ 1 ⫺ ␦˜ 2兲, respectively. A
ory provides a complete, thorough, and lucid description of modulation and of the transfer properties of devices such as the QVM. We demonstrate use of the theory by calculating the transfer function 共electrical to optical兲 of the QVM device, both by using optical-field phasors and by using modulation-sphere parameters, and discuss the pros and cons of the two mathematical descriptions. We found that the modulation-sphere representation is particularly useful for gaining visual insight into the dynamics of the QVM. Choosing a figure of merit with which to assess the device is difficult in general and depends on the modulation requirements of the application in question. We address this issue here by identifying two characteristics that might be expected of the modulations states produced by the device: variability and purity. The variable nature of the device is brought out by experiments that require real-time tuning of the modulator across its parameter space. Other experiments rely on precise selection of a small number of operating points where the purity of the modulations produced directly influences the success of the experiment. One anticipated use for the QVM device is in optical-feedback control of the resonance condition of a Fabry–Perot cavity or the fringe condition of a Michelson interferometer. The rf modulation techniques used to lock these devices are Pound–Drever– Hall locking5 and Schnupp modulation locking6 and are both based on the properties of the devices that convert 共injected兲 phase modulation 共PM兲 to ampli5080
APPLIED OPTICS 兾 Vol. 43, No. 26 兾 10 September 2004
tude modulation 共AM兲, which is then demodulated to give an error-signal readout. In both cases the default locking point is at a turning point in the transmitted 共or reflected兲 optical-field intensity; injection into the device of additional AM 共along with the default PM兲 causes the device to lock with an offset relative to the turning point. Moreover the quadrature of AM required for Pound–Drever–Hall locking is orthogonal to that required for Schnupp modulation locking, introducing the possibility of independently tuning two lock points at once in a coupled system. This rf offset-locking application is our case study example to demonstrate the variability property of a prototype QVM; the technique may be useful for future configurations of large-scale gravitational wave detector7 with the feature of facilitating realtime tuning of detector frequency responses.8 –10 The QVM device is capable of generating several pure states that have various applications as well as providing a natural way to test the purity property of the prototype. Single-sideband modulation, for example, requires an equal combination of AM and PM in quadrature. The subject has arisen a number of times in optical-fiber technology, where, for example, a signal that is single sideband modulated is immune to fiber dispersion penalties,2 and the technique has also been suggested for subcarrier-multiplexing systems.11 Single-sideband modulation has been achieved by other means: optically filtering out one sideband,12 cascaded amplitude and phase modulators,1 Mach–Zehnder modulators,3 and more complex arrangements.13,14 Here we demonstrate that the QVM is at least comparable regarding suppression capabilities, achieving a sideband suppression of 39 dB. The QVM can produce PM or AM states with purity limited by the accuracy of polarization optics 共including the birefringent effects of the device itself 兲. Although these states are obtainable with off-the-shelf amplitude or phase modulators, applications in coherent-state quantum cryptography require fast switching between AM and PM for which the QVM is ideal.15 Other applications, including some quantum communication protocols,16,17 also benefit from easy access to a tuned, stationary combination of AM and PM. In both cases it is essential that the modulation device maintain a high level of accuracy in maintaining a selected modulation state. For a concrete example the QVM was able to produce a pure PM state with the residual AM beat suppressed by 38 dB compared with a similar-input-electrical-power pure AM state. Additionally we show that the QVM 共or indeed any two-crystal amplitude modulator兲 can produce a carrier-suppression state, where the output consists of only two modulation sidebands. The QVM was used to generate 30 dB of carrier suppression as measured by a heterodyne beat signal. In Section 2 we give a mathematical description of the QVM in terms of optical-field phasors 共Subsection 2.B兲 and the modulation sphere formulation 共Subsection 2.C兲. The transfer functions from these two
subsections are derived in Appendixes A and B, respectively. In Section 3 we describe a characterization experiment conducted on a prototype QVM with the experimental layout described in Subsection 3.B and the results presented in Subsection 3.C. We summarize the main results of the study in Section 4. 2. Theoretical Model A.
Overview
Before we proceed a simple analogy may help to clarify the inner workings of a QVM device and lend physical insight. A Mach–Zehnder modulator involves splitting a beam into two parts, separately phase modulating each part, then recombining the two parts on a beam splitter. The QVM is physically equivalent to this where the two interferometer paths are collinear but different in polarization. Each QVM crystal modulates one and only one polarization component. We identify the phase between the electric fields in the two polarization states as the interferometric recombination phase. The birefringent wave plates used to create the initial polarization take the place of the input beam splitter, and a polarizing beam splitter facilitates the output recombination. The recombination phase is adjustable 共by modifying the polarization state兲, and one can control the amplitudes and phases of the single-beam phase modulations generated by each of the two crystals. Through manipulation of these input parameters the user has complete control over the interference condition of the two carrier beams and separately over the interference of the lower and the upper sidebands generated by the modulating crystals. This amounts to having complete freedom to choose any modulation state by the appropriate choice of the input parameters. As an example, consider two identically phasemodulated beams where the optical phase of one beam is advanced by 90° and the modulation phase of the other beam is advanced by 90°. The result, on interference of the two beams, is that one resultant sideband is exactly canceled out and the other is additively reinforced, producing a single sideband state. One can intuitively arrive at all the modulation states discussed in this paper by reasoning along these lines. In Subsection 2.B we quantify such reasoning into a mathematical theory of the QVM.
set of polarization states, those in which there is equal power in the polarization components aligned with each modulating crystal axis. 共The unrestricted case is the subject in Appendixes A and B.兲 Equivalently we require that the polarization be elliptical with major and minor axes aligned at 45° to both crystal axes. For concreteness we choose the ellipse axes to be horizontal and vertical and the crystal axes to be left and right diagonal 关as in Fig. 1共a兲兴. We define angle as the phase difference between left-diagonal and right-diagonal electric-field components of the light exiting the crystals 关see Fig. 1共b兲兴. The identity
tan2
冉冊
Ph ⫽ 2 Pv
(1)
follows, where Ph,v are the powers in the horizontal and the vertical polarization components of the input laser beam. We introduce this degree of freedom with the application of gravitational wave-detector locking schemes in mind, where laser power is at a premium: Choosing so that the beam is almost vertically polarized allows us to retain the majority of the input carrier power while retaining full access to all modulation states albeit with reduced amplitude. Note that, in the ideal situation where both crystals have identical refractive indices and lengths, the phase angle 共and hence the polarization state兲 is the same before and after the modulator. However, a real device almost certainly does not have identical crystals so that the relative phase between left- and right-diagonal components may well be changed by the crystals, in which case should describe the polarization state of the light exiting the modulator just before it reaches the linearly polarizing filter. The inputs to the two crystal electrodes are sinusoidal voltages of frequency m; we describe these as complex phasors ␦˜ j ⫽ ␦j exp共ij 兲 共 j ⫽ 1, 2, and i ⫽ 公⫺1兲 so that the single-crystal phase modulations are given by ᑬ兵␦˜ j exp共im t兲其 ⫽ ␦j cos共m t ⫹ j 兲, where ᑬ and ᑣ, respectively, return the real and the imaginary components of a complex variable. We can similarly write the output phase and the amplitude modulations as complex phasors P˜ ⫽ P ˜ ⫽ A exp共iA兲, where the optical-field exp共iP兲 and A amplitude exiting the QVM can be shown to be
B. Transfer Function of the Quadrature Variable Modulator
The QVM 关see Fig. 1共a兲兴 consists of two modulating crystals in series with separate voltage sources and with modulating axes at right angles to each other. It is used by sending a laser beam of elliptical polarization through the device and then through a linearly polarizing filter angled at 45° to the modulating axes of the crystals, which taps off or dumps a proportion of the optical power. The choice of the polarization state of the incident beam has a crucial effect on the transfer characteristics of the system. We restrict ourselves to a sub-
E out ⫽ E in关cos共兾2兲 ⫹ iᑬ兵P˜ exp共i m t兲其 ˜ exp共i m t兲其兴 ⫹ ᑬ兵A ⫽ E in关cos共兾2兲 ⫹ iP cos共 m t ⫹ P兲 ⫹ A cos共 m t ⫹ A兲兴,
(2)
where Ein is the input optical-field amplitude. In Eq. 共2兲 we assumed small single-crystal modulation depths 共␦j ⬍⬍ 1兲, and we factored away the net opticalphase dependence. 10 September 2004 兾 Vol. 43, No. 26 兾 APPLIED OPTICS
5081
The relationship between input and output parameters for the QVM device can be shown to be
冉冊 冉冊
P˜ ⫽
1 cos 共␦˜ 1 ⫹ ␦˜ 2兲, 2 2
˜ ⫽ A
1 sin 共␦˜ 1 ⫺ ␦˜ 2兲. 2 2
(3)
共Proof of this transfer function is outlined in Appendix A.兲 An important observation from Eqs. 共3兲 is that the phases of the AM and the PM track the phases of the sum and the difference, respectively, of the electrical signals. Thus an electronic oscillator for use in demodulation schemes is readily available and can be calibrated once for all operating points. This phasetracking property holds for any choice of ; the effect of a change in polarization ellipticity is to change the overall quantity of PM or AM available 关as well as the overall beam power in Eq. 共2兲兴. Returning briefly to the topic of conserving as much carrier power as possible for applications of the gravitational wave detector, we derive a useful rule of thumb for selecting an appropriate amount of power to tap off. Consider Eq. 共3兲 when we set ␦˜ 1 ⫽ i␦˜ 2 so that ␦˜ 1 ⫹ ␦˜ 2 and ␦˜ 1 ⫺ ␦˜ 2 have the same magnitude. 共We do this in order to focus on the coefficients of the complex ␦˜ j phasors.兲 The ratio of modulation power ˜ 兩2兾兩P˜ 兩2 ⫽ between the AM and PM components is 兩A 2 tan 共兾2兲, and, comparing this with Eq. 共1兲, we have ˜ 兩2 Ph 兩A ⫽ . 兩P˜ 兩 2 P v
(4)
So, the fraction of power tapped off is directly proportional to the fraction of modulation power available to be expressed as AM 共rather than PM兲. Typically then, if 10% of the output power is tapped off and the user wishes to produce alternately a pure PM state and then a pure AM state 共each of the same modulation power兲, the AM state requires nine times the input electrical power in compensation compared with the PM state. It is apparent from Eqs. 共2兲 and 共3兲 that for ⫽ the carrier and the PM contribution vanish, leaving only the AM component. This is the carrier suppression operating point where only two sidebands remain. The modulation ceases to be of the phase or amplitude type because of the absence of a carrier as a phase reference, although the modulation retains its beat phase through the second harmonic in optical power. A rearrangement of Eq. 共2兲 clarifies the nature of single-sideband modulation:
冋
E out ⫽ E in cos共兾2兲 ⫹ ⫹ 5082
1 ˜ ⫹ iP˜ 兲exp共i m t兲 共A 2
册
1 ˜ ⫺ iP˜ 兲* exp共⫺i m t兲 , 共A 2
(5)
APPLIED OPTICS 兾 Vol. 43, No. 26 兾 10 September 2004
where the exp共⫾im t兲 terms represent optical sidebands at ⫾m relative to the optical carrier frequency and an asterisk denotes a complex conjugate. It is ˜ ⫽ ⫾iP˜ eliminates either clear then that choosing A one or the other of the sidebands. In other words, a single-sideband state corresponds to having equal amounts of PM and AM where the two modulations are in quadrature. C.
Modulation Sphere Formulation
We now define a geometric-phase representation of the modulation parameters of the system to further clarify the transfer characteristics of the QVM device. This is analogous to using Stokes parameters and the Poincare´ sphere representation for optical polarization states.4 In this case we transform from the ˜ to a set of 共real兲 coordicomplex quantities P˜ and A nates 共M1, M2, M3兲 in M space through the transformation: M 1 ⫽ P 2 ⫺ A 2, ˜ *其, M 2 ⫽ 2PA cos共 P ⫺ A兲 ⫽ 2ᑬ兵P˜ A ˜ *其. M 3 ⫽ 2PA sin共 P ⫺ A兲 ⫽ 2ᑣ兵P˜ A
(6)
A single point in M space represents a distinct modulation state. In particular the M-space representation suppresses the common 共beat兲 phase of the modulation state; the equations are defined in terms of the relative phase difference between AM and PM contributions. This is a useful simplification in that now every physically distinct modulation corresponds to one point and one only. On the other hand, one cannot use this representation for calculations of demodulation phase tracking when the physical significance of the modulation’s overall phase is renewed by the presence of an external 共electrical兲 phase reference. The three M-space parameters can be interpreted as follows: M1 measures the extent to which one kind of modulation 共AM or PM兲 dominates over the other, M2 measures the degree to which the present PM and AM components are correlated or anticorrelated in phase, and M3 measures the degree to which the present PM and AM components are in quadrature phase to each other and thus also measures the extent to which one frequency sideband has more power than the other. We also define the modulation power by M0 ⫽ P2 ⫹ A2, from whence M02 ⫽ M12 ⫹ M22 ⫹ M32 follows. Therefore a surface of constant M0 is a sphere in the M space 关see Fig. 2共b兲兴. We attach particular significance to modulation states whose M-space coordinates lie on one cardinal axis. The point 共⫹M0, 0, 0兲 represents pure PM, and the point 共⫺M0, 0, 0兲 represents pure AM. The points 共0, ⫾M0, 0兲 represent correlated and anticorrelated PM and AM, and 共0, 0, ⫾M0兲 represent upper and lower single-sideband states. Details of these states are summarized in Table 1. These states, particularly those on the M1 and the M3 axes, involve the suppression of a particular signal and so provide a natural way to test the precision of a real device.
Now we can rewrite the QVM transfer function, Eq. 共3兲, in terms of M-space and Q-space parameters: M0 ⫽
1 关Q 0 ⫹ Q 2 cos共兲兴, 4
M1 ⫽
1 关Q 0 cos共兲 ⫹ Q 2兴, 4
M2 ⫽
1 sin共兲Q 1, 4
M3 ⫽ ⫺
Fig. 2. 共a兲 Q-space diagram. Axis labels are visual reminders of relative amplitudes and phases of input electrical signals 共try to visualize the display of a cathode-ray oscilloscope run in the X–Y mode with ␦1 and ␦2 as the X and Y inputs兲. 共b兲 M-space diagram. Axis labels are optical amplitude phasors whose end points oscillate at the modulation frequency. For ⫽ 兾2 there is a graphic transfer correspondence between 共a兲 and 共b兲 according to Eqs. 共9兲. 共c兲 In general the transfer function of the QVM, Eqs. 共8兲, takes a sphere of constant input power in Q space and returns an ellipse in M space. A cross section is shown for the selection of values for . SSB, single sideband.
Before we proceed it is convenient to define an analogous Q-space representation 共Q1, Q2, Q3兲 for the electrical input parameters by Q 1 ⫽ ␦ 12 ⫺ ␦ 22, Q 2 ⫽ 2␦ 1␦ 2 cos共 1 ⫺ 2兲 ⫽ 2ᑬ兵␦˜ 1␦˜ 2*其, Q 3 ⫽ 2␦ 1␦ 2 sin共 1 ⫺ 2兲 ⫽ 2ᑣ兵␦˜ 1␦˜ 2*其,
(7)
where Q0 ⫽ ␦12 ⫹ ␦22 ⫽ 共Q12 ⫹ Q22 ⫹ Q32兲1兾2 is the sum input electrical power. Physical interpretations for these parameters correspond with the M-space equivalents 关see Fig. 2共a兲 for a diagrammatic description兴.
1 sin共兲Q 3. 4
(8)
共Proof of this transfer function is outlined in Appendix B.兲 Since the modulation power M0 depends partly on Q2 共hence on the detail of the input signals, not just the overall input power Q0兲, a sphere of constant electrical input power in Q space does not, in general map to a sphere of constant modulation power in M space. In fact Eq. 共8兲 describes a transfer function from a sphere in Q space to an ellipsoid in M space. It can be shown that the ellipsoid is centered at 共M1, M2, M3兲 ⫽ 关Q0 cos共兲兾4, 0, 0兴 and has radii 关Q0兾4, Q0 sin共兲兾4, Q0 sin共兲兾4兴 and an eccentricity of ⑀ ⫽ 兩cos共兲兩. The ellipse is always prolate with a long axis aligned with the M1 axis and always has one focus at the M-space origin. The orthogonality of the axes is preserved in the transformation, which consists only of a translation 共the ellipsoid is not origin centered兲 and a dilation 共the ellipsoid is squashed in the M2 and M3 directions兲. The center point and proportions of the ellipsoid are parameterized by the input light’s polarization parameter 关Fig. 2共c兲兴. A special case occurs for ⫽ 兾2 共circular input polarization兲 when Eq. 共8兲 reduces to M0 ⫽
1 Q 0, 4
M1 ⫽
1 Q 2, 4
M2 ⫽
1 Q 1, 4
M3 ⫽ ⫺
1 Q 3. 4
(9)
Here a sphere in the Q space maps to a sphere in the M space. This case is particularly instructive as Figs. 2共a兲 and 2共b兲 take on new significance; there is now a direct graphical correspondence between the two spheres, in accordance with Eq. 共9兲. So, an example of these spheres as a visual tool is that we can see at a glance that the PM operating point is obtained by running both crystals with equal in-phase electrical inputs or that a single sideband is obtained by running both crystals with equal inputs inquadrature. 3. Experimental Demonstration A.
Approach
The following characterization experiment was designed to measure the amplitude and phase response 10 September 2004 兾 Vol. 43, No. 26 兾 APPLIED OPTICS
5083
Table 1. Details of Significant Operating Points
Operating Point
Modulations
Electrical Inputs
M Space
Pure PM
˜ ⫽0 P˜ ⫽ 0, A
␦˜ 1 ⫽ ␦˜ 2
共⫹M0, 0, 0兲
Pure AM
˜ ⫽0 P˜ ⫽ 0, A
␦˜ 1 ⫽ ␦˜ 2 exp共i兲
共⫺M0, 0, 0兲
Correlated PM and AM
˜ P˜ ⫽ A
␦˜ 1 cos共兲 ⫽ ␦˜ 2 exp共i兲关1 ⫹ sin共兲兴
共0, ⫹M0, 0兲
Anticorrelated PM and AM
˜ exp共i兲 P˜ ⫽ A
␦˜ 1关1 ⫹ sin共兲兴 ⫽ ␦˜ 2 exp共i兲cos共兲
共0, ⫺M0, 0兲
Single sideband ⫺m
˜ exp共i兾2兲 P˜ ⫽ A
␦˜ 1 ⫽ ␦˜ 2 exp关i共 ⫹ 兲兴
共0, 0, ⫹M0兲
Single sideband ⫹m
˜ exp共⫺i兾2兲 P˜ ⫽ A
␦˜ 1 ⫽ ␦˜ 2 exp关i共⫺兲兴
共0, 0, ⫺M0兲
Q Space
冋 冋 冋 冋 冋 冋
0,
4M 0 ,0 cos共兲 ⫹ 1
0,
4M 0 ,0 cos共兲 ⫺ 1
册 册
4M 0 4M 0 cos共兲 ,⫺ ,0 sin共兲 sin2共兲 ⫺
册
册 册
4M 0 cos共兲 4M 0 ,⫺ ,0 sin共兲 sin2共兲
0, ⫺
4M 0 4M 0 cos共兲 ,⫺ sin2共兲 sin共兲
0, ⫺
4M 0 cos共兲 4M 0 , sin2共兲 sin共兲
册
Note: The modulation parameters, expressed in terms of both phasors and M-space parameters, are given for each point. The electrical inputs necessary to produce these operating points are also given 共both in terms of phasors and Q-space parameters兲, and these inputs vary with the polarization parameter .
of a prototype QVM device with respect to both the AM and the PM output states. In particular, we focus here on two kinds of measurement, those that measure the variability of the QVM device and those that measure the purity of the modulations that the QVM device can produce. By variability we refer to the capability of the QVM prototype to tune around the parameter space of the modulations or dial up a particular modulation in a predictable, theorymatching fashion and with a reasonable level of precision. By purity we mean the QVM prototype’s ability to accurately attain a particular modulation 共especially those that involve suppression of a frequency line兲 and to hold that modulation indefinitely without drifting. B.
Experimental Layout
The QVM prototype itself was built by modifying a commercial electro-optic amplitude modulator. The type of amplitude modulator that we used 共a New Focus broadband amplitude modulator, Model 4104兲 is almost identical to the QVM in Fig. 1共a兲 except that the two electrodes are hard-wired together with antisymmetric polarity, giving only one input. The prototype QVM was built by separating these two electrodes so that independent voltages could be applied to the two crystals. The experiment is shown in Fig. 3. The polarization of a laser source was prepared with a half- and quarter-wave plate in series, and the laser source was passed through the QVM, which we operated at m兾 2 ⫽ 5 MHz. A polarizing beam splitter completed the process; the vertically polarized output carried the modulation described in the theory above. The horizontally polarized output was used to keep track of the polarization state, hence to measure the value of . The polarization state used corresponded to ⫽ 75° 共near-circular polarization with the vertical component stronger兲 for experimental convenience. 5084
Regarding the modulator itself, the original New Focus amplitude modulator 共Model 4104兲 carried the following specification: max V ⫽ 300 V @ 1.06 m. Although we did not explicitly measure V for the prototype QVM 共after the modification from the original AM device兲, we point out that it should still be of the same order of magnitude. Therefore, because the input voltages did not exceed 10 V, the following results are in the small modulation depth limit as described in Subsection 2.B. A heterodyne detection scheme formed part of the measurement apparatus, where a shunted beam was frequency shifted by h兾2 ⫽ 80 MHz with an acousto-optic modulator, AOM. If this heterodyne oscillator beam is represented by Ehet ⫽ ␥Ein exp共ih t兲
APPLIED OPTICS 兾 Vol. 43, No. 26 兾 10 September 2004
Fig. 3. Heterodyne characterization experiment layout of the QVM. A spectrum analyzer provides frequency line data 共of the direct AM beat and heterodyned copies of sidebands兲 for establishing the purity of the QVM, while two parallel double-demodulation circuits provide the complete set of modulation measurables for testing the variability of the QVM: BS, dielectric beam splitter; 兾2, half-wave plate; 兾4, quarter-wave plate; PBS, polarizing beam splitter; PZT, piezoelectric actuator; AOM, acousto-optic modulator; FB, feedback servo and HV amp; 90°, electronic phase shifter; DC兾HF, bias-T; SA, spectrum analyzer. The 5-MHz signal generators are electronically phase-locked.
with ␥ ⬍⬍ 1 and is interfered with the modulated beam from Eq. 共2兲, the detected power is given by P det ⫽ E in2关P dc ⫹ P m ⫹ P h ⫹ P h⫺m ⫹ P h⫹m兴, P dc ⫽ cos2
冉冊 冉冊 冉冊 , 2
P m ⫽ 2 cos
˜ exp共i m t兲其, ᑬ兵A 2
ᑬ兵␥ exp共i h t兲其, 2 ˜ ⫹ iP˜ 兲* exp关i共 h ⫺ m兲t兴其, ⫽ 2ᑬ兵␥共A
P h ⫽ 2 cos P h⫺m
˜ ⫺ iP˜ 兲exp关i共 h ⫹ m兲t兴其, P h⫹m ⫽ 2ᑬ兵␥共A
(10)
where the power components are split according to their respective frequencies. Pm represents the measurable beat because of the presence of AM, Ph is the beat between the carrier and the heterodyne oscillator, and Ph⫺m and Ph⫹m represent heterodyned copies of the two modulation sidebands. A spectrum analyzer was used to monitor the strength of these frequency lines. Use of the spectrum analyzer facilitated assessment of the purity of states produced by the QVM prototype by the observation of operating points that involved suppression of one of these frequency lines. An alternative set of measurables was obtained by electronically mixing the heterodyne frequencies down to baseband by a double-demodulation scheme. This gave a dc readout of the PM and AM amplitudes at a selected beat phase. A complete description of the modulation strengths and quadratures was obtained in this way and was hence useful for characterizing the variability of the QVM prototype. The method of signal extraction by double demodulation is best understood by reworking the last two components of Eq. 共10兲 to
冉冊
2 ⫻ 关ᑬ兵P˜ exp共i m t兲其ᑣ兵␥ exp共i h t兲其 ˜ exp共i m t兲其ᑬ兵␥ exp共i h t兲其兴. ⫹ ᑬ兵A
P h⫺m ⫹ P h⫹m ⫽ 2 cos
(11) This signal is mixed down to the base band by demodulating at h兾2 ⫽ 80 MHz and then m兾2 ⫽ 5 MHz in series. The output of a demodulation is sensitive to the relative phases of the signals being mixed: If the signals are exactly in-phase or out-ofphase, the output is maximally positive or negative; if they are in-quadrature, the output is zero. Equation 共11兲 shows that the h oscillator components of the AM and PM portions are orthogonal 共one is the real component, the other is imaginary兲 so that the appropriate choice of electrical oscillator phase can force the readout of PM only, or AM only, or some linear combination of the two. Similarly, the demodulation quadrature of the m stage determines the beat phase that the output signal is projected onto.
The output dc component of the first stage of demodulation 共extracted with a bias-T component兲 was used as an error signal for locking the optical recombination phase of the heterodyne. This error signal varies sinusoidally with respect to the optical recombination phase, with a zero crossing where the optical heterodyne beat Ph and the electronic demodulation oscillator are in-quadrature. In other words, the feedback loop locks out the heterodyne beat. Comparing Eqs. 共10兲 and 共11兲, we see that the AM term has the same phase as the Ph term 关that is, they both contain the terms ᑬ兵␥ exp共ih t兲其兴, so that the feedback loop also locks out the AM component, leaving only the PM component 关which has a ᑣ兵␥ exp共ih t兲其 term兴. This is an important part of the process because, without a locking loop, the demodulation phase of the circuit would be uncharacterized and would also be free to drift. In the experiment, two separate doubledemodulation schemes were used to measure PM and AM simultaneously; the h signal was split with a 90° electronic splitter to ensure that the two doubledemodulation circuits scanned orthogonal modulations. Hence the heterodyne locking loop connected by using a signal from one double-demodulation circuit ensured that that particular circuit was sensitive to PM and that the other was sensitive to AM. Regarding the second stage of demodulation, electronically phase locking the signal generators was sufficient to time stabilize the demodulation quadrature, and a known modulation was used for calibration. C.
Results
Figure 4 shows spectrum analyzer traces for four operating points to demonstrate the suppression capabilities of the device. The suppression factors are 34.9 and 39.5 dB for the left- and right-hand sidebands 关Figs. 4共a兲 and 4共b兲兴. In Fig. 4 the frequency lines are suppressed down to the electronic noise floor, so that higher suppression factors may be possible. A more detailed trace exhibiting sideband suppression is given in Fig. 5 with a 35.2-dB relative suppression recorded. We measured around 38-dB suppression of the AM beat compared with a similar-input-power pure-AM state 关Fig. 4共c兲兴. In Fig. 4共c兲 and the other diagrams in Fig. 4 we show max-hold data, demonstrating that the device is highly stable, maintaining these operating points without significant drift on the time scale of hours. In Fig. 4共d兲 the carrier is suppressed by selecting the AM operating point and setting ⫽ 共horizontal polarization兲. The heterodyne measurement of the carrier is down by around 30 dB, from which we can infer that the carrier power 共which goes as the square of the heterodyne measurement兲 is down by 60 dB. This heterodyne measurement is further supported by observing that the first and the second harmonics of the direct AM beat are approximately equal, which is consistent with the fact that the carrier 共as mea10 September 2004 兾 Vol. 43, No. 26 兾 APPLIED OPTICS
5085
Fig. 4. Spectrum analyzer traces of heterodyne measurements of four pure operating points. Frequencies of interest are 5 MHz 共direct AM beat兲, 80 MHz 共heterodyne-carrier beat兲, and 75 and 85 MHz 共heterodyne-sideband beats兲: solid curve, data averaged over a few seconds; dashed curve, max-hold data acquired over approximately 1 h; arrows, curves that have been suppressed. 共a兲 Upper single sideband 共lower sideband suppressed by 34.9 dB兲, 共b兲 lower single sideband 共upper sideband suppressed by 39.5 dB兲, 共c兲 pure PM 共AM beat suppressed by around 38 dB兲, 共d兲 carrier suppression 共heterodyne beat suppressed by around 30 dB兲.
sured by the heterodyne兲 is approximately 6 dB weaker than the sidebands. We were especially careful to validate this heterodyne measurement of the carrier, because the directly detected power dropped by only 40 dB. The reason for this is that the majority of the residual carrier power was now in a higher-order, odd spatial mode 共easily verified by looking at the intensity profile of the beam兲, which did not interfere efficiently with the heterodyne oscillator beam. The higherorder modes were thought to result from a spatially nonuniform polarization of the light exiting the QVM, which, when subsequently passed through a polarizing beam splitter, produced modes reflecting the symmetry of the modulator. As such, for applications in which spatial-mode interference is important the em-
Fig. 5. More detailed spectrum analyzer trace of sideband suppression with a 35.2-dB difference between sidebands. Frequency lines at 72.1, 86.1, and 87.7 MHz are from radio interference with the electronic equipment. 5086
APPLIED OPTICS 兾 Vol. 43, No. 26 兾 10 September 2004
Fig. 6. 共a兲 Modulation ellipse showing the trajectory of the measurement sweep through parameter space where the phase difference between the electrical signals, ⫽ 1 ⫺ 2, is varied through 360°. 关The ellipse has an 共exaggerated兲 of ⬇53°.兴 共b兲 Doubledemodulation measurements of PM 共squares and diamonds, inphase and quadrature components, respectively兲 and AM 共plusses and crosses, in-phase and quadrature components, respectively兲 with corresponding theoretical predictions 共solid curves兲. The majority of modulation present is either PM or quadrature AM as predicted. This plot corresponds to ⬇ 75°, a value derived by measuring, from corresponding spectrum-analyzer data, the phase at which the single-sideband operating points occur. When we use a result from Table 1, phase between the pure AM operating point and either of the single-sideband operating points is precisely equal to .
ployment of a mode-cleaner cavity with free spectral range equal to the modulation frequency 共or one of its integer divisors兲 should solve the problem. In an attempt to confirm the variability of the QVM prototype, we endeavored to map significant paths in the modulation parameter space. Figures 6 and 7 show the result of sweeping through M space in two cardinal directions, varying the relative phase between the two 共constant amplitude兲 electrical signals and varying the amplitude of one electrical signal while keeping the other signal amplitude, and the relative phase, constant. For matters of calibration the QVM was initially set to the PM operating point 共this initial state was used as the reference in labeling in-phase and quadrature components兲, and the relative gains and phases of the two doubledemodulation circuits were measured and factored out through correspondence with spectrum-analyzer data. The input polarization was set to be elliptical with a vertical component slightly larger than the horizontal component. The results show that changing the phase between the two electrical signals
Fig. 7. 共a兲 Modulation ellipse showing the trajectory of the measurement sweep through parameter space, where the strength of one electrical signal ␦2 is varied from ⫹5.1 to ⫺5.1 V. The sweep involves varying the overall input electrical power, so that the modulation trajectory does not stay on the ellipse surface and instead traces out a parabolic curve. 关The ellipse has an 共exaggerated兲 of ⬇53°.兴 共b兲 Double-demodulation measurements of PM 共squares and diamonds, in-phase and quadrature components, respectively兲 and AM 共plusses and crosses, in-phase and quadrature components, respectively兲 with corresponding theoretical predictions 共solid lines兲. There is diverging agreement in the PM that may be caused by imperfectly matched electrical impedances for the two crystals. As in Fig. 6 the location of the correlated PM and AM point is shifted toward the pure AM point by ⬃0.7 V out of 5.1 V, and, referring to Table 1, this corresponds to a value of ⬇ 75°.
Fig. 8. 共a兲 Modulation ellipse showing short-range trajectories designed to map the local region near the PM operating point. The electrical parameters, ⫽ 1 ⫺ 2 and ␦2, were varied to achieve these results with units worth 5° and 0.44 V, respectively. 共b兲, 共c兲, 共d兲, 共e兲 Double-demodulation measurements of PM 共squares, diamonds, in-phase and quadrature components, respectively兲 and AM 共plusses and crosses, in-phase and quadrature components, respectively兲 with corresponding theoretical predictions 共solid lines兲. Parameters varied were 共b兲 , 共c兲 ␦2, 共d兲 and ␦2 together with the same polarity, and 共e兲 and ␦2 together with opposite polarities. Note: the in-phase PM data points 共squares兲 have been scaled down by a factor of 10 to fit in the diagram. Also the systematic error in the quadrature PM data is probably due to an electronic phase drift between signal generators, causing a small amount of in-phase PM data 共which is an order of magnitude stronger兲 to couple across.
produces AM in-quadrature to the original PM, whereas changing the amplitude of one electrical signal generates AM in-phase with the original PM. The data points are generally in good agreement with the theoretical predictions. Some small systematic errors are apparent and are thought to be associated with unmatched electrical and optical impedances between the two crystals and possibly to do with slightly unmatched optical-power levels probing each crystal 共i.e., a violation of our original assumption regarding polarization states兲. Overall the device is shown to be highly predictable and that one can dial-up a particular modulation state on call, having calibrated the device initially. It is instructive to note that the cardinal operating points are not evenly spaced when sweeping across the parameter space. In particular, we see that the two single-sideband operating points are shifted toward the AM operating point in Fig. 6, and the correlated PM and AM operating point is similarly shifted in Fig. 7, relative to the perpendicular. This is a product of the noncircular polarization of light
input into the modulator device and can be understood by reviewing the modulation ellipses in the two figures; the M2 and M3 axes intercept the ellipse at points that are closer to the AM operating point than the PM. In fact this provides us with a means of calibration of the relative transfer-function amplitudes of the PM and AM double-demodulation circuits; they are set when 共in Fig. 6兲 the PM and AM components are assured to be equal at the phase where the single sideband is known to occur 共information that is obtained by comparison with spectrum-analyzer data兲. Also, by using the identities in Table 1, we can derive a value of the polarization parameter: ⬇ 75°. Figure 8 shows scans of the local region near the PM operating point, with deviations in four directions. These data were taken with an offset-locking application in mind, as discussed above. The inphase PM component 共in-phase by definition兲 is by far the dominant signal and has been scaled down by a factor of 10 to fit in the graphs. As expected the QVM device can produce AM that is in-phase with 10 September 2004 兾 Vol. 43, No. 26 兾 APPLIED OPTICS
5087
the present PM, or AM that is in quadrature with the present PM, by changing the relative electrical signal amplitudes or phases, respectively. In addition both of these parameters can be varied together or oppositely to give independent control over the two quadratures of AM resulting. Note that in the case of producing both in-phase and quadrature AM, a small component of quadrature PM appears. 共In other words the phase of the PM changes relative to that of the pure PM point used for the initial calibration.兲 In fact the quadrature PM data have a noticeably larger systematic error than the other three signals. This is most likely due to pollution from its in-phase counterpart, caused by the demodulation oscillator’s phase drifting marginally. 共This was observed to happen in spite of the electronic phase locking between signal generators.兲 A number of experimental difficulties deserve mention. As described in the context of the carriersuppression results the QVM produced a spatially varying polarization state, which produced a small percentage of higher-order spatial modes when a polarization component 共of the order of 1% of the overall power兲 was selected out. This interfered with our ability to directly measure the polarization, which we did by measuring the overall detected power while rotating a diagnostic half-wave plate placed before the polarizing beam splitter, PBS. In this way we measured a value of ⬇ 70° for the results in Figs. 6– 8, compared with ⬇ 75° measured by inference from spectrum-analyzer data. We assign a reasonably large error to the direct measurement value because of the presence of the higher-order spatial modes, and we favor measuring by inference from the data. The overall optical path lengths of the modulating crystals were found to change significantly as they warmed up after the laser was started. The dualcrystal design of the device goes a long way toward minimizing this problem, and we have seen that the device is stable once it has warmed up. However, long-term drift of the crystal lengths is possible, having a direct effect on the polarization state leaving the device. We propose that, in circumstances in which this becomes a problem, a feedback loop be employed to lock the polarization state. A possible scheme would see the power level out of one PBS port monitored and used as a feedback signal 共minus an offset equal to the desired power level兲 to the dc optical path length of one of the crystals, thus compensating for a mechanical path-length change by feeding back to the refractive index. Finally the electrical impedances of the two crystals were not well matched for two reasons: the electronics were not identical, and the crystals themselves had good and bad spots that generated varying levels of modulation. In general terms, careful alignment can largely overcome this problem and return the two crystals to an equal footing. The differing electrical impedances complicate the issue of generating a local oscillator with the phase-tracking property discussed above, since voltages V1,2 and modulation depths ␦1,2 are not then related by the same factor. We submit 5088
APPLIED OPTICS 兾 Vol. 43, No. 26 兾 10 September 2004
that the device tested here is merely a prototype and that careful management suffices to deal with these issues as the need arises. 4. Conclusion
We have presented a thorough investigation, both theoretical and experimental, of a prototype quadrature variable modulator 共QVM兲. The electrical-tooptical transfer function of the device was derived, both in terms of electrical and optical phasor notation, from using a geometric-phase modulation sphere representation. Both pictures were shown to have merit, and a set of cardinal modulations was described in each notation. We reported on an experiment to characterize the prototype QVM, which involved using dual double-demodulation circuits to measure both AM and PM components simultaneously. Data sets were obtained and analyzed to illustrate the variability and purity characteristics of the device; the device was shown to be highly predictable and capable of highly pure states. Applications for the QVM were discussed. Appendix A: Derivation of the Transfer Function of the Quadrature Variable Modulator
An outline of the derivation of Eq. 共3兲 follows. First, we find the 共more general兲 transfer function of the QVM when we allow the input beam to have any polarization. At the end we simplify to the subcase described above. The input beam’s polarization is characterized by two electric-field phasor components, L˜ ⫽ L exp共iL兲 ˜ ⫽ R exp共iR兲, as defined in a set of left- and and R right-diagonal spatial coordinate axes 共with unit vecˆ , respectively兲. The electric field exiting tors Lˆ and R the QVM can be written as a vector 共to include polarization information兲 as EexitingQVM ⫽ 兵L˜ exp关iᑬ兵␦ 1 exp共i m t兲其兴Lˆ ˆ 其exp共it兲. ˜ exp关iᑬ兵␦˜ 2 exp共i m t兲其兴R ⫹R (A1) 关From hereon we suppress the exp共it兲 term for brevity.兴 When the vertically aligned linear polarizer 关equivalent to taking a dot product with the vector 共Lˆ ˆ 兲兾公2兴 is passed through and the complex exponen⫹R tials to first order 共hence assuming 兩␦˜ 1,2兩 ⬍⬍ 1兲 are expanded, the vertical electric-field amplitude becomes 1
E out ⫽
冑2
兵L˜ 关1 ⫹ iᑬ兵␦˜ 1 exp共i m t兲其兴
˜ 关1 ⫹ iᑬ兵␦˜ 2 exp共i m t兲其兴其. ⫹R
(A2)
Next we collect dc and oscillating terms and factor out the overall optical phase: E out ⫽
˜ L˜ ⫹ R
冑2
⫹
冋
1⫹
˜ *兲 i共L 2 ⫹ L˜ R ᑬ兵␦˜ 1 exp共i m t兲其 ˜ ˜ 兩L ⫹ R 兩 2
册
˜ L˜ * ⫹ R 2兲 i共R ᑬ兵␦˜ 2 exp共i m t兲其 . ˜ 兩2 兩L˜ ⫹ R
(A3)
Now we work to separate real and imaginary components for the oscillating terms: E out ⫽
˜ L˜ ⫹ R
冑2
冋
再 冋 1⫹ᑬ
˜ L˜ *其共␦˜ 1 ⫺ ␦˜ 2兲 ᑣ兵R exp共i m t兲 ˜ 兩2 兩L˜ ⫹ R
册
power in the two polarization axes兲, and define ⫽ R ⫺ L as the phase between the two polarization components, the equations reduce to
冉冊
E out ⫽ E in cos
˜ L˜ *其共␦˜ 1 ⫹ ␦˜ 2兲 ⫹ L 2␦˜ 1 ⫹ R 2␦˜ 2兲 ᑬ兵R ⫹ iᑬ ˜ 兩2 兩L˜ ⫹ R ⫻ exp共i m t兲
册冎
.
⫹ iᑬ兵P˜ exp共i m t兲其, (A4)
These real and imaginary oscillating terms correspond to AM and PM, respectively, so we parameterize by E out ⫽
˜兩 兩L˜ ⫹ R
冑2
˜ exp共i m t兲其 ⫹ iᑬ兵P˜ exp共i m t兲其 ⫹ ᑬ兵A (A5)
˜ L˜ *其共␦˜ 1 ⫹ ␦˜ 2兲 ⫹ L 2␦˜ 1 ⫹ R 2␦˜ 2兲 ᑬ兵R , 冑2兩L˜ ⫹ R˜ 兩
˜ ⫽ A
˜ L˜ *其共␦˜ 1 ⫺ ␦˜ 2兲 ᑣ兵R , 冑2兩L˜ ⫹ R˜ 兩
(A6)
where the net optical phase shift has been discarded. Equations 共A5兲 and 共A6兲 constitute the general QVM transfer function for arbitrary input polarization. Note that the PM component does not have the property of tracking the phase of the sum of the input electrical signals, since it generally depends on these inputs in different proportions. This is one reason why we chose to restrict the polarization to a subset. If we choose said subset, L ⫽ R ⫽ Ein兾公2 共equal
P 2 ⫽ P˜ *P˜ ⫽ ⫹ ⫹
1 2
˜ ⫽ A
E in sin 共␦˜ 1 ⫺ ␦˜ 2兲. 2 2
(A8)
Equations 共2兲 and 共3兲 are the same as these but ˜. with a dimensionless definition of P˜ and A
An outline of the derivation of Eqs. 共8兲 follows. As with Appendix A we derive the Q-space to the M-space transfer function of the QVM for any input light polarization state. At the end we reduce the equations to the case in which the allowed polarizations are restricted. The derivation consists of ˜ to M-space paramtransforming parameters P˜ and A eters 共M1, M2, M3兲 by using Eqs. 共6兲 and transforming parameters ␦˜ 1 and ␦˜ 2 to Q-space parameters 共Q1, Q2, Q3兲 by using Eqs. 共7兲, hence converting Eqs. 共A6兲 from one set of coordinates to another. First, it is convenient to write a few intermediate terms by using Eqs. 共A6兲 as a starting point. We also convert to Q-space parameters 关by Eqs. 共7兲兴 as we go:
˜ L˜ *其 2关Q 0 ⫹ Q 2兴 ⫹ 2L 2R 2Q 2 ᑬ兵R ˜ 兩2 2兩L˜ ⫹ R ˜ 兩2 2兩L˜ ⫹ R
˜ L˜ *其关共L 2 ⫹ R 2兲Q 0 ⫹ 共L 2 ⫺ R 2兲Q 1 ⫹ 共L 2 ⫹ R 2兲Q 2兴 ᑬ兵R , ˜ 兩2 2兩L˜ ⫹ R
(B1)
˜ L˜ *其 2关Q 0 ⫺ Q 2兴 ᑣ兵R , ˜ 兩2 2兩L˜ ⫹ R
(B2)
˜ L˜ *其ᑣ兵R ˜ L˜ *其Q 1 ᑬ兵R ˜ ˜ 兩2 2兩L ⫹ R ⫹
˜ *其 ⫽ ᑣ兵P˜ A
E in 共␦˜ 1 ⫹ ␦˜ 2兲, cos 2 2
关共L 4 ⫹ R 4兲Q 0 ⫹ 共L 4 ⫺ R 4兲Q 1兴
˜ *A ˜ ⫽ A2 ⫽ A ˜ *其 ⫽ ᑬ兵P˜ A
冉冊 冉冊
P˜ ⫽
(A7)
Appendix B: Derivation of the Transfer Function of the Quadrature Variable Modulator for Q- and M-Space Parameters
with P˜ ⫽
˜ exp共i m t兲其 ⫹ ᑬ兵A 2
1 2
˜ L˜ *其关共L 2 ⫺ R 2兲Q 0 ⫹ 共L 2 ⫹ R 2兲Q 1 ⫺ 共L 2 ⫺ R 2兲Q 2兴 ᑣ兵R ,
˜ 兩2 2兩L˜ ⫹ R
˜ L˜ *其关ᑬ兵R ˜ L˜ *其 ⫹ 1 共L 2 ⫹ R 2兲兴 Q 3 ⫺ᑣ兵R 2 ˜ 兩2 2兩L˜ ⫹ R
.
10 September 2004 兾 Vol. 43, No. 26 兾 APPLIED OPTICS
(B3)
(B4) 5089
Things can be simplified somewhat by using a Stokes parameter representation for the polarization from this point. Here we 共unusually兲 define the Stokes parameters in terms of left- and rightdiagonal electric-field components 共equivalent to rotating the usual X–Y axes counterclockwise by 45°兲: S 0 ⫽ R 2 ⫹ L 2, S1 ⫽ R ⫺ L , 2
2
˜ L˜ *其, S 2 ⫽ 2 RL cos共兲 ⫽ 2ᑬ兵R ˜ L˜ *其, S 3 ⫽ 2 RL sin共兲 ⫽ 2ᑣ兵R
(B5)
when Eqs. 共B1兲–共B4兲 become P2 ⫽
A2 ⫽ ˜ *其 ⫽ ᑬ兵P˜ A
冋
Q0 Q1 ⫻ . Q2 Q3
冥
(B8)
Once again, Eqs. 共8兲 are the dimensionless equivalent of this, where Ein is external to the definition of the M-space parameters.
⫻ 共Q 0 ⫺ Q 2兲 ,
The authors are grateful to Russell Koehne for skill and labor in modifying the original AM device. Stan Whitcomb thanks the gravitational wave research group at the Australian National University for their support and hospitality during his stay at the Australian National University. This material is based on work supported by the Australian Research Council and in part by the United States National Science Foundation under Cooperative Agreement PHY-0107417. This paper has been assigned LIGO Laboratory document LIGOP030031-00R.
册
1 S 32 共Q 0 ⫺ Q 2兲, 8 S0 ⫹ S2
冋
册
1 S3 S1 S3 Q1 ⫺ 共Q 0 ⫺ Q 2兲 , 8 S0 ⫹ S2 1 S 3 Q 3. 8
(B6)
These intermediate quantities are then converted to M-space parameters 关by Eqs. 共6兲兴. We write the result here in matrix form:
冤
S0 ⫺S 1 S2 0 S 12 S 12 M0 ⫺S 1 S 0 ⫺ 0 S2 ⫹ 1 M1 S0 ⫹ S2 S0 ⫹ S2 ⫽ ⫺S 1 S 3 M2 S1 S3 4 S3 0 M3 S0 ⫹ S2 S0 ⫹ S2 0 0 0 ⫺S 3
冤冥
Q0 Q1 ⫻ . Q2 Q3
冥
(B7)
Equation 共B7兲 is the general Q- to M-space transfer function for the QVM with any input polarization. It gives further insight into the manner in which choosing L ⫽ R affects the properties of the system. Parameters M1 and M2 depend on both Q1 and Q2, which means that a sphere in the Q space is distorted in the M1-M2 plane by the transformation. The resulting surface is an ellipsoid whose major axis is no longer collinear with the M1 axis but is at an angle subtended in the M1-M2 plane. This distortion certainly interferes with most of the favorable properties of the system. For example, none of the poles of the ellipse coincides with a coordinate axis, making any of the six operating points discussed more complicated to find. The restriction on polarization states discussed in 5090
冤冥 冤 冤冥
M0 1 0 cos共兲 0 E in2 cos共兲 M1 0 1 0 ⫽ 0 sin共兲 0 0 M2 4 0 0 0 ⫺sin共兲 M3
1 S 32 S0 Q0 ⫺ S1 Q1 ⫹ S2 Q2 ⫺ 4 2共S 0 ⫹ S 2兲
˜ *其 ⫽ ⫺ ᑣ兵P˜ A
冤冥
the text is equivalent to setting S1 to zero 关which in turn forces S0 ⫽ Ein2, S2 ⫽ Ein2 cos共兲, and S3 ⫽ Ein2 sin共兲兴 when Eq. 共B7兲 reduces to
APPLIED OPTICS 兾 Vol. 43, No. 26 兾 10 September 2004
References 1. B. Davies and J. Conradi, “Hybrid modulator structures for subcarrier and harmonic subcarrier optical single sideband,” IEEE Photonics Technol. Lett. 10, 600 – 602 共1998兲. 2. See, for example, JDS Uniphase, www.jdsu.com. 3. G. Smith, D. Novak, and Z. Ahmed, “Technique for optical SSB generation to overcome dispersion penalties in fiber-radio systems,” Electron. Lett. 33, 74 –75 共1997兲. 4. G. G. Stokes, Mathematical and Physical Papers, 5 vols. 共Cambridge U. Press, Cambridge, UK, 1880 –1985兲. 5. R. W. P. Drever, J. L. Hall, F. V. Kowalski, J. Hough, G. M. Ford, A. J. Munley, and H. Ward, “Laser phase and frequency stabilization using an optical resonator,” Appl. Phys. B 31, 97–105 共1983兲. 6. L. Schnupp, conference presentation at the European Collaboration Meeting on Interferometric Detection of Gravitational Waves, Sorrento, Italy, 1988. 7. LIGO Scientific Collaboration, “Advanced LIGO systems design,” LIGO Tech. Note T010075, P. Fritschel, ed. 共LIGO Laboratory, Pasadena, Calif., 2001兲, http:兾兾antares.ligo.caltech. edu兾dcc兾default.htf. 8. J. Mizuno, K. A. Strain, P. G. Nelson, J. M. Chen, R. Schilling, A. Rudiger, W. Winkler, and K. Danzmann, “Resonant sideband extraction: a new configuration for interferometric gravitational wave detectors,” Phys. Lett. A 175, 273–276 共1993兲. 9. K. A. Strain and J. Hough, “Experimental demonstration of the use of a Fabry–Perot cavity as a mirror of variable reflectivity,” Rev. Sci. Instrum. 64, 799 – 802 共1994兲. 10. G. de Vine, D. A. Shaddock, and D. E. McClelland, “Experimental demonstration of variable reflectivity signal recycling for interferometric gravitational wave detectors,” Opt. Lett. 27, 1507–1509 共2002兲. 11. A. Loayssa, C. Lim, A. Nirmalathas, and D. Benito, “Simple
optical single-sideband modulator for fibre-radio applications,” Electron. Lett. 39, 97–99 共2003兲. 12. K. Yonenaga and N. Takachio, “A fiber chromatic dispersion compensation technique with an optical SSB transmission in optical homodyne detection systems,” IEEE Photonics Technol. Lett. 5, 949 –951 共1993兲. 13. A. Loayssa, D. Benito, and M. J. Garde, “Single-sideband suppressed-carrier modulation using a single-electrode electro-optic modulator,” IEEE Photonics Technol. Lett. 13, 869 –971 共2001兲. 14. S. Shimotsu, S. Oikawa, T. Saitou, N. Mitsugi, K. Kubodera, T. Kawanishi, and M. Izutsu, “Single sideband modulation performance of a LiNbO3 integrated modulator consisting of four-
phase modulator waveguides,” IEEE Photonics Technol. Lett. 13, 364 –366 共2001兲. 15. F. Grosshans, G. V. Assche, J. Wenger, R. Brouri, N. J. Cerf, and Ph. Grangier, “Quantum key distribution using Gaussianmodulated coherent states,” Nature 共London兲 421, 238 –241 共2003兲. 16. W. P. Bowen, N. Treps, B. C. Buchler, R. Schnabel, T. C. Ralph, H.-A. Bachor, T. Symul, and P. K. Lam, “Experimental investigation of continuous-variable quantum teleportation,” Phys. Rev. A 67, 32302-1-4 共2003兲. 17. A. Furusawa, J. L. Sorensen, S. L. Braunstein, C. A. Fuchs, H. J. Kimble, and E. S. Polzik, “Unconditional quantum teleportation,” Science 282, 706 –709 共1998兲.
10 September 2004 兾 Vol. 43, No. 26 兾 APPLIED OPTICS
5091