Soffia Magnu´sdo´ttir1 Herve´ Isambert2 Christoph Heller3 Jean-Louis Viovy1 1
Laboratoire de PhysicoChimie Curie (UMR CNRS 168), Institut Curie, Section de Recherche, 11 Rue Pierre et Marie Curie, Paris, cedex 05, France 2
Electrohydrodynamically Induced Aggregation During Constant and Pulsed Field Capillary Electrophoresis of DNA
Center for Studies in Physics and Biology, The Rockefeller University, Box 25, 1230 York Avenue, New York, NY 10021-6399, USA 3
Max–Planck-Institut fu¨r Molekulare Genetik, Abt. Lehrach Ihnestrasse 73, D-14195 Berlin-Dahlem, Germany Received 19 February 1998; accepted 8 September 1998
Abstract: We present a study aimed at understanding the factors affecting the separation of large DNA molecules by capillary electrophoresis in polymer solutions. In a first series of experiments, a systematic study of the effect of operational parameters on the development of an electrohydrodynamic instability resulting in DNA aggregation and spurious peaks in the electropherograms is presented. The results are discussed in regard to a recent theory of electrohydrodynamic instabilities in macroion suspensions, recently proposed by Isambert et al. Overall, the results provide strong support to the theory. Some situations of interest for applications, and not explicitly considered in the theory, such as asymmetric field pulsing and the use of polymer additives in the buffer, were also considered. Furthermore, robust optimized protocols for high resolution separation of DNA in the range of 100 base pairs to 160 kilobase pairs, are proposed. As predicted by the model, it is shown that using a concentrated isoelectric buffer (histidine) strongly reduces aggregation as compared to the use of a conventional buffer at the same concentration, and allows
Correspondence to: Jean-Louis Viovy; email:
[email protected] Contract grant sponsor: EU Contract grant number: CT96-1158 and BMH4-2627 Biopolymers, Vol. 49, 385– 401 (1999) © 1999 John Wiley & Sons, Inc.
CCC 0006-3525/99/050385-17
385
386
Magnu´sdo´ttir et al. separation of DNA from 100 bp to 160 kbp in less than 10 min. We also present a systematic study of the dependence of the mobility vs DNA size, pulse frequency, and field strength. The results are discussed with respect to the Biased Reptation with Fluctuations model and a good agreement is obtained. © 1999 John Wiley & Sons, Inc. Biopoly 49: 385– 401, 1999 Keywords: field inversion capillary electrophoresis; biased reptation theory; hydroxypropyl cellulose; entangled polymer solution; polyelectrolyte aggregation; isoelectric buffer; histidine
INTRODUCTION DNA electrophoresis appears as a necessary step in almost any research involving molecular genetics. The size range involved can vary enormously depending on the application; A few tens of base pairs (bp) is the common DNA size in oligonucleotide analysis, sequencing fragments are in the range of a few hundreds of bp, whereas PCR products usually range from 100 to 2000 bp and restriction maps concern DNA up to few tens of kilobase pairs (kbp). The search for genes (physical mapping and karyotyping, require the manipulation of DNA in the megabase pair (Mbp) range. Double-stranded DNA larger than typically 20 kbp cannot be separated in constant field gel electrophoresis: chains orient in the direction of the field due to biased reptation, and the mobility becomes independent of the DNA size.1–7 Pulsed Field Gel Electrophoresis (PFGE), a method in which the direction of the electric field is varied periodically to take advantage of the size dependence of the DNA reorientation time, yielded a solution to this problem, and permitted separations up to several Mbp.8 –11 Separating larger and larger DNA, however, requires the use of lower and lower fields, and long separation times (typically several days for Mbp DNA). Capillary electrophoresis (CE) recently appeared as a fast and resolutive alternative to slab-gel electrophoresis and is nowadays widely applied for separation of biopolymers (e.g., DNA, proteins, polysaccharides).12 In an early stage of development, DNA separations in CE were performed in cross-linked gels,13–15 but due to technical difficulties this type of separation media has been progressively replaced by entangled polymer solutions that can be easily filled into and flushed out of the capillary (see Ref. 16 for a review on CE of DNA). Systematic studies of DNA migration in polymer solutions show that the mobility follows the predictions of the Biased Reptation with Fluctuations model (BRF)6 when the polymer is highly entangled (c . c*). In particular, a transition to a size-independent migration mechanism occurs17 (around approximately 2 kbp in usual CE conditions). However, the separation range can be increased up to approximately 23 kbp using very dilute polymer solutions (c , c*). 18,19 The time to complete the anal-
ysis in such solutions is short, but the resolution is generally poorer compared to the one obtained in entangled solutions. Pulsed Fields can be applied in CE, using the “field inversion” mode, in which unequal forward and backward pulses are alternated (for a review, see Ref. 20). Field Inversion Capillary Electrophoresis (FICE) was proposed first by Heiger et al.21 as a way to increase the size range separable in CE. Several groups have reported separations of DNA standards containing fragments in the size interval of 10 kbp to a few Mbp, using FICE.24 –30 However, the peaks corresponding to DNA fragments 30 kbp and larger were often found to be split into several subpeaks, whereas smaller fragments migrated as single gaussian-shaped peaks.22–26 A multiplicity of sharp peaks was also observed when running supposedly monodisperse l-phage or T4-phage DNA.24 –26 At first, these numerous and rather regularly spaced peaks were attributed to high-resolution separation of different species, but a number of features did cast doubts about this interpretation. For instance, the occurrence of multiple peaks and the number of peaks in the electropherograms increased with increasing DNA size and/or increasing field strength.25 Apart from difficulties concerning peak identification, other problems such as capillary blockage, unstable baseline, and low reproducibility in the mobility where frequently observed. Spurious peaks and low reproducibility were also reported in attempts to separate large DNA using constant field.23 Some insight into the physical mechanisms at play was provided by fluorescence microscopy studies of DNA solutions submitted to direct current (DC) and alternating current (AC) fields32 and by fluorescence resonance energy transfer (FRET) microscopy.33 The application of an alternating field of typically 100 V/cm was shown to induce the segregation of an initially homogeneous and monodisperse DNA solution into DNA-poor regions and vortex-like DNA-rich domains (aggregates). Actually, aggregation of DNA in high fields had been observed previously but its connection with spurious peaks in CE was not made at that time.31 Aggregation can be suppressed to some extent by running a low concentration DNA sample at
Electrohydrodynamically Induced Aggregation
low field strength in rather concentrated polymer solutions. For instance, separation of l-phage from T4phage DNA (48.5 and 166 kbp, respectively) in 3 hours, with no or little aggregation, was reported24,26 but notably with very low reproducibility. Interestingly enough, much faster separation of the chromosomes of Saccharomyces cerevisiae (ranging in size from 250 –2000 kbp) in about 10 min using diluted hydroxyethyl cellulose (HEC) polymer solution was reported by Kim et al.29 Apart from a rather low resolution (some chromosomes comigrated in an unresolved band) and poor reproducibility, the high fields used in this study and the rapidity of the separation are spectacular and thought-provoking. Numerous questions concerning separation of large DNA in CE remain open, and require further study. On the applied ground, a rational understanding of the effect of operational parameters and of the actual limits of the method are crucial for the future applications of this approach, as compared to conventional pulsed-field gel electrophoresis. In particular, it would be interesting to combine the high resolution achieved in entangled solutions with the fast separations that has until now been achieved only in dilute solutions: Is this possible, or are there fundamental reasons for which it is not? On the fundamental side, experimental semiquantitative and/or scaling laws are necessary for guiding progress in the theoretical description of the aggregation phenomenon. These two aspects are somewhat interconnected, since theoretical models are useful for understanding and organizing experimental results, and for proposing new directions of research. The work presented here has a threefold aim: (a) To use a very simple model experiment to investigate the occurrence of aggregation as a function of operational parameters in CE of DNA. (b) To use experimental data for comparison with existing theory. (c) To propose new and improved separation conditions. The article is organized as follows: In the next section we provide a qualitative description of the theory discussed in Refs. 36 and 37, explain the physical concepts involved, and extend the model to isoelectric buffers. Materials and methods are described in the third section. In section four, we present results concerning the development of aggregates in capillaries uniformly filled with a DNA/buffer solution, in order to unravel the influence of the following operational parameters: Field strength and frequency, buffer concentration and chemical nature, and presence of polymer. In the fifth section, we present optimized separation protocols using the results of section four. A critical evaluation of the DNA mobility with reference
387
to the BRF model is proposed in the sixth section, and concluding remarks are given in the last section.
THEORY We recall here the ideas and equations necessary for understanding the physical origin of polyelectrolyte aggregation and the scaling predictions of the model. For a more detailed mathematical description, the reader is invited to refer to the original articles.36,37 In a solution of a polyelectrolyte such as DNA (macroion) and background electrolytes (co- and counterions), local concentration fluctuations exist. In the regions of increased macroion concentration (which can be either monomolecular, i.e., corresponding to the fractal distribution of monomers inside one macroion, or polymolecular, i.e., corresponding to a local excess in the number of macroions) deviations of the co- and counterion concentrations from the bulk value occur to maintain electroneutrality. Under the action of an electric field, the DNA and the coions on the one hand, and the counterions on the other hand, migrate in opposite directions. The electrophoretic migration of all the charged species, combined with the co- and counterion concentration deviations, lead to a perturbation of the electrolyte distribution in the vicinity of the macroion-rich regions, which spreads out by diffusion on the scale of a few microns. This in turn causes a slight violation of electroneutrality extending far beyond the Debye layer (of typical thickness 1 to 2 nm). It has been shown analytically by Isambert et al. that this electroneutrality breakdown gives rise to nonlinear electric forces, which are in turn able to produce an electrohydrodynamic flow. It was proposed by the same authors that this electrohydrodynamic flow is responsible for the spectacular patterns of aggregation observed experimentally in polyelectrolyte solutions under electric field, such as DNA31–33 and polysaccharides.34 In the following subsection we go through the main steps in the development of the theory and discuss its semiquantitative predictions concerning the onset of aggregation. This recall will finally be used to consider the case of an isoelectrical buffer.
Concentration Perturbation in a Solution of Macroions in a Buffer Containing Strongly Dissociated Electrolyte We start with the conservation equations describing the concentration perturbations for all the species in the solution [Eq. (1a– c)], and the Poisson equation [(Eq. (1d)]:
388
Magnu´sdo´ttir et al.
W z ~ 2 D M¹ W c M 1 z Mm Mc MEW 1 c MnW ! 5 0 tc M 1 ¹ (1a) W z ~ 2 D 1¹ W c 1 1 m 1c 1EW 1 c 1nW ! 5 0 tc 1 1 ¹ (1b) W z ~ 2 D 2¹ W c 2 2 m 2c 2EW 1 c 2nW ! 5 0 tc 2 1 ¹ (1c) W z EW 5 ¹
re e ~c 2 c 2 1 z Mc M! 5 «« 0 1 «« 0
(1d)
where c M (rW , t) is the concentration profile of the monovalent charges of the macroions (e.g., DNA molecules), D M is the (small) diffusion coefficient of the macroions, m M their electrophoretic mobility, and z M the sign of their net charge. Similarly, c 1 (rW , t), c 2 (rW , t), D 1 , D 2 , m 1 , and m2 are the concentration profiles, diffusion coefficients, and mobilities of the positive and negative electrolyte ions, respectively. nW is the electrohydrodynamic convection velocity, r e (rW , t) the local charge density, ««0 the dielectric constant of the solution, and e the elementary electronic charge. As usual in zone electrophoresis, we assume small average concentration of DNA, c M (rW , t) ! c S , and small deviations of the background electrolyte concentration from the bulk value c S . One can then linearize the equation set (1a– d) with regard to the deviation quantities: d c 1 5 c 1 2 c S and d c 2 5 c 2 2 c S . This yields, for the total electrolyte concentration perturbation S(rW , t) 5 d c 1 1 d c 2 : W c M~rW , t! 5 0 tS~rW , t! 2 D SDS~rW , t! 2 z Mm SEW z ¹ (2) with S(rW , t) ! c S . Here, the diffusion coefficients and the mobilities of the electrolyte ions have been taken identical for simplicity, i.e., D 1 [ D 2 5 D S and m 1 [ m 2 5 m S . Note also that electroneutrality is assumed in Eq. (2), which is here a good first-order approximation as long as EW 0 ! 10 5 V/cm and for distances larger than the Debye length. The nonuniform electrolyte profile is then polarized under the electric field to ensure a quasi-uniform current. This gives rise to a local net charge density r eS , which extends (typically over microns) into the bulk of the electrolyte solution: W z d EW < 2 «« 0 r eS 5 2 «« 0¹
WS EW 0 z ¹ 2c S
(3)
Note that in Eq. (3) we have only written the term corresponding to the charge at distances larger than
the Debye length, k21 > 2 nm. The resulting electrical body force, r e EW 0 , generates, within the polyelectrolyte solution, an electrohydrodynamic flow that effectively convects the very slowly diffusing macroions, whereas it generally brings a negligible correction to the approximate conservation for the much faster diffusing electrolyte ions [Eq. (1)]. This largescale electrohydrodynamic flow nW h within the macroion dispersion is described by a Stokes-like equation: W P 1 r eSEW 0 5 0 h D nW h 2 ¹
(4)
where r eS is given by Eq. (3), h is the solvent viscosity, and P is the hydrostatic pressure. Under a DC electric field or a low frequency AC field, a quasistationary concentration perturbation in salt develops in the vicinity of the migrating macroion rich regions. Its expression can be found from Eq. 2.19 in Ref. 37 and scales as S } 2( m S / m M )c M . Hence, combining Eq. (3) and (4) we eventually find that the electrohydrodynamic flow rate should be proportional to
nW h}«« 0
mS E 2c m Mc Sh 0 M
(5)
Qualitative Predictions of the Theory W (c M nW ) The electrohydrodynamic convection term ¹ actually dominates the large-scale, long-time macroion’s dynamics given by Eq. (1a) once the spontaneous stochastic macroion concentration fluctuations are taken into account. This suggests that under DC or low frequency AC field, the aggregation process is governed by this term, and that the aggregation rate, 1/T a should be approximately proportional to nW h as given by Eq. (5). Note that we defined the rate as the inverse of a characteristic “aggregation time” T a . Aggregates grow continuously in time, so this can be defined only for a given size scale. As discussed later on in the fourth section, capillary electrophoresis experiments bear their own “natural” size scale, i.e., the smallest detectable aggregate. Experiments also bear an intrinsic time scale, i.e., the time for the macroion to migrate from the inlet to the detector T. The combination of these time and size scales allow us to define a field threshold for aggregation E t as the minimal field at which aggregates can reach a detectable size during T (or, equivalently, the field for which T a 5 T). From Eq. (5), we expect that T a and E t respectively scale as T a}
c sh c ME 2
(6)
Electrohydrodynamically Induced Aggregation
E t}
Î
c Sh cM
(7)
(note that the absolute value of the threshold should depend on the particular choice of time and size scales, but not its scaling). These predictions suggest in particular that the propensity for aggregation should increase dramatically with increasing field strength (this has indeed been verified experimentally26,32 in the case of DNA). The model also predicts that the aggregation rate should be directly proportional to the spontaneous concentration fluctuations of the macroion c M , in agreement with the experimental observation that aggregation is favored by high DNA concentrations and large DNA sizes.26,32 Aggregation can thus be reduced by injecting less concentrated DNA samples.29,30 From Eqs. (6) and (7) we also see that aggregation is slowed down when the total electrolyte concentration is increased. To our knowledge, this parameter has not been systematically studied in the past, although a brief communication by Hjerte´n et al.22 suggested that aggregation could be diminished by adding NaCl to the buffer. Finally, we expect that high viscosity separation media should tend to retard the aggregation process (but they also slow down the migration velocity of DNA!). It should be kept in mind that the neutral polymers used as sieving media do not respond to the field, so that the predictions given above should remain valid for polyelectrolyte separation in any neutral polymer solution at any concentration, taking into account the viscosity change induced by this polymer. On the other hand, the use of a cross-linked gel should prevent aggregation, since its gel-like structure does not enable any large-scale electrohydrodynamic convection. Indeed, to our knowledge, aggregation has not been observed in gels so far.
Concentration Perturbation in a Solution of Macroions and Isoelectric Buffer As suggested by Isambert,35 the use of a buffer containing a large quantity of an isoelectric species could help reduce aggregation. We consider here the special case of a pure isoelectric buffer, with the following two thermodynamic dissociation constants: K 1 5 ZH 1 /Z 1 , K 2 5 Z 2 H 1 /Z. For the particular case of histidine close to its isoelectric point, Z, Z 1 , and Z 2 2 correspond to HisH, HisH 1 2 , and His , respectively (see the third section for the equilibria) (for terseness, brackets indicating concentrations are omitted). These two chemical equilibria can be combined into k1 3 1 Z 1 Z2 2Z 4k 2
(8)
389
where k 1 and k 2 are the kinetic rate constants. The conservation equations for each species in the solution [analogous to equation set 1(b– c) are tZ 2 D SDZ 2 2k 2Z 1Z 2 1 2k 1Z 2 5 0
(9a)
W z ~Z 1EW ! tZ 1 2 D SDZ 1 1 m S¹ 1 k 2Z 1Z 2 2 k 1Z 2 5 0
(9b)
W z ~Z 2EW ! tZ 2 2 D SDZ 2 1 m S¹ 1 k 2Z 1Z 2 2 k 1Z 2 5 0
(9c)
These equations contain terms directly related to the chemical kinetics in Eq. (8), which were not present in the case of a strongly dissociated electrolyte (see Eq. (1)). Note that the convection terms have been neglected for these fast-diffusing species, as discussed in Concentration Perturbation. Combining Eq. 9(a– c) to form the quantities Z T 5 Z 1 Z 1 1 Z 2 and Z 2 2 Z 1 , and linearizing as in and Refs. 35 and 37, we obtain W ~Z 2 2 Z 1! 5 0 tZ T 2 D SDZ T 2 m SEW 0 z ¹ (10a) W ~Z 2 1 Z 1! t~Z 2 2 Z 1! 2 D SD~Z 2 2 Z 1! 2 m SEW 0 z ¹ W z d EW 5 0 2 m S2c S¹
(10b)
From Eq. (10b) and taking into account the approximations developed for the case of a strongly dissociated electrolyte,37 we obtain for the large-scale charge density in the macroion/isoelectric solution W z d EW < 2 «« 0 r eZ 5 2 «« 0¹
W ~Z 2 1 Z 1! EW 0 z ¹ 2c S (11)
Assuming quasi-static chemical equilibrium locally, i.e., Z 1 Z 2 /Z 2 5 K 2 /K 1 W ~Z 2 1 Z 1! < ¹
2 ÎK 2/K 1
1 1 2 ÎK 2/K 1
W ZT ¹
(12)
In turn, Z T can be evaluated from Eq. (10a), which becomes W cM 5 0 tZ T 2 D SDZ T 2 z Mm SEW 0¹
(13)
in the approximation of electroneutrality: Z 2 2 Z 1 5 z M c M . Comparing Eq. (13) with Eq. (2), we see
390
Magnu´sdo´ttir et al.
that the total concentration of histidine Z T obeys the same equation as the total electrolyte perturbation in the case of a strongly dissociated electrolyte. Furthermore, it is apparent from Eqs. (3), (11), and (12) that the charge density for an isoelectric buffer is weaker (approximately 503 for the particular case of histidine) than that of a strongly dissociated electrolyte solution of similar ionic strength:
r eZ ;
2 ÎK 2/K 1
1 1 2 ÎK 2/K 1
r eS
254 nm in the absence of ethidium bromide (EB). Control experiments at identical DNA concentration in the presence of 10 mM EB showed no significant difference in aggregation time compared to the one obtained in a solution without EB. Separation of molecular weight DNA standards were performed using laser induced fluorescence (excitation argon ion line 488) detection, with 10 mM EB in the buffer. The emitted light from the sample was filtered by a bandpass filter with a wavelength interval of lem 5 555– 655 nm. In all experiments the temperature of the cartridge containing the capillary was controlled at 25°C.
(14) Electrophoresis Buffers and DNA Samples
Physically, Eq. (13) can be interpreted in the following way: The presence of the macroion is directly coupled to the total quantity of the isoelectric buffer Z T 5 Z 1 Z 1 1 Z 2 . However, since K 1 @ K 2 , only a small portion of the buffer is in the charged state, ÎK2/K1 i.e., Z2 < Z1 < ZT ! ZT . We there1 1 2 ÎK2 /K1 fore expect that the physical effects originating from the electrohydrodynamic flow should be significantly reduced with an isoelectric buffer like histidine as compared to a strongly dissociated electrolyte of similar ionic strength.
MATERIALS AND METHODS Field Inversion Capillary Electrophoresis A modified P/ACE System 2100 apparatus (Beckman Instruments, Fullerton, CA) was used for FICE, essentially as described in Ref. 24. The pulses were generated by a programmable function generator (Hameg HM 8130, Villejuif, France) and amplified by a high voltage amplifier (Trek 20 3 20, Trek Inc., Medina, NY). The output of the amplifier was connected to the inlet electrode, whereas the outlet electrode was connected to the ground. The pulsed field was created by applying a square formed AC pulse having equal duration and amplitude combined with a DC offset. Two types of capillaries were used, purchased from J & W Scientific (Folsom CA, USA): DB-17, ID 5 100 and 0.2 mm inner coating; DB-210, ID 5 75 and 0.3 mm inner coating. The two capillaries yielded identical performance in terms of resolution, suppression of electroosmosis, and aggregation when fresh, but the DB-210, which was made available in the course of the experimental work, could maintain optimal resolution and reproducibility of migration times during a longer period of use, and was thus preferentially used in the latest series of experiments. Capillary lengths to the detector of 30 and 7 cm were used, depending on the application (in the latter case, the “outlet” port of the P/ACE was used for injection and polarity was reversed). Systematic studies of aggregation in uniformly filled capillaries were performed with uv detection by absorption at
Tris boric acid EDTA (TBE) buffer at various concentrations indicated in the text at pH 5 8.6 (1 3 TBE is 89 mM Tris, 89 mM boric acid, and 2 mM Na2 EDTA) with all chemicals from Sigma-Aldrich Chemie (Steinheim, Germany) and solutions of various amount of pure histidine at pH 5 7.5, purchased from Fluka Chemie AG (Buchs Switzerland) were used. Histidine is an amino acid having three functional groups, resulting in the three following pKa values: 1.8, 6.1, and 9.2. Having the two highest pKa’s rather close, histidine has a reasonably good buffer capacity around its pI, which makes it a good candidate for DNA separations38 – 40: pK 0 5 1.82 1 His 21 ¡ His 1 3 O 2 1 H pK 1 5 6.00 His 1 ¡ HisH 1 H 1 2 O pK 2 5 9.16 HisH O ¡ His 2 1 H 1 K2 @HisH# 2 5 2 K 1 @HisH 1 2 #@His #
(15)
In our discussion we consider only the main species existing at pH $ 6.0. When dissolved in water, the neutral species (corresponding to HisH) is the most abundant one together with the less abundant negatively and positively charged species His 2 and HisH 1 2 , respectively. Counting only the two highest pKa values, the pI of histidine is 7.6, a value well compatible with the range of stability and full dissociation of DNA. Separations were performed by adding to the buffer 0.7% hydroxypropyl cellulose (HPC; M w 5 10 6 ) purchased from Sigma-Aldrich (Dorset, United Kingdom). All buffers were filtered and degassed before use. The following DNA molecular weight standards were used: 1 kbp ladder, fX174/HaeIII and High Molecular Weight Marker (HMW), all from Life Technologies Ltd. (Paisley, United Kingdom), l-phage came from New England Biolabs (Beverly, MA, USA) and T4-phage DNA from SigmaAldrich (Dorset, United Kingdom). Sample concentrations
Electrohydrodynamically Induced Aggregation were adjusted with water or the running buffer to 2–100 mg/mL.
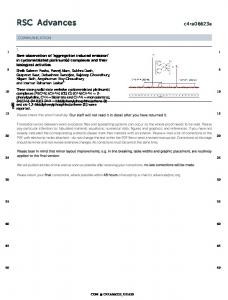
DNA AGGREGATION IN CAPILLARIES Principle Since aggregation is expected to depend on the concentration of the DNA, and since this concentration varies during electrokinetic injection (or at the beginning of the separation process itself in case of hydrodynamic injection), it is difficult to gain quantitative information on the mechanism of aggregation using conventional Capillary Zone Electrophoresis (CZE) separations. Therefore, we chose to study the formation of aggregates by a procedure originally proposed by Hjerte´n et al.22 The capillary is entirely filled with a solution of DNA and buffer at known concentrations and the response of the uv detector is then monitored as a function of time directly after the application of the field. Since the field is now applied over a homogeneous solution, the only source of variations in the detector output other than the noise in the apparatus should originate from eventual formation of aggregates (see second section). An example of electropherograms obtained in such condition is presented in Figure 1a. In the beginning, the signal from the detector remains constant, as expected for a homogeneous and stable DNA/buffer sample. However, the “noise” in the signal starts to increase significantly after the first minute, indicating some heterogeneities in the solution. We attribute this variation of the signal to the progressive formation of aggregates and to their passage in front of the detector. The peak height progressively grows, reflecting the increase in the average size (and/or density) of the aggregates. When approximately three minutes have passed, the aggregation formation has come to an apparent stationary state, and the peak height is stable. Comparison with direct microscopy observations shows that this corresponds to a situation in which the aggregates have reached the size of the capillary, and do not grow any further. Finally, the baseline reaches the same signal-to-noise ratio as before the formation of aggregates and a lower level, indicating that the capillary has been emptied of DNA molecules and only buffer ions pass the detector window (in this case, no capillary blockage was observed). The difference between the measured initial and final absorption levels was in good agreement with the calculated absorption value (through Lambert/Beer’s law) for this particular DNA concentration.
391
Effect of Buffer Concentration on Aggregation Time and Threshold Using the type of experiments described in the previous section, we varied the buffer concentration, and observed that the noisy pattern on the electropherogram appeared earlier as the buffer became more diluted. To apply a reproducible and unique criterion for all experiments, we define the time that the aggregates take to form, T a , as the point where the root mean square (rms) of the signal fluctuation has doubled as compared with the value at the beginning of signal recording. Note, however, that our aggregation criterion pertains to the time necessary for DNA to migrate from the capillary inlet to the detector. Hence, the observation of aggregation in a particular experiment depends on the chosen capillary length. Although somewhat arbitrary, this criterion is a good basis for comparison, since it was applied to all of our experiments using the same capillary length to the detector. Using this criterion, we systematically varied the field strength, and for, each field strength studied the capillary was refilled with a fresh DNA/ buffer solution and the detector signal recorded. The aggregation could only be observed beyond a certain field threshold, which is probably due to the finite size of the capillary. We have plotted T a as a function of TBE concentration in Figure 2 and the relationship is linear, in agreement with the theoretical prediction given by Eq. (6). In Figure 3, we have plotted the lowest field at which aggregation was observed as a function of buffer concentration. The field threshold increases with buffer concentration for both histidine and TBE, which is in qualitative agreement with Eq. (7). However, a quantitative fit leads to an experimental exponent 0.65 6 0.5, somewhat higher than the theoretical prediction (0.5). Note, however, that the determination of the threshold is not very accurate, and error bars are rather large.
Comparison of Histidine and TBE Buffers Figure 1b shows the evolution of the electropherogram obtained in conditions identical to those of Figure 1a, except that TBE buffer was replaced by 50 mM histidine. Note the low values of the current, due to the weak dissociation of histidine (this value is actually at the limit of sensitivity of the apparatus, leading to a spurious low-frequency ripple in the signal). We believe the initial decrease in the current is due to progressive elimination of salts initially contained in the DNA stock solution. The plateau current corresponds to the “pure” isoelectric buffer.
392
Magnu´sdo´ttir et al.
FIGURE 1 The uv-detector response at the capillary window from the time the DC field of 200 V/cm was applied. Capillary of type DB-17, ID 5 100 mm (total length 37 cm, length to detector 30 cm) was entirely filled with the DNA/buffer solution before the field was switched on. (a) Capillary filled with 100 mg/mL of l-phage DNA in 89 mM TBE buffer. (b) Capillary filled with 100 mg/mL of l-phage DNA in 50 mM histidine buffer.
The rms fluctuation of the detector signal, representing the absorption from all components of the sample, is constant until the DNA molecules have migrated out of the capillary. The results from these experiments show unambiguously that, at equal concentration of DNA, 50 mM histidine induces less DNA aggregation than 1 3 TBE. In the light of the theoretical discussion, this means that, although concentrated solutions of histidine have a lower ionic strength than traditional electrophoretic buffers (Fig-
ures 1a and 1b show a tenfold variation in conductivity between 1 3 TBE and 50 mM histidine), the “isoelectric effect” we have described is sufficient to prevent the formation of aggregates under these experimental conditions. In Figure 3, the field thresholds obtained for DNA/histidine solutions are compared with those obtained with DNA/TBE solutions, at equal DNA concentration. The result is also in qualitative agreement with the theoretical prediction suggesting that a higher field is needed to initiate aggre-
Electrohydrodynamically Induced Aggregation
393
FIGURE 2 Aggregation time T a as a function of TBE concentration. Capillary of type DB-17, ID 5 100 mm (total length 37 cm, length to detector 30 cm) was entirely filled with 10 mg/mL l-phage DNA in 1 3 TBE buffer before the field was switched on. Electric field 200 V/cm.
gation in isoelectric buffers as compared to more dissociated ones such as TBE.
Effect of Frequency on Aggregation Time As discussed earlier,24 the separation of large DNA fragments with CE in entangled polymer solutions
requires the use of pulsed fields, because the chains tend to orient along the field direction. In Figure 4, T a is plotted as a function of the frequency of a 6 216 V/cm AC squared pulse with a 108 V/cm DC offset. The aggregation time varies slowly up to 150 Hz, then increases abruptly before stabilizing around 200 Hz. Interestingly, this transition frequency corresponds to
FIGURE 3 Electric field threshold E t above which aggregation occurred as a function of buffer concentration (DNA concentration fixed) for two different solutions, TBE/DNA (h), and histidine/ DNA (F). For each field value studied the capillary (of type DB-17, ID 5 100 mm; total length 37 cm, length to detector 30 cm) was filled with l-phage DNA at 10 mg/mL in the buffer before the field (AC square pulses) was switched on. Field frequency 0.01 Hz. The points indicate the lowest electric field at which the aggregation was observed.
394
Magnu´sdo´ttir et al.
FIGURE 4 Aggregation time T a as a function of field frequency. Capillary of type DB-17, (ID 5 100 mm, total length 37 cm length to detector 30 cm), was entirely filled with the 10 mg/mL l-phage DNA in 1 3 TBE buffer solution before the field was switched on. Electric field: AC square pulse (432 V/cm) combined with a DC offset (108 V/cm).
the highest frequency at which the AC component of the electric field is still expected to induce a quasistatic electrolyte concentration perturbation at the scale of the l-DNA coil in solution, i.e., v 0 , D S /R 2g , where R g is the radius gyration of a l-DNA molecule. Hence, this weak dependency of T a upon the pulse frequency below 150 Hz is in good agreement with the “DC regime” case discussed in Ref. 37, which we have briefly recalled in the theoretical section. At frequencies above this value, on the other hand, the electrolyte perturbation cannot follow quasi-statically the pulsed field and lags behind it due to its relaxation time 1/v0. That this high frequency regime induces less aggregation than the low frequency one is reminiscent to the theoretical prediction37 that the electrohydrodynamic convection is in fact expected to trigger aggregation under an high frequency electric field with an efficiency inversely proportional to v2 (here v 5 2pv, where v is the applied pulse frequency). Note, however, that the theory developed in Ref. 37 for high frequencies strictly corresponds to the case of an AC field without an offset. Therefore, the increased aggregation time observed here around 150 Hz is likely to involve nonlinear combinations between the AC component and the DC offset of the electric field. Ultimately, these findings suggest that the onset of aggregation is indeed sensitive to electrolyte concentration perturbations on the scale of one DNA molecule. From a practical point of view, these results also suggest that the pulsing frequency plays an important
role for the formation of aggregates and adds a further complication to the task of separating large DNA, since larger molecules requires a lower pulsing frequency to be separated.
Effect of Sieving Polymer on Aggregation Time Separation of DNA requires a sieving medium, in general composed of a neutral hydrosoluble polymer. Therefore, it is of high interest to understand how such a polymer may affect the electrohydrodynamic flow velocity. Although theoretical investigations on this point are not very developed, we expect from Eq. (6) that T a increases linearly with increased viscosity. Note, however, that the theory used here only considers a purely Newtonian medium (for which h is independent of the length scale and of the shear rate) and does not take into account the more complex viscoelastic properties of polymer solutions—in particular, above their entanglement threshold. In this work we studied the aggregation of DNA in a high molecular weight polymer. We chose Hydroxy Propyl Cellulose (HPC) (M w ' 10 6 , c* ' 0.4%), which has been shown to be suitable for separation of large DNA molecules.41 A concentration interval ranging from below the entanglement threshold c* (dilute) to highly entangled solution was explored (Figure 5). In the dilute regime, the aggregation time increases lin-
Electrohydrodynamically Induced Aggregation
395
FIGURE 5 Aggregation time T a as a function of polymer concentration (HPC, M w ' 10 6 ). The capillary DB-17, ID 5 100 mm, total length 37 cm, was entirely filled with a solution of 10 mg/mL l-phage DNA, 1 3 TBE and various concentrations of polymer. Electric field: AC square pulse (432 V/cm) combined with an DC offset (108 V/cm). Field frequency: 2 Hz.
early with concentration, as expected, but then tends to level off for concentrations above c*. This latter behavior does not reflect the relationship between the polymer concentration and the viscosity, known to increase more rapidly above c* (reaching an exponent of order 3.75 for a highly entangled polymer in good solvent). From a practical point of view, increasing the polymer concentration beyond c* does not seem to be an effective way of slowing down aggregation.
APPLICATION TO DNA SEPARATIONS Experimental Results With the conclusions of the previous sections in mind, we can now attempt to improve the protocols for the separation of large DNA in polymer solutions. Our criterion is a fast and accurate analysis within approximately 10 min. To obtain a fractionation throughout a wide size interval and to minimize the risk for aggregation, we have used an entangled polymer solution of HPC as a medium. Using a relatively viscous medium demands the use of relatively high fields to minimize the analysis time. Being interested in protocols applicable routinely to a commercial apparatus and to various biological samples in which the solute of interest might be of low abundance compared to other components in the sample, we have adapted our protocol to DNA concentrations of typically 10 mg/
mL. Because of the low efficiency of electrokinetic injection into separation media of low conductivity, long injection times (at low fields) had to be chosen instead of injection at high fields (and short times), to avoid the risk for aggregation during injection. As a guideline, we chose injection conditions yielding a signal strong enough to detect the 72 bp fragment of the fX174/HaeIII molecular weight standard. Combining these constraints with the results of the preceding section, a polymer solution slightly above c* (0.7% HPC) in a isoelectric buffer at high concentration (200 mM) is applied in our study. It should be mentioned at this stage that other polymers such as Hydroxy Ethyl Cellulose (HEC) were also used with good success in the entangled state (results not shown), but in our hands, separations in dilute HEC solutions did not lead to results reproducible enough for routine applications. Typical electropherograms are shown in Figures 6 and 7. Inspecting the separation of the kbp-ladder (0.072–12 kbp) and T4-phage DNA (166 kbp; Figure 6), one can notice that no aggregation is visible for the T4 fragment. Note, however, that this corresponds to a rather high frequency, optimal for the separation of fragments up to about 20 kbp. Therefore, the absence of aggregates in this particular case does not demonstrate the possibility of avoiding aggregation and achieving good resolution at 166 kbp. These conditions, however, provide in less than 6 min an excellent
396
Magnu´sdo´ttir et al.
FIGURE 6 Fluorescence signal (arbitrary scale) during the separation of a mixture of kbp-ladder (2 mg/mL) and T4-DNA (4 mg/mL). Running buffer: 0.7% HPC diluted in 178 mM histidine. Injection: 18.5 V/cm (DC offset) for 40 s. FICE conditions: AC square pulse of 519 V/cm combined with a DC offset of 133 V/cm, field frequency 5 80 Hz. Capillary: of type DB-210, 7 cm to the detector, total length 27 cm. Peak assignments: 72 bp (1), 134 bp (2), 154 bp (3), 201 bp (4), 220 bp (5), 298 bp (6), 344 bp (7), 396 bp (8), 506 bp (9), 517 bp (10), 1018 bp (11), 1636 bp (12), 2036 bp (13), 3054 bp (14), 4072 bp (15), 5090 bp (16), 6108 bp (17), 7126 bp (18), 8144 bp (19), 9162 bp (20), 10,180 bp (21), 11,198 bp (22), 12,216 bp (23) and 166 kbp (24).
resolution from 72 bp to 13 kbp (only the 506 and 517 bp fragments are not resolved), a range suitable for many applications presently achievable only by slab gel electrophoresis in a much longer time. Figure 7 shows the resulting electropherogram from the separation of fX174/HaeIII (0.072–1.4 kbp) mixed with HMW (8.2– 48.5 kbp) in less than 10 min. In contrast to the previous run, the experimental conditions were chosen for optimizing the separation in the upper part of the size range, thus leaving the 8271 and 8612 bp fragments of the HMW unresolved. Correct peak assignment was checked by mixing different DNA standards having overlapping size ranges (such as kbpladder and HMW) and by spiking runs with l- or T4-phage DNA. The run-to-run reproducibility of migration times were found to be extremely good in these experiments, with variations generally within 2– 4%. However, the resolution became progressively worse after approximately 5 days of intensive use, probably because of interactions between the capillary wall and the various components of the separation solution. Very probably, microaggregates of DNA or other impurities in the sample could adsorb to the capillary wall during repetitive runs, or the capillary coating itself may degrade with time. Importantly, attempts to
separate the same DNA samples under identical experimental conditions, but with 1 3 TBE buffer instead of histidine, were nonreproducible. An interpretable separation (usually worse than with histidine buffer) could occasionally be obtained with a new capillary, but most electropherograms showed a very unstable baseline and capillary blockage occurred after only a few runs. Finally, it is important to mention that the use of histidine reduces aggregation as compared with TBE at equivalent concentration, but does not avoid it in all circumstances. For instance, runs performed on samples containing 10 mg/mL T4-phage DNA at frequencies lower than 35 Hz and at an average field of 133 V/cm displayed many sharp peaks (aggregations) instead of one single peak (not shown). This means, for instance, that we were not able to separate the T4-phage from the l-phage at this particular field strength, since a frequency lower than 40 Hz is needed to create enough difference in their mobilities (see Figure 8 and comments below). The increased bandwidth observed for large DNA fragments, such as the T4-phage peak in Figure 6, deserves a comment. Partial degradation by shear is very probable for a DNA of this size, but it should yield an asymmetric peak with a shoulder on the low-molecular mass side only, so this is probably not
Electrohydrodynamically Induced Aggregation
397
FIGURE 7 Fluorescence signal (arbitrary scale) during the separation of a mixture of fx174/ HaeIII (5 mg/mL), HMW (16 mg/mL) and l-phage (2 mg/mL). Running buffer: 0.7% HPC diluted in 178 mM histidine. Injection: 18.5 V/cm (DC offset) for 70 s. FICE conditions: AC square pulse of 519 V/cm combined with a DC offset of 133 V/cm, field frequency 5 30 Hz. Capillary: DB-210, 7 cm to the detector, total length 27 cm. Peak assignments: 72 bp (1), 118 bp (2), 194 bp (3), 234 bp (4), 271 bp (5), 281 bp (6), 310 bp (7), 603 bp (8), 872 bp (9), 1078 bp (10), 1656 bp (11), 8271 bp (12), 8612 bp (13), 10,086 bp (14), 12,220 bp (15), 15,004 bp (16), 17,057 bp (17), 19,399 bp (18), 22,621 bp (19), 24,776 bp (20), 29,942 bp (21), 33,498 bp (22), 38,416 bp (23), and 48,502 bp (24).
the only cause of peak broadening. Peaks in the 30 –50 kbp range in Figure 7 are also enlarged as compared to smaller fragments, although to a lesser extent than the T4 peak. This phenomenon, which is obviously detrimental for separations, seems very general and is worth further investigations.
Discussion with Regard to the BRF Model In order to guide the search of optimal separation conditions in a given size interval, the mobility was plotted as a function of DNA size on a log–log scale for five different pulse frequencies (Figure 8). As expected from theoretical10 and experimental work about migration mechanisms of DNA in pulsed field in gels42 and polymer solutions,24 there is a size range in which the mobility is independent of the frequency. In our study, this independence holds until approximately 3 kbp. According to the biased reptation theory, this particular range has been attributed to the regimes of “Ogston sieving” and “reptation without orientation.” For larger chains, field pulsing interferes with field-induced chain stretching and orientation (corresponding to the “reptation with orientation” re-
gime), and a strong size dependence of the mobility may be obtained. This pulsed-field effect is characterized by a locally steep slope in the mobility, which is shifted toward higher molecular weights when lowering the frequency. The theory predicts that the drop in the mobility occurs for DNA molecules having reptation times t rep comparable with the pulse time t of the applied field, and provides scaling predictions that permits extrapolation from one experimental situation to the other. With the aid of these scaling predictions one can rapidly find the optimal field strength and pulse time for a given size range of DNA to be separated. Using the BRF model, the reptation time for a chain in a sieving matrix is found to follow the scaling law.5–7: t rep}NE 21.2
(15)
Where N denotes the molecular size and E the electric field. Given that N opt corresponds to the DNA molecular size at which the mobility is the most sensitive to the pulse time, we expect that t rep~N opt!} t
(16)
398
Magnu´sdo´ttir et al.
FIGURE 8 Effect of pulse frequency on FICE separation (a double logarithmic plot of the mobility as a function of the molecular size for various frequencies); 20 Hz (Œ), 30 Hz ({), 40 Hz (}), 60 Hz (E), and 80 Hz (‚). All experimental conditions are identical to those given in Figures 6 and 7.
N opt can thus be regarded as the midpoint of the optimal separation range and by combining Eq. (15) and (16) one obtains N opt} t 1E 1.2
(17)
For quantitative analysis of our data we evaluated N opt by using the inflexion point in the mobility curve in Figure 8 for each frequency. This value was then plotted as a function of the pulse time t as shown in Figure 9. The slope, corresponding to the exponent of t in Eq. (17), was independent of the electric field (within experimental error) and equal to 0.98 6 0.10. The same method was applied to the field exponent (Figure 10), i.e., N opt was evaluated for different fields at a fixed frequency, and then plotted as a function of the electric field, yielding a slope of 1.2 6 0.2. Then, according to our data, the size of optimal separation is described by the following relationship: N opt < t 0.9860.10E 1.260.2
(18)
These results are in reasonable agreement with theoretical predictions and with earlier experimental work in gels42 as well as in concentrated polymer solutions.24
CONCLUDING REMARKS This article reports a systematic investigation of important parameters affecting the separation of large
DNA molecules in pulsed field CE. In particular, we confirmed a theoretical prediction which associates the aggregation of a polyelectrolyte with an electrohydrodynamic flow related to the apparition of net charge density, this latter originating from spontaneous concentration fluctuations in the DNA/buffer solution. That a theory based on an expansion around equilibrium accounts so well for a process ultimately reflected in seemingly very chaotic macroscopic behavior can be explained as follows. It was actually shown in Ref. 37 that the stochasticity concerns only the dynamics of the (slowly diffusing) aggregates, whereas the small ions and the local flows around one particular aggregate can be described (in the experimental conditions used here) by deterministic equations quasistatically slaved to the slow aggregate dynamics. It was confirmed experimentally that the time for establishing aggregates T a increased linearly with buffer concentration, and that a higher field was necessary to trigger the aggregation in histidine buffer than in TBE. Aggregation was also favored by increasing field strength, DNA size, and DNA concentration, and by lowering pulse frequency. On the other hand, it was observed that aggregation was slowed down (T a increased) by increasing the concentration of the sieving polymer and the pulse frequency. Using 178 mM histidine and laser-induced fluorescence detection, it was possible to separate double-stranded DNA in the range of 100 to 50,000 bp in less than 10 min, with a reproducibility, reliability, and resolution
Electrohydrodynamically Induced Aggregation
399
FIGURE 9 Midpoint of the separation window N opt using data from Figure 8 (together with data not shown) as a function of the pulse time for 133.3 V/cm (‚) and 66.7 V/cm (F). The resulting slope is 0.98 6 0.1.
comparable to those usually obtained in the range of 100 –2000 bp with constant-field CE. In order to separate larger sizes, however, aggregation may still be encountered using DNA concentrations of 10 mg/mL. To avoid aggregation in such conditions, one may propose to reduce the field strength, which in turn leads to longer runs, or to use more sensitive probes for DNA detection and/or more sensitive detection systems.
As mentioned in the fourth section, decreasing the electric field reduces aggregation (at a given frequency) but it also imposes a lower optimal frequency for separating DNA in a given size range. Since lowering the frequency favors the buildup of aggregation, it cannot be granted a priori that improvements can be obtained by lowering the electric field. From Figure 4, however, one can see that the dependence of the aggregation time on frequency is weak, apart from
FIGURE 10 Midpoint of the separation window N opt using data from Figure 8 (together with data not shown) as a function of the average field (DC offset) for square field pulsing at 10 Hz (Œ) and 20 Hz (E). The resulting slope is 1.2 6 0.2.
400
Magnu´sdo´ttir et al.
the steep transition at approximately 150 Hz. We have seen, in addition, that this transition corresponds to the time necessary for establishing the perturbed concentration profiles of the background electrolyte at the scale of the DNA molecules, i.e., a time much smaller than the time necessary for the reptation time of a DNA chain of 50 kbp and more (at equal field strength). Therefore, one can expect from these results that resolutive separation of DNA above 50 kbp will generally occur in the “low frequency” regime, in which aggregation is fast. This probably explains at least in part why there seems to be a qualitative jump in difficulty, when attempting to separate DNA beyond a typical size of a few tens of kbp. Fortunately, the T a vs frequency curve seems to remain rather flat in the low frequency regime, so that lowering the field strength (and the frequency) within this regime should actually help reduce aggregation. However, the strong dependence of the electrophoretic velocity upon the field in the reptation with orientation regime makes this approach very unfavorable in terms of analysis time. Therefore, we believe other routes still have to be explored such as the optimization of pulse sequences and/or shapes or the investigation of novel sieving matrices. Investigating the possible reasons for band broadening of large DNA peaks will also be necessary. At present, it is not clear if this is inherent to the separation process, or associated to some yetto-be-understood polydispersity of conformations affecting the DNA molecules themselves. Along these lines, the effect of DNA topology on separation in pulsed fields will also deserve investigation. This work was partly financed by two EU-grants (no. CT961158, CT97-2627) and by support from l’Association Francaise contre les Myopathies through a personal grant (no. 5200 M.G. 1996) to SM. We also want to thank Prof. Pier Giorgio Righetti and Dr. Jan Sudor for suggestions and helpful discussions, and the referees for useful comments and critiques on the manuscript.
DS:
dc1 5 c1 2 cS: dc2 5 c2 2 cS: EW 0 : Et: e: ««0: h: K1, K2: k1, k2: k21:
mM: m1: m2: mS: N opt: v: P: r e (rW , t):
r eS : r eZ : S(rW , t): Ta: T: t rep: t: nW :
nW h :
LIST OF SYMBOLS
zM: Z:
c M (rW , t):
Z1:
c 1 (rW , t): c 2 (rW , t): cS: DM: D1: D2:
Concentration profile for the charges fixed on the macroion (DNA); concentration profile of the counterions; concentration profile of the coions; concentration of electrolytes in the bulk solution; diffusion coefficient of the macroions; diffusion coefficient of the counterions; diffusion coefficient of the coions;
Z2:
ZT: 1/v0:
v 5 2pv:
diffusion constant of the background electrolyte; deviation of the coion concentration from the bulk value; deviation of the counterion concentration; applied electric field; electric field threshold; elementary electronic charge; dielectric constant of the solution; viscosity of the macroion/electrolyte solution; dissociation constants for the equilibria of histidine; kinetic rate constants; debye length of the macroion/electrolyte solution; mobility of the macroions; mobility of the counterions; mobility of the coions; mobility of the background electrolyte; midpoint of optimal separation range; applied pulse frequency; hydrostatic pressure; charge density profile due to the fixed charges on the macroion; charge density due to the concentration perturbation in an highly dissociated buffer; charge density due to the concentration perturbation in an isoelectric buffer; total electrolyte concentration perturbation; aggregation time; time for aggregates to reach the detector; reptation time; pulse time (period); electrohydrodynamic convection velocity; electrohydrodynamic flow due to the concentration perturbation; sign of charge of macroions; concentration of the neutral component in an isoelectric buffer; concentration of the positively charged component in an isoelectric buffer; concentration of the negatively charged component in an isoelectric buffer; total concentration of the isoelectric buffer; time it takes the background electrolyte ions to migrate a distance of typical one macromolecule (1 mm); electric field pulsation.
Electrohydrodynamically Induced Aggregation
REFERENCES 1. McDonnell, M. W.; Simon, M. N.; Studier, F. W. J Mol Biol 1977, 110, 119 –146. 2. Lumpkin, O. J.; Dejardin, P.; Zimm, B. H. Biopolymers 1985, 24, 1573–1593. 3. Slater, G. W.; Noolandi, J. J Phys Rev Lett 1985, 55, 1579 –1582. 4. Slater, G. W.; Noolandi, J. Biopolymers 1986, 25, 431– 454. 5. Duke, T.; Semenov, A. N.; Viovy, J.-L. Phys Rev Lett 1992, 69, 3260 –3263. 6. Duke, T.; Viovy, J.-L.; Semenov, A. N. Biopolymers 1994, 34, 239 –247. 7. Semenov, A. N.; Duke, T.; Viovy, J.-L. Phys Rev E 1995, 51, 1520 –1536. 8. Schwartz, D. C.; Cantor, C. R. Cell 1984, 37, 67–75. 9. Carle, G. F.; Olson, M. V. Nucleic Acids Res 1984, 12, 5647–5664. 10. Viovy, J.-L. Biopolymers 1987, 26, 1929 –1940. 11. Heller, C. Analusis 1993, 21, M11–M14. 12. Righetti, P. G., Ed. Capillary Electrophoresis in Analytical Biotechnology; CRC Press, Boca Raton, FL, 1996. 13. Hjerte´n, S.; Elenbring, K.; Kila´r, F.; Liao, J.-L. J Chromatogr 1987, 403, 47– 61. 14. Cohen, A. S.; Karger, B. L. J Chromatogr 1987, 397, 409 – 417. 15. Swerdlow, H.; Gesteland, R. Nucleic Acids Res 1990, 18, 1415–1419. 16. Heller, C., Ed. Analysis of Nucleic Acids by Capillary Electrophoresis; Friedr. Vieweg & Sohn Verlagsgesellschaft, Braunschweig/Weinheim, 1997; 1st ed. 17. Mitnik, L.; Salome´, L.; Viovy, J.-L.; Heller, C. J Chromatogr A 1995, 710, 309 –321. 18. Barron, A.; Blanch, H. W.; Soane, D. S. Electrophoresis 1994, 15, 597– 615. 19. Hubert, S.; Viovy, J.-L.; Slater, G. Macromolecules 1996, 29, 1006 –1009. 20. Sudor, J.; Novotny, M. V. In Analysis of Nucleic Acids by Capillary Electrophoresis; Heller, C., Ed.; Friedr. Vieweg & Sohn Verlagsgesellschaft, Braunschweig/ Weinheim, 1997; pp 218 –235. 21. Heiger, D. N.; Cohen, A. S.; Karger, B. L. J Chromatogr 1990, 516, 33– 48.
401
22. Hjerte´n, S.; Srichaiyo, T.; Elenbring, K. Abstract presented at HPCE ’91, San Diego, CA, 3– 6 February 1991. 23. Guszczynski, T.; Pulyaeva, H.; Tietz, D.; Garner, M.; Chrambach, A. Electrophoresis 1993, 14, 523–530. 24. Heller, C.; Pakleza, C.; Viovy, J.-L. Electrophoresis 1995, 16, 1423–1428. 25. Magnu´sdo´ttir, S.; Heller, C.; Viovy, J.-L. 1996, Abstract presented at ITP ’96, Prague, 17–20 September 1996. 26. Magnu´sdo´ttir, S. Ph.D thesis, Universite´ Pierre et Marie Curie, Paris, 1998. 27. Sudor, J.; Novotny, M. V. Anal Chem 1994, 66, 2446 – 2450. 28. Kim, Y.; Morris, M. D. Anal Chem 1994, 66, 3081– 3085. 29. Kim, Y.; Morris, M. D. Anal Chem 1995, 67, 784 – 786. 30. Kim, Y.; Morris, M. D. Electrophoresis 1996, 17, 152– 160. 31. Song, L.; Maestre, M. F. J Biomol Struct Dynam 1991, 9, 525–535. 32. Mitnik, L.; Heller, C.; Prost, J.; Viovy, J.-L. Science 1995, 267, 219 –222. 33. Schwinefus, J. J.; Wang, S.-C.; Hammond, R.; Morris, M. D. Electrophoresis 1996, 17, 1110 –1114. 34. Stefanson, M. Submitted, 1998. 35. Isambert, H. Ph.D Thesis, Universite´ Pierre et Marie Curie, Paris, 1996. 36. Isambert, H.; Ajdari, A.; Viovy, J.-L.; Prost, J. J Phys Rev Lett 1997, 78, 971–974. 37. Isambert, H.; Ajdari, A.; Viovy, J.-L.; Prost, J. J Phys Rev E 1997, 56, 5688 –5704. 38. Mandecki, W.; Hayden, M. DNA 1988, 7, 57– 62. 39. Gelfi, C.; Perego, M.; Righetti, P. G. Electrophoresis 1996, 17, 1470 –1475. 40. Stoyanov, A. V.; Gelfi, C.; Righetti, P. G. Electrophoresis 1997, 18, 717–723. 41. Viovy, J.-L.; Heller, C. In Capillary Electrophoresis in Analytical Biotechnology; Righetti, P. G., Ed.; CRC Press, Boca Raton, FL, 1996; pp 477–508. 42. Heller, C.; Pohl, F. M. Nucleic Acids Res 1989, 17, 5989 – 6003.