PIERS Proceedings, Marrakesh, MOROCCO, March 20â23, 2011. Electromagnetic Field Interaction between Overhead High Voltage. Power Transmission Line ...
PIERS Proceedings, Marrakesh, MOROCCO, March 20–23, 2011
1478
Electromagnetic Field Interaction between Overhead High Voltage Power Transmission Line and Buried Utility Pipeline K. N. Ramli1, 2 , Raed A. Abd-Alhameed1 , H. I. Hraga1 , D. T. W. Liang1 , and P. S. Excell3 1
Mobile and Satellite Communications Research Centre, University of Bradford, Bradford BD7 1DP, UK 2 Faculty of Electrical and Electronic Engineering, Universiti Tun Hussein Onn Malaysia (UTHM) Parit Raja 86400, Batu Pahat, Johor, Malaysia 3 Centre for Applied Internet Research, Glyndwr University, Wrexham LL11 2AW, Wales, UK
Abstract— This work presents the development of a new approach of modelling the source excitation and the penetration of structures by continuous propagating electromagnetic (EM) plane waves. The technique incorporates the solution of time-dependent Maxwell’s equations and the initial value problem as the structures are illuminated by the plane waves. The propagation of waves from source excitation is simulated by solving a finite-difference Maxwell’s equation in the time domain. Subgridding method is used to condense the lattice at the point of interest locally for observing field distribution in high resolution. The computational burden due to huge number of time steps has been eased by employing quasi-static approach. An example of induced EM fields near an underground pipeline runs parallel to a 132 kV overhead power transmission line (OHTL) has been presented which paves the way in the development of new approach of EM fields interaction modelling. 1. INTRODUCTION
Finite-difference based on integral formulation [1, 2] has been used in the published literature to improve the accuracy of the finite-difference formulation near the surfaces that does not fit in the lattice or small objects such as thin wires which alter the electromagnetic field distribution significantly. In this case, analytical expressions have been established to express the field near a particular object for precise evaluation of the integrals. Many researchers in the past have been prompted to investigate the subgridding technique as an approach to circumventing the problem [3, 4]. The first advantage of using this method is simple to implement for complicated dielectric or metal structures due to arbitrary electrical parameters can be assigned to each cell on the grid. Second, the entire computational spaces need not to be discretised with a fine grid as it puts unreasonable burden on the computer processing time. The ultimate objective of research in this area is to access the appropriateness of the method in determining the amount of EM penetrating fields between OHTL and underground utility pipeline. The aim of the present work is to develop the general code for solving the electric and magnetic fields within arbitrary metal or dielectric structures, while maintaining a boundary of uncertainty low reflection level in two-dimensional approach. FDTD technique has been well known over the years of its strength with robust simulation technique for transient electromagnetic interactions. In this research work, two-dimensional FDTD technique is used with subgridding to model the utility pipeline and the overhead high voltage power transmission line. FDTD technique has been applied to the high voltage power transmission line analysis in the published literature. Dedkova and Kriz [5] proposed a new effective approach to evaluate the distribution of voltage and current along the nonlinear transmission line by using FDTD method. An improved technique was proposed by Tang et al. [6] to calculate the transient inductive interference in underground metallic pipelines due to a fault in nearby power lines. The frequency-dependent problem in the analysis of transient interference was solved in phase domain based on FDTD method. Lu and Cui [7] used FDTD method to calculate the wave processes of voltage and current distributed along the three-phase 500 kV busbars and the power lines without load in the substation of multi-conductor transmission lines (MTL). The iterative formulas were presented to determine the boundary conditions at the node of the branches. The work was extended to transmission line network and non-uniform line [8]. 2. METHOD
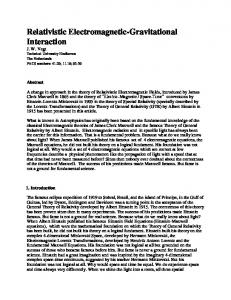
Figure 1 depicts the cross section and the dimension of a common corridor in which a buried utility pipeline runs parallel to a 132 kV overhead power transmission line. The height from the ground to the bottom conductors was 15 m. The overhead ground wire was located at the top of the tower. In this case, the height to the earth surface is 27 m. The phase conductors for the bottom, middle and
Progress In Electromagnetics Research Symposium Proceedings, Marrakesh, Morocco, Mar. 20–23, 2011 1479
Figure 1: Outline of standard circuit 132 kV steel lattice transmission high voltage suspension towers (not to scale).
top were collocated horizontally with a separation of 4.0 m, 4.5 m and 4.0 m respectively between two adjacent conductors. The three phase steel lattice transmission high voltage suspension tower was designed with 6 cables. These cables were used as the source signal which propagates inside the problem space. Each of the 2 cables carries the same phase of the AC current. The simulation was carried out using the quasi-static FDTD at the transformed intermediate frequency of 460 kHz and the overall model was then transformed back to the proposed lower frequency of 50 Hz. Quasi-static approximation was obtained by using the expression [9–11]: ³ ω ´ · σ 0 (f 0 ) + jω 0 ε (f 0 ) ¸ ¡ ¢ ~ ~ 0 f0 E (f ) = E (1) ω0 σ (f ) + jωε (f ) ~ (f ) is the resultant internal electric field (V/m), E ~ 0 (f 0 ) is the scaling internal electric where E 0 field (V/m), f is the frequency of interest (Hz), f is the scaling frequency (Hz), ω is the angular frequency of interest (s−1 ), ω 0 is the scaling angular frequency (s−1 ), σ is the conductivity of the object (S/m), and σ 0 is the scaling conductivity of the object (S/m). By assuming ωε (f ) ¿ σ (f ) and ω 0 ε0 (f 0 ¿ σ 0 (f 0 ), then Equation (1) can be approximated as follows [9–11]: · 0 0 ¸ f σ (f ) ~ 0 ¡ 0 ¢ ∼ ~ E (f ) = E f (2) f 0 σ (f ) Sinusoidal wave excitation of 460 kHz (λ = 652.17 m) was applied at each of the power transmission line cables. The pipeline was separated at a distance of 100 m from the steel lattice suspension towers and buried 2 m beneath the surface of the earth. The soil in the common corridor was designed to be inhomogeneous. The computational region at the coarse grids was discretised at a spatial resolution of 2,609 cells per wavelength (∆y = ∆z = 25 cm). Subgridding involves local mesh refinement in the pipeline and some part of the ground in order to determine the propagation of the waves inside that area while observing the change in the fields. The computational space for the main region was 521 cells ×145 cells (130.25 m×36.25 m). The computational space for subgrid area was 10 cells ×10 cells. The ratio of the coarse to the fine grids was 4 : 1. 3. SIMULATION RESULTS
Subgrid technique was validated by illustrating example in Fig. 2. The problem space was excited by sinusoidal wave source at 1800 MHz. The fields at the same point without subgrid (Fig. 2(a)) and with subgrid (Fig. 2(b)) were observed and compared. In addition, they were found to be identical to each other as depicted in Fig. 3. The computation efforts can be reduced using quasi-static method due to the largest computational size was less than 0.2λ. The simulation was carried out by assuming normal condition
PIERS Proceedings, Marrakesh, MOROCCO, March 20–23, 2011
1480
(a)
(b)
Figure 2: Problem space: (a) without subgrid, (b) with subgrid.
(a)
(b)
Figure 3: The electric field at one point without subgrid (Ez ) and with subgrid (Ezg ): (a) when sinusoidal wave was excited, (b) when gaussian pulse was excited.
Figure 4: The electric field Ez distribution in the main FDTD grid.
of OHTL. Fig. 4 illustrates the electric field distribution in the main FDTD grid. The EM wave propagates from the 6 cables of the suspension tower to the surrounding area of air, ground and the pipeline. It varies from 1.0 V/km (0 dBV/km) to 1.78 × 10⁹ V/km (185 dBV/km). The fields inside the metallic pipeline were found to be zero as depicted in Fig. 5(a) due to the excess electrons at the surface of the metal preventing any incoming propagating waves from penetrating the pipeline. The electric field distribution surrounding the pipeline alters from 3.16 V/km (10 dBV/km) to 1.0 × 10³ V/km (60 dBV/km). Some of the waves were reflected back to the surface of the ground thus producing induced EM fields as shown in Fig. 5(b). The results were verified by comparing them with [12] which shows good agreements. Phase imbalance in the line may be produced due to the difference in the relative distance of each phase from the nearby pipeline. Under fault condition, the currents on the faulty phases of transmission lines were high. This in turn will induce AC voltage on the pipeline and create shock hazard rather than corrosion.
Progress In Electromagnetics Research Symposium Proceedings, Marrakesh, Morocco, Mar. 20–23, 2011 1481
(a) (b) Figure 5: (a) The electric field Ezg distribution in the subgrid section. (b) The induced electric field Ez at 1.75 m above pipeline.
4. CONCLUSIONS
An approach to model the interaction between overhead transmission lines and buried utility pipeline at power-line frequency has been presented. This uses the FDTD technique for the whole structure of the problem combined with subgridding method at the object of interest. The computational burden due to huge number of time steps in the order of tens of millions has been eased to tens of thousands by employing the method called quasi-static approach. The use of inhomogeneous soil in the common corridor permits a non-trivial proximity region of authentic ground properties to be simulated. Profound investigation of the interaction between electromagnetic fields and natural or utility arrangement with different electrical characteristics at different level of spatial resolution can be assisted by such tools. The combination of frequency scaling FDTD subgridding approach with arbitrary inhomogeneous soil element model paves the way in the development of new approach of EM fields interaction modelling. ACKNOWLEDGMENT
The financial support from Ministry of Higher Education Malaysia and Universiti Tun Hussein Onn Malaysia (UTHM) is gratefully acknowledged. REFERENCES
1. Taflove, A. and S. C. Hagness, Computational Electrodynamics: The Finite-Difference TimeDomain Method, 3rd Edition, Artech House, Boston, 2005. 2. Shreim, A. M. and M. F. Hadi, “Integral PML absorbing boundary conditions for the highorder M24 FDTD algorithm,” Progress In Electromagnetics Research, Vol. 76, 141–152, 2007. 3. Ramli, K. N. and R. A. Abd-Alhameed, “Modelling of complex electromagnetic problems using FDTD subgridding methods,” 9th Informatics Workshop for Research Students, 200– 201, University of Bradford, UK, 2008. 4. Wang, S. M., F. L. Teixeira, R. Lee, and J. F. Lee, “Optimization of subgridding schemes for FDTD,” IEEE Microwave and Wireless Components Letters, Vol. 12, 223–225, 2002. 5. Dedkova, J. and T. Kritz, “FDTD analysis of a nonlinear transmission line,” Proceedings of Progress In Electromagnetics Research Symposium, 282–285, Beijing, China, 2009. 6. Tang, J., X. Cui, L. Qi, T. Lu, L. Li, P. Zhu, G. Yang, and W. Zhang, “Analysis of transient inductive interference in underground pipelines due to faults on nearby power lines,” COMPEL: The International Journal for Computation and Mathematics in Electrical and Electronic Engineering, Vol. 26, 1346–1363, 2007. 7. Lu, T. and X. Cui, “Transient analysis of wave processes for multi-conductor transmission lines with branches using FDTD,” IEEE International Symposium on Electromagnetic Compatibility, Vol. 2, 699–703, 2000. 8. Lu, T., L. Qi, J. Li, and X. Cui, “Application of multi-conductor transmission lines on the transient analysis in power substation,” Asia-Pacific Conference on Environmental Electromagnetics, 198–201, 2003.
1482
PIERS Proceedings, Marrakesh, MOROCCO, March 20–23, 2011
9. Guy, A. W., S. Davidow, G. Y. Yang, and C. K. Chou, “Determination of electric current distributions in animals and humans exposed to a uniform 60-Hz high-intensity electric field,” Bioelectromagnetics, Vol. 3, 47–71, 1982. 10. Golestani-Rad, L., B. Elahi, and J. Rashed-Mohassel, “Investigating the effects of external fields polarization on the coupling of pure magnetic waves in the human body in very low frequencies,” BioMagnetic Research and Technology, Vol. 5, 1–5, 2007. 11. Gandhi, O. P. and J. Chen, “Numerical dosimetry at power-line frequencies using anatomically based model,” Bioelectromagnetics, Vol. 13, 43–60, 1992. 12. Amer, G. M., “Novel technique to calculate the effect of electromagnetic field of H.V.T.L. on the metallic pipelines by using EMTP program,” 18th International Conference and Exhibition on Electricity Distribution (CIRED), 1–5, Turin, Italy, 2005.