Apr 11, 2010 - taneously achieved for microwave fields by using a fluxonium superconducting circuit. ..... van der Wal, and S. Lloyd, Science 285, 1036 (1999).
Electromagnetically-induced transparency with amplification in superconducting circuits Jaewoo Joo,1 J´erˆ ome Bourassa,2 Alexandre Blais,2 and Barry C. Sanders1
arXiv:1004.1817v1 [quant-ph] 11 Apr 2010
1
Institute for Quantum Information Science, University of Calgary, Alberta T2N 1N4, Canada 2 D´epartement de Physique, Universit´e de Sherbrooke, Sherbrooke, Qu´ebec J1K 2R1, Canada (Dated: April 13, 2010)
We show that electromagnetically-induced transparency and lasing without inversion are simultaneously achieved for microwave fields by using a fluxonium superconducting circuit. As a result of the ∆ energy-level structure of this artificial three-level atom, we find the surprising phenomenon that the electromagnetically-induced transparency window in the frequency domain is sandwiched between absorption on one side and amplification on the other side. PACS numbers: 42.50.Gy, 42.50.Md, 74.50.+r
Electromagnetically-induced transparency (EIT) exploits atomic coherence to enable optically-controlled transparency within an absorption line as well as extreme slowing of light [1]. EIT is realized by strong driving of one transition in a three-level atom (3LA) depicted in Fig. 1, which induces a transparency window with bandwidth equal to the effective splitting of the upper energy level. A 3LA also yields a distinct phenomenon known as lasing without inversion (LWI) [2], which corresponds to negative absorption (i.e. amplification) despite the lowerlevel population exceeding the upper-level population. LWI arises through two interfering excitation pathways thereby suppressing absorption. Here we show that EIT and LWI can be realized simultaneously (as EIT with amplification, or EITA) via a 3LA with all three inter-level transitions being driven in a ∆ configuration (a ∆3LA). Furthermore we show that this new phenomenon can be realized with flux [3] or fluxonium [4] artificial atoms, which are solid-state realizations of ∆3LAs [5]. Our theory of EITA predicts asymmetric EIT peaks, commensurate with experimental observations of an anomalous asymmetry of EIT peaks for Rb ∆3LAs [6]. We construct a theory of EITA and build on recent advances with Josephson-junction-based artificial atoms to show how EITA can be achieved and what its experimental signature will be. There are subtleties though in transferring optical atomic experiments to the superconducting circuit domain. In particular the superconducting circuit employs microwave fields that propagate in one dimension in contrast to three-dimensional field propagation and optical frequencies in the atomic experiment. Therefore absorption and transmission spectroscopy translate to reflected and transmitted fields. Also optical experiments employ a large number of 3LAs whereas the superconducting circuit case needs just one 3LA. With EIT and the Autler-Townes splitting having been displayed in experiments, artificial ∆3LAs built with superconducting junctions appear to be good candidates for observing EITA [7–10]. The ∆3LA depicted in Fig. 1 has three energy lev-
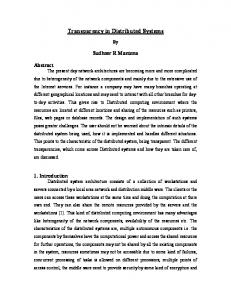
FIG. 1: (Color Online) A ∆3LA system with driving fields indicated by solid arrows (blue and red), decays by dashed lines and frequency differences between levels by dotted lines.
els |ii with frequency differences ωij and decay rates γij between levels |ii and |ji for i, j ∈ {1, 2, 3}. The |ii ↔ |ji transition is driven by a coherent electromagnetic field with electric field Eij and detuning δij from the |ii ↔ |ji transition with electric dipole vector dij . The corresponding (complex) Rabi frequency is Ωij = dij ·Eij (~ ≡ 1). Away from the flux degeneracy point, selection rules do not apply to this one-dimensional superconducing circuit so all dipole transitions can be driven by applying a trichromatic microwave field tuned near each of the ωij [5]. For σ ˆij := |ii hj|, the system Hamiltonian is ˆ = H
3 X i=1
ωi σ ˆii −
� 1 X� Ωij e−i(ωij +δij )t σ ˆij + hc , (1) 2 i>j
with hc denoting the Hermitian conjugate. For a rotating frame and taking δ12 = δ13 − δ23 , Eq. (1) is replaced by ˆ int = − H
3 X i=2
δ1i σ ˆii −
1X (Ωij σ ˆij + hc) . 2 i>j
(2)
Energy relaxation and dephasing caused by coupling to uncontrolled degrees of freedom are described by a
2 0.2
0.2
0.0
Im
Im
0.1
a)
0.2
Re
0.2
-0.1
0.0
4
2
0
2
4
b)
0.2 1.0
FIG. 3: (Color online) Absorption vs detuning as obtained from the steady-state of Eq. (3) for Φ equal to 0 (solid blue line), π/2 (dashed red line), π (dotted green line) and 3π/2 (dash-dotted yellow line). Parameters are the same as in Fig. 2.
0.8 0.6
c) 4
2
0
2
4
FIG. 2: (Color online) a) Absorption, b) dispersion and c) population inversion vs detuning δ13 /γ13 for EIT (red dashed lines), LWI (yellow dotted lines) and EITA (blue solid lines) for 10γ12 = γ13 , γ23 = γ12 , δ23 = 0, and 5Ω13 = 5Ω12 = γ13 and Ω23 = γ13 .
Lindblad-type master equation ˆ int , ρ] + ρ˙ = −i[H =: Lρ
0.0
X i 0 causes Autler-Townes splitting of level |3i yielding two absorption peaks at δ13 /γ13 = ± |Ω23 | /2Γ3 for Γ3 = (γ13 +γ23 + γφ3 )/2 with a transparency window centered at δ13 = 0 and full-width at half-maximum FWHM = γ12 + γφ2 + |Ω23 |2 /2Γ3 [12]. Optical dispersion and absorption are quantified, respectively, by the real and imaginary parts of the first-order susceptibility [10] χ(1) ∝ |d13 |2 ρs31 /Ω13 with ρsij = hi|ρs |ji the steady-state solution of the master equation. Hence dispersion and absorption are proportional to Re[ρs31 ] and Im[ρs31 ], shown in Figs. 2(a,b) for EITA, EIT (Ω12 = 0) and LWI (Ω13 = 0). As expected, these dispersion and absorption curves are related by the Kramers-Kronig relation. The EIT absorption curve exhibits a transparency window between two Autler–Townes peaks, and the linear dispersion curve in Fig. 2(b) indicates that the group velocity is constant in this window. The LWI absorption curve shows the characteristic transparency at resonance with absorption in the red-detuned (left) region and amplification (or negative absorption) in the blue-detuned
(right) region. EITA exhibits the transparency window characteristic of EIT but with the LWI feature that the window is bounded by an absorption and an amplification peak rather than by two Autler-Townes absorption peaks. Fig. 2(c) confirms that population inversion ρs11 − ρs33 is always positive for EIT, LWI and EITA so amplification is not due to population inversion. In fact, EITA is not a simple combination of EIT and LWI as coherence between each pair of levels adds to the richness of the phenomenon. Due to inter-level coherence, controlling the relative phase of (at least) one field with respect to the other two affects whether amplification is in the red- or blue-detuned region or even whether there is amplification at all, as depicted in Fig. 3. This control becomes evident by taking ρs23 ≈ 0 [13]: � s −iφ13 2iΩ13 (ρs11 − ρs33 ) (iδ13 − γ12 /2) ρ31 = − e � (4) −i(φ12 +φ23 −φ13 ) s s + Ω23 Ω12 e (ρ11 − ρ22 ) /F, where F = 4 (iδ13 − Γ3 ) (iδ13 − γ12 /2) + Ω223 . For Φ := φ12 + φ23 − φ13 we observe that the absorption curve of Fig. 2(a) is recovered for Φ = 0. EITA is replaced by ordinary absorption for Φ = π/2 with γ12 ≪ γ13 , and the mirror image of the Φ = 0 absorption curve occurs for Φ = π. For Φ = 3π/2, the absorption curve corresponds to an EIT profile but with the transparency window replaced by an amplification window accompanied by a linear dispersion profile (not shown) so group velocity is constant for this window. Our theory of a ∆3LA is applicable to a recent EIT experiment with Rb atomic gas [6], which exhibited both transmission enhancement and asymmetry between the red- and blue-detuned transmission peaks. Their theory explains transmission enhancement but not the observed peak asymmetry. As the lower two levels of their Rb 3LA is driven by a microwave field, their system is the ∆3LA discussed here, and our theory predicts the observed peak asymmetry although, of course, a quantita-
3
16
a)
b)
t13
0.4
Matrix elements, |tij|
ω1j/2π [GHz]
14 12 10 8
0.3
0.2 t23
0.1 t12
6 0.0 -0.2 -0.1 0
0.1 0.2
Φext/Φ0
-0.2 -0.1 0
0.1 0.2
Φext/Φ0
FIG. 4: (Color online) a) Transition frequencies ωi0 /2π and b) coupling matrix elements |tij | for charge coupling in the fluxonium ∆3LA between states |ii and |ji as a function of the external flux Φext /Φ0 , with Φ0 being the flux quantum. Parameters are from Ref. [4]. We suggest biasing the artificial 3LA at Φext /Φ0 = 0.08, indicated by a dashed vertical line, where t12 = t23 , optimal for observation of EITA.
tive analysis is required to see how much of the asymmetry is due to ∆ electronic structure effects as opposed to other reasons. Although our theory also predicts negative absorption (amplification), inhomogeneous broadening and absorption in the gas cell could obscure the amplification signature. An advantage of our proposal to study EITA with superconducting artificial atoms coupled to one-dimensional transmission lines is that EITA can be investigated in a controlled way without some of the complications that arise for gases. Flux [3] and fluxonium [4] 3LAs closely approximate ∆3LAs away from flux degeneracy [5], hence are natural candidates for realizing EITA. Fig. 4(a) shows the energy levels structure of the fluxonium 3LA and Fig. 4(b) the corresponding transition matrix elements |tij |, both as a function of the externally-applied flux Φext . Away from Φext /Φ0 = 0 and 0.5, all three matrix elements have comparable values such that the fluxonium can be used as a ∆-system. Flux 3LAs have similar magnetic flux transition matrix elements [5] but are more sensitive to flux noise and tend to have the state |3i high in energy. Under these considerations, the fluxonium appears to be a promising candidate for the observation of the effect studied here. EITA can be probed by connecting either 3LA to a transmission line supporting traveling modes [14]. The absorption and dispersion profiles can be measured both in transmission and reflection, and a possible setup for homodyne measurement of the reflected signal is illustrated in Fig. 5. To determine how the reflected signal contains information about ρ31 , we use input-output the-
FIG. 5: (Color online) A fluxonium 3LA, made from the parallel combination of a Josephson junction and a large inductance, is capacitively coupled to the end of a semi-infinite transmission line and measured in reflection. A circulator is used to separate the input and the output fields. The output field is amplified (not shown) and mixed with a local oscillator (LO) to realize a homodyne measurement.
ory [15]. In the Markov approximation and focusing on the signals centered about the probe (a), pump (b) and control (c) frequencies, the transmission-line free Hamiltonian is X Z ∞ ˆ HTL = dω oˆ† (ω)ˆ o(ω) (5) o ˆ∈{ˆ a,ˆ b,ˆ c}
0
with the microwave field annihilation operators oˆ(ω) satisfying [ˆ o(ω), oˆ′† (ω ′ )] = δoˆ,ˆo′ δ(ω − ω ′ ). Treating the transmission-line mode as three commuting quasi-monochromatic modes is valid if separation between the transitions frequencies greatly exceeds the linewidths. In this approximation, the ∆3LAtransmission line interaction Hamiltonian is r Z ∞ hr γ γ23 ˆ† 13 † ˆ dω Hint =i b (ω)ˆ σ23 a ˆ (ω)ˆ σ13 + 2π 2π −∞ r i γ12 † cˆ (ω)ˆ σ12 − hc . (6) + 2π Using input-output theory, the output field operator centered at the probe frequency is a ˆout (t) = a ˆin (t) +
√ γ13 σ ˆ13 (t),
(7)
with a ˆin (t) the annihilation operator for the input field centered at the probe frequency. With the homodyne setup illustrated in Fig. 5 effectively measuring √ hˆ aout (t)i = hˆ ain (t)i + γ13 ρ31 (t), access to the dispersion and absorption profiles is straightforward. We propose to bias the fluxonium at Φext /Φ0 = 0.08, indicated by a dashed vertical line in Fig. 4, where t12 = t23 as this choice is optimal for observation of EITA. Contrary to the case of resonators [16], coupling to the transmission line traveling modes exposes the ∆3LA to environmental vacuum fluctuations of the voltage at the
4 ∆3LA transition frequencies, thereby enhacing spontaneous decay. As an estimate for the relaxation time in this case, we use Astafiev et al.’s results where a flux qubit was coupled to a transmission line with γ12 /2π = 11 MHz at zero flux [14]. Assuming white noise, the decay rates at Φext /Φ0 = 0.08 can be estimated using the matrix elements of Fig. 4, yielding γ13 /2π = 25 MHz, γ12 /2π = 2.6 MHz and γ23 /2π = 2.6 MHz. Figs. 2 and 3 have been obtained using these values, showing that EITA with superconducting ∆3LA should be possible with current experimental parameters. Another approach to probing EITA with superconducting circuits is by quantum state tomography where the density matrix is fully reconstructed. This can be done, for example, by coupling the ∆3LA to a resonator rather than a transmission line [17], and strong coupling of a flux ∆3LA to a resonator has been studied [18–20]. An advantage of this approach is that the resonator will shield the ∆3LA from noise away from the resonator frequency, thereby decreasing significantly the decay rates. In summary, we have developed the theory of EITA which shows a EIT window sandwiched between an absorption line and an amplification line in a superconducting ∆3LA system. The EITA absorption and dispersion profiles can be controlled by the phase of one of the three microwaves applied to the superconducting atom. We suggest a homodyne measurement scheme for a direct observation of the EITA absorption and dispersion profiles of the probe field where a fluxonium artificial atom is coupled to a one-dimensional transmission line. EITA is exciting as a surprising combination of electromagneticallyinduced transparency in a single system, and superconducting artificial atom realizations will enable controlled study of this phenomenon. EITA could be useful for superconducting circuits by enabling slowing and storage of microwave fields, and the amplification effect could be useful for partially offsetting absorption. This project is supported by FQRNT, NSERC, iCORE, and QuantumWorks. We thank S. Filipp for discussions about the phase control of multiple microwave drives. AB is partially supported by the Alfred P. Sloan Foundation. AB is a CIFAR Scholar, and BCS is a CIFAR Fellow.
[1] M. Fleischhauer, A. Imamoglu, and J. P. Marangos, Rev. Mod. Phys. 77, 633 (2005).
[2] S. E. Harris, Phys. Rev. Lett. 62, 1033 (1989); M. O. Scully, S.-Y. Zhu, and A. Gavrielides, Phys. Rev. Lett. 62, 2813 (1989). [3] J. E. Mooij, T. P. Orlando, L. Levitov, L. Tian, C. H. van der Wal, and S. Lloyd, Science 285, 1036 (1999). [4] V. E. Manucharyan, J. Koch, L. I. Glazman and M. H. Devoret, Science 326, 113 (2009). [5] Y.-x. Liu, J. Q. You, L. F. Wei, C. P. Sun, and F. Nori, Phys. Rev. Lett. 95, 087001 (2005). [6] H. Li, V. A. Sautenkov, Y. V. Rostovtsev, G. R. Welch, P. R. Hemmer and M. O. Scully, Phys. Rev. A 80, 023820 (2009) [7] Z. Dutton, K. V. R. M. Murali, W. D. Oliver, and T. P. Orlando, Phys. Rev. B 73, 104516 (2006); K. V. R. M. Murali, Z. Dutton, W. D. Oliver, D. S. Crankshaw, and T. P. Orlando, Phys. Rev. Lett. 93, 087003 (2004). [8] M. Baur, S. Filipp, R. Bianchetti, J. M. Fink, M. G¨ oppl, L. Steffen, P. J. Leek, A. Blais, and A. Wallraff, Phys. Rev. Lett. 102, 243602 (2009). [9] M. A. Sillanpaa, J. Li, K. Cicak, F. Altomare, J. I. Park, R. W. Simmonds, G. S. Paraoanu, and P. J. Hakonen, Phys. Rev. Lett. 103, 193601 (2009). [10] H. Ian, Y.-x. Liu, Franco Nori, arxiv:quantphys/0912.0089 (2009). [11] P. Bertet, I. Chiorescu, G. Burkard, K. Semba, C. J. P. M. Harmans, D. P. DiVincenzo and J. E. Mooij, Phys. Rev. Lett. 95, 257002 (2005). [12] E. Figueroa, F. Vewinger, J. Appel, and A.I. Lvovsky, Opt. Lett. 31, 2625 (2006). [13] With the parameters of Fig. 2, we find Max[|ρs23 |] ≈ 0.15 hence the approximation ρs23 ≈ 0 does not lead to a good quantitive analysis. [14] O. Astafiev, A. M. Zagoskin, J. Abdumalikov, Y. A. Pashkin, T. Yamamoto, K. Inomata, Y. Nakamura and J. S. Tsai, Science 327, 840 (2010). [15] C. W. Gardiner and M. J. Collett, Phys. Rev. A 31, 3761 (1985). [16] A. Blais, R.-S. Huang, A. Wallraff, S. M. Girvin, and R. J. Schoelkopf, Phys. Rev. A 69, 062320 (2004). [17] S. Filipp, P. Maurer, P. J. Leek, M. Baur, R. Bianchetti, J. M. Fink, M. G¨ oppl, L. Steffen, J. M. Gambetta, A. Blais, and A. Wallraff, Phys. Rev. Lett. 102, 200402 (2009). [18] J. Bourassa, J. M. Gambetta, A. A. Abdumalikov Jr., O. Astafiev, Y. Nakamura, and A. Blais, Phys. Rev. A 80, 032109 (2009). [19] A. A. Abdumalikov Jr., O. Astafiev, Y. Nakamura, Y. A. Pashkin, and J. Tsai, Phys. Rev. B 78, 180502 (2008). [20] T. Niemczyk, F. Deppe, H. Huebl, E. P. Menzel, F. Hocke, M. J. Schwarz, J. J. Garcia-Ripoll, D. Zueco, T. Hmmer, E. Solano, A. Marx, and R. Gross, arXiv.org:1003.2376 (2010).