IEEE CONECCT2014 1569825591
Electrooculography based B link Detection to Prevent Computer Vi sion Syndrome f d Monalisa Pal l ,a, Anwesha B anerj ee 2 ,b , Shreyasi Datta l ,c, Amit Konar l , , D . N. Tibarewala2 ,", R. Janarthanan 3 ,
I
2 3 Department of Electronics & Telecommunication Engineering, School of Bioscience & Engineering, Department of Computer Science 12 3 , Jadavpur University, TJS Engineering College 3 12 , Kolkata, Chennai, India '
[email protected], b anwesha.banerj
[email protected], C
[email protected],
[email protected], f e
[email protected], srmj ana_73 @yahoo.com
Abstract-The present work proposes an artificial system capable of preventing Computer Vision Syndrome from the analysis of eye movements. Ocular data is recorded using an Electrooculogram signal acquisition system developed in the laboratory. Wavelet detail coefficients obtained using Haar and Daubechies order 4 mother wavelets are used as signal features. From the recorded data, blinks are classified from any other type of eye movements using Support Vector Machine ( SVM) classifier with different kernel functions. We obtain a maximum average accuracy of 95.83 % over all classes and participants using second order polynomial kernel SVM classifier. Then the trained classifier has been used in real time to detect blinks. The system is designed to count the number of blinks in a particular interval of time thereby reminding people working on a computer for long periods to rest and blink frequently in case of insufficient number of blinks. We validate the method using a study on ten participants in real time. Keywords-Blink
Detection;
Computer
Vision
Syndrome;
Electrooculography; Support Vector Machine; Wavelet Transform
I.
INTRODUCTION
Computer Vision Syndrome (CVS) [ I -2] is a well known ocular disorder that affects maj ority of the working professionals and students who spend a considerable amount of time at a stretch on the computer. Prolonged focus of eyes on the computer display causes the cornea to dry up leading to eye strain, headaches, dizziness, blurred vision and fatigue. A possible therapy for avoiding CVS while not disturbing a person's working schedule is to blink more often and include breaks. Frequent blinking prevents the eyes from drying up quickly. Eye movement detection can be done using many techniques such as Infrared Video System (IRVS), Infrared Oculography (IROG), Search Coil (SC), Optical-type Eye Tracking System, Purkinj e dual-Purkinj e-image (DPI) and Electroculography (EOG) [3-4] . EOG is the simplest method among all of them. Moreover, an EOG system is fairly easy to construct using surface electrodes that are placed around the eye socket and is simple to work with in real time.
EOG signal is a measure of the potential difference between the front and back of the eye ball. Experiments reveal that there exists a linear relation between eye movement and EOG amplitude up to a certain degree. EOG can thus be used for detection of eye movements and blinks [5] . The main application of EOG signal is the detection and assessment of many ophthalmological diseases such as Retinitis Pigmentosa [6] and Best's disease [7] . EOG analysis is also done to track the progress of degenerative muscular disorders and neural diseases (e.g. Parkinson ' s, Alzheimer' s etc.) [8] . Moreover, drowsiness detection and cognitive process modeling are also different applications of EOG analysis [9] . In recent times, eye movement controlled human computer interfaces based on EOG are maj or interests of research. Traces of EOG-based control of neuro-prosthetic devices are found in the literature [ 1 0- 1 1 ] , controlling motion of computer cursor [ 1 2] and controlling wheelchair system for rehabilitation [ 1 3 ] . There have been different strategies of analyzing [ 1 4] and implementing EOG in the field of robotics [ 1 5- 1 6] . In [ 1 7- 1 9] , researchers have shown blink detection using various methods and its application in different events like fatigue monitoring, consciousness analysis during driving, etc. However, image processing methods are more complex and consume more resources than the signal processing counterparts. The present work proposes a scheme to detect the number of blinks of an individual working on a computer, over a certain period of time using EOG analysis and logging off the computer if a desirable number of blinks do not occur in that time interval. In the present work EOG is recorded using a two-channel data acquisition system from ten subj ects while they continuously worked at the computer. Wavelet Features were extracted from the acquired EOG and offline classification was carried out using Linear Support Vector Machine (LSVM), Polynomial Kernel Support Vector Machine (Poly-SVM) and Radial Basis Function Kernel Support Vector Machine (RBF SVM) classifiers to distinguish blinks from any other eye movement or fixed gaze. It was observed that better classification results were obtained from second order
Polynomial Kernel SVM classifier. Now the Polynomial Kernel SVM classifier trained offline with the fourth level haar decomposed detail coefficients of EOG is used to classify blinks in real time over a period of 30 minutes. If the number of blinks was found to be less than 3 00 it is possible that the person is likely to be affected by CVS and so he/she was instructed to blink 1 0 times within the next 10 seconds. If the number of blinks is less than 8 in this interval, the computer monitor is send to a stand-by mode to provide a period of rest. The process is resumed when the user further unlocks the computer.
amplitude and pulse duration. Even with the eye closed, the potential was observed to be the same. •
B. Feature Extraction: Wavelet Transform For extracting feature, we have concentrated on discrete wavelet transform. Wavelet transform is used to overcome the shortcoming of Fourier transform. On one hand, Fourier transform provide frequency domain analysis at a constant resolution on the frequency scale. On the other hand, Wavelet transform provides both frequency as well as time-domain analysis and at multiple resolution. Wavelet is a localized wave as the name suggests and thus convolution of a wavelet with the signal can be used to analyze the transient behavior of the concerned signal. The wavelet transform is given by ( 1 ) .
The rest of the paper is structured as follows. Section II explains the theoretical background of the features and classifiers used. In section III the methodology followed has been discussed. Section IV covers the experimental results. Finally in section V the conclusions are drawn and the future scopes of work are stated. II.
BACKGROUND
XWT (" s)
This section concisely accounts the different attributes of the EOG signal and the algorithms used for feature extraction and classification. A standing electrical potential across the eye acts like a weak battery maintaining a voltage of +0.40 to + 1 .0 mill volts. The potential difference between the cornea and the retina is due to the large presence of electrically active neurons in the retina compared to the front of the eye. Electrooculogram is the standing potential which is detected by the skin electrodes placed around the eye socket. However, the discomfort of this attachment may offset in the actual number of blinks. We aim to develop a wearable glass with embedded electrodes to overcome this difficulty which will simultaneously take care of the accurate electrode placement. When the eyes look straight ahead, a steady dipole is created between the two electrodes [20] . Some characteristics of the signal are : Typical signal magnitudes range from 5 -20 degree of eye ball movement.
flV
per
•
When the gaze is shifted in the upward direction, the positive cornea becomes closer to the upper electrode, which becomes more positive, with zero potential at the electrode below the eye, and vice versa resulting negative and positive output voltage respectively.
•
When measuring vertical movement, the potential caused by horizontal movement on the vertical electrodes is less significant compared to vertical potential.
•
The value of amplitude will be posItlve or negative depending upon the direction in which the eye is moved [2 1 ] . Head movement affects the value of the EOG signal.
•
=
I
IiJ
vl s l
f x(t).ljI . (t-' s
J dt
(1)
Here, x(t) i s the signal to b e analyzed and ljI(t) i s the mother wavelet. The analysis is done by translation (shifting) and scaling (dilation and compression) of the mother wavelet. Shifting the wavelet by , amount helps in time-domain analysis and the scaling parameter, s= l /frequency, helps in frequency domain analysis. The detailed information is obtained using dilation operation whereas compression provides global information. The sampled version of ( 1 ) results in Wavelet series. However, depending on the resolution, this takes up lot of time and resources. Thus, we rely on Discrete Wavelet Transform where the signals are passed through filters with different cutoff frequencies and different scales. The number of filter stages used gives the level of the transform. There are several mother wavelets. Depending on application and required resolution, the mother wavelet and the level of the transform are selected [22-24] .
A. Electrooculogram (EGG)
•
Blinks are short duration pulses, having comparatively high amplitude and remain unaffected by head movement artifacts.
C.
Classification: Support Vector Machine
Support vector machine (SVM) is a well-known binary supervised learning algorithm capable of classitying some test data in two different classes [25-26] . Linear SVM (LSVM) works on the principle of separating two classes of data by constructing a hyper plane within the training data points. The hyperplane is specified by ' support vectors ' that are the training data points closest to the hyperplane belonging to the two different classes. The hyperplane is constructed such that the distance margin between the support vectors, and hence the two classes is maximized. However, Linear SVM can be successfully used only in those cases where the data are linearly separable. This limitation of Linear SVM can be overcome by mapping the data into another much larger dimensional space using a kernel function, K(x,y), such that the data points become linearly-
The pulse produced by upward movement is nearly the same as produced by downward movement in both
2
separable. The frequently used kernel functions are polynomial and radial basis function (RBF) kernel [27] . The polynomial kernel is defined by (2) where d is the order of the polynomial and c is a constant trading off the influence of higher-order versus lower-order terms in the polynomial. The RBF or Gaussian kernel is defmed by (3) where 0' denotes the width of the Gaussian. In (2) and (3), x and y are two feature vectors.
The recording of the EOG signal has been done through a two channel system developed in our laboratory using Ag/AgCI disposable electrodes at a sampling frequency of 256 Hz. Only the vertical channel is used in the present work as blinks are prominently detected in this channel. The frequency range of the acquired EOG signal is below 20 Hz and the amplitude lies between 1 00-3500 micro volts [5] . A voltage gain of minimum 2000 is needed.
(2)
K(x, y) (xT y + C)d =
The collected signal from the electrodes is fed to instrumentation amplifier, implemented by IC AD620, having a high input impedance and a high CMRR followed by a second order low pass filter with a cut off frequency of 20Hz which eliminates undesirable data. IC OP07s are used for filter design. Different stages of the filter provide various amounts of gain. Amplifier has a gain of 200 and a gain of l O is provided by the filter. Thus an overall gain of 2000 is obtained. For any kind of bio-signal acquisition, isolation is necessary for patient's as well as instrument' s safety. Power isolation is provided by a dual output hybrid DC-DC converter (MAU 1 08) and signal isolation is achieved by optically coupling the amplifier output signal with the next stage through HCNR 200. For conversion of the signal in digital format, National Instruments ADC is used with the circuit which shows a step size of 1 .22 milli volts while quantization.
(3) III.
METHODOLOGY
The methodology followed during the course of work has been illustrated in Fig. I . EUl i
Tral lled
Wl i value�
� y
B. Filtering " Poss i bi l i ty or CV�
To eliminate undesirable noise and obtain EOG in the frequency range of 0 . 1 to 1 5Hz, the range where maximum information is contained, we implement band pass filtering. A Butterworth band pass filter in the specified frequency range has been used for this purpose.
l V S
Fig. l . Flowchart depicting course of work
C.
A. Data Acquisition 1) Experimental Paradigm :
Feature Extraction & Classification 1) Offline Training
For our application, we note that the EOG signal consists of pulses and different times corresponding to different eye movements. Thus, we have used Haar as the mother wavelet for constructing one feature set. Haar is known to belong to the family of Daubechies wavelet. Haar is the simplest Daubechies wavelet of order 1 . Another feature-set is also constructed using Daubechies wavelet of order 4. The sampling rate of EOG device is 256 Hz. But we note that most of the useful information is limited to the band of O. I - 1 5Hz. Thus, a four level transform on the filtered EOG signal from vertical channel provides us with the required information. We have used the detail coefficients at this level as a feature.
The EOG data is collected from ten subj ects, five male and five female in the age group of 25±3 years. The data acquisition was done for 5 consecutive days to include any variation caused by human factor in the data-set used for training the classifier. Following the training, ten people are monitored who daily work more than three hours on the computer. After explaining the procedure and the objective of study, a consent form was filled up by all the subj ects. An audio visual stimulus is shown to the subj ects for acquiring EOG data for training the classifiers. As the EOG signal from the vertical channel can discriminate blinking from staring, looking up and looking down, we consider the cue in the form of 1 0 consecutive samples of blink, followed by 1 0 consecutive samples o f no-blink (stare/up/down alternatively) i.e. in the sequence blink-stare-blink-up-blink-down. For each eye movement sample, EOG values of 1 second duration are recorded. Thus, we have a large database for training consisting of 5 x 1 O x 6 x 1 0=3000 samples. The data was acquired in an airy room where the stimulus was shown on a screen using a projector.
During the training phase, the different SVM classifiers (linear SVM, polynomial kernel SVM, RBF-kernel SVM) are trained for binary classification. For polynomial kernel, the order of polynomial, d, is considered to be 2 and the constant, c, is assumed to be zero. For RBF kernel a is considered as 1 . The two classes in which the data is classified are Blink and No-Blink. After classification, from the resulting confusion matrix, several performance indicators are noted. Second order Polynomial Kernel SVM was found to provide the optimum results with the feature set obtained using haar as the mother wavelet. The training of the classifier is demonstrated in Fig. 2.
2) Data Acquisition System :
3
EOG data
time-out occurs which is decided by the e value. The count is returned the program calling this module.
Pre-proce ss i ng, F cature Extraction, C l ass i fi cat io n
D. Performance Analysis After classification, the confusion matrix is constructed. From the confusion matrix, the accuracy (4), sensitivity (5) and specificity (6) are noted as performanc� metrics. F o� good . . classification, the accuracy is close to 1 00 Yo, the sensItIvIty and the specificity tends to 1 .
Fig. 2. Training module
Accuracy
2) Online Blink Detection The algorithm adopted during the recognition and prevention of CVS in real-time scenario is outlined in Fig. 3 . The execution o f the module begins with the computer startup. The eye movements are monitored over an interval (8) of approximately 3 0 minutes (3 0 x 60=1 800seconds). The num? er of blinks made by the person in that duration is counted usmg the counting module called with 8= 1 800. A healthy individual in properly conditioned light and air blinks 1 8-22 times in a minute while at rest. People afflicted by CVS have reduced blink rate of around 6-7 blinks per minute [28] . Thus, a threshold of 1 0 blinks per minute is chosen to prevent CVS for a person working on computer in a concentrated manner. If the count of blinks in 3 0 minutes exceeds 300 ( 1 0 x 3 0=300), the person is unlikely to be afflicted by CVS . In case th: cou�t . does not exceed 300, the person is alerted to blmk 1 0 tImes m the next 1 0 seconds. For counting the number of blinks the counting module is called again with 8= 1 0 . [f there is at least 80% success rate, the process continues to iterate in a similar manner. [f the count is 7 or less, the computer goes to stand-by mode forcing the subj ect to break concentration and simultaneously saving the state of work in the computer. When the computer is again manually unlocked, the process resumes.
�� ���lth I I
'I'
COUll! 'I' y
coullPJWi 1\
"rompl to I3 l 1 n k I U l i m e.
TP + TN TP + FN + TN + FP
Sensitivity
Specificity .
x
1 00 0Yo
FN
=
1
=
1-
FP
---
T i nle-U
�
(6)
TN + FP
CO LU1 1 -O .
Is COUIlP7"!
r
(5)
In (4-6), the terms represent the number of samples classified as true positive (TP), true negative (TN), false positive (FP) and false negative (FN). For good re �ults, the Sensitivity specifies how much perfectly the classIfier can identify a blink as blink. While the precision with which a non blink movement of the eye is classified as no-blink is indicated by Specificity. [f detected number of blinks is more than its actual number of occurrence, CVS detection is skipped. It is less detrimental to detect CVS when it is absent than to skip the detection when it actually occurs. The performance of the system can be enhanced if most of the non-blink movements are correctly identified. Thus, for the concerned work, the specificity is a much more important metric than sensitivity.
�
Y
(4)
TP + FN
Stop
Start ca
=
N
1
P re - p rocessi n g_
COUll!
Feat u re EX l Tac t ion
I
WIth
Ca l l ( I ) (j= i U
Tra i ned
C l as s i fi e r"
1
B l i n ),"!
Fig. 3 . Flowchart of the online module
The block used for counting the number of blinks within an interval of slightly more than e seconds is illustrated in Fig. 4. EOG data of I sec is acquired; filtered and discrete wavelet transform is applied. The classifier trained offline is used to c1assity whether an eye movement is a blink or not. If it i s . blink the count is incremented by I . The process loops untIl
N
>------. T i nle-T i nle+ I
Fig. 4. Module for counting blinks
4
IV.
The feature-sets are then classified into blink and no-blink class using the following classifiers, LSVM, Poly-SVM and RBF-SVM; and the average value of the performance metrics alongwith the timing complexity are noted in Table I.
EXPERIMENTAL RESULTS
The EO G acquired in the training phase has 10 second duration of blinks followed by 10 second duration of non-blink eye movement. The acquired EO G signal of two such observations is plotted against time in Fig. Sa.
As we note from Table I, feature-set produced with haar and classified using second-order polynomial kernel SVM outperforms the other algorithms considered. A comparison of accuracy with the suggested method and the method used by previous researchers for blink detection is provided in Table II. As noted from Table I and II the proposed method yields optimum result trading off with time and accuracy.
(a)
The classifier trained in the offline mode is used for online classification of blink to detect the possibility of CVS . In the online mode, a web camera is used to track the actual blinks of the individual.
(b)
Fig. 5. EOG signals from Subject l over a duration of 10 seconds (a)Acquired EOG and (b)Filtered EOG
The obtained signal is then filtered using a band-pass Butterworth filter. The amplitude versus time plot of the signal obtained after filtering is shown in Fig. Sb for 1 0 consecutive blinks and no-blinks samples.
TABLE II. COMPARISON OF CLASSIFICATION RESULTS Methods
I ": � .0.5
'1
,R .3
E
i
d
2
"
G
a
I n d � ;III _ !oo
(a )
10
14
1'2
1
0 1
0
-0 1
-0 2 e
10
12
I n d• • _ >
(0)
16
16
20
22
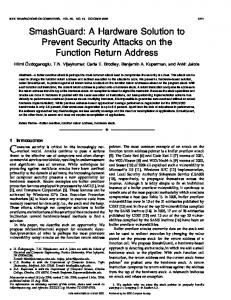
Fig. 6. Wavelet detail coefficients at level 4 decomposition of EOG from Subject 1, (a)using Haar and (b)Daubechies order 4 mother wavelet
Discrete wavelet transform is applied on the filtered data as a feature extraction algorithm. The variation of detail coefficients for a blink and a no-blink trial, obtained from level-4 decomposition using Haar as the mother wavelet is plotted Fig. 6a. A similar plot for coefficients considering db4 as mother wavelet is shown in Fig. 6b.
.\OJ -
haar
db4
Vari ation of binks over first 30mins i nterva l
_ ';"':'lu;I _ )3t�c.t;� 1 AER-l.83% 3.9
1
Sensitivity
Specificity
LSVM
85.00
0.8
0.9
0.9503
Poly-SVM
95.83
0.9 17
1
0.8 1 1 0
RBF-SVM
8 1 .67
0.9
0.767
0.7722
LSVM
76.67
0.8
0.733
0.9697
Poly-SVM
82.00
0.9
0.7
0.7797
RBF-SVM
72.50
0.767
0.6
0.7074
94 95.83
Variation of bl ink. over s ecC/ld 30min. i nterval
fIl
iCO
2
�
£.
Subjects �
e.
7
8
3
1
]
?
3
.::.
SUbjects �
f,
i
8
3
]
Fig. 7. Actual and classified number of blinks and AER
Time (s)
Accuracy (%)
Classifier
95.3
�- hJ�d i li !� "' H �h'ilh
TABLE 1. OFFLINE CLASSIFICATION RESULTS Feature (mother wavelet)
84
The actual and the detected number of blinks for ten subj ects over two consecutive 30 minutes intervals are plotted in Fig.7 and in Fig. 8 . The values over each of the double bar in the graph in Fig. 7 indicates the error rate which is given by the ratio of absolute value of the difference between actual and detected samples to the actual number of samples and is expressed as a percentage. The average error rate (AER) over the ten subj ects is also noted for each of the 30 minutes duration. We note that the error rate decreases as the subj ect gets adapted to the system.
02
6
Accuracy (%)
Assistance for the paralyzed using eye blink detection [I 7] Driver's eye blinking detection using novel color and texture segmentation algorithms [ 1 8] A Statistical Modeling based System for Blink Detection in Digital Cameras [ 1 9] Proposed Method (EOG analysis. level-4 haar wavelet transform, Second order Poly-SVM)
Va nation of binks eNer fi rst 30mins interval J)) 36
�
42 2
Variation
-10
E 3ro "5 ]00 :c o Z
27
of blinks over secon d 30m i n s inteol.1
-3
12
-3
1 7 22
""
Fig. 8. Actual and classified number of blinks and POC
5
Similarly, the double bars in Fig. 8 are labeled with the possibility of CVS (PaC) which is the difference between classified number of samples and the selected threshold of 300 blinks. A positive pac indicates that CVS can be avoided with a degree proportional to its magnitude. A negative pac recognizes a subj ect as CVS-prone. We note the subj ects for whom CVS is detected in the first 3 0 minutes span tend to blink more often in the next 30 minutes period to avoid CVS .
[ 1 0] [11]
[12]
V.
CONCLUSIONS AND DISCUSSIONS
In this work a simple and novel scheme is proposed to prevent CVS by detecting and counting blinks over a period of time, analyzing the EOG signal. Feature extraction was accomplished by level 4 wavelet decomposition of the EOG signal using Haar and order 4 Daubechies as mother wavelets. In the offline mode, binary classification was performed on the two acquired set of detail coefficients to distinguish between blinks and non-blink eye movements using linear, polynomial and Radial Basis Function (RBF) kemelized Support Vector Machine (SVM) classifier. The best classification accuracy of 95.83% was achieved haar as the mother wavelet and polynomial-SVM as the classifier. This trained classifier was chosen for real-time classification of EOG signals. The system causes the computer to go to a standby mode when the desired number of blinks is not attained over a predetermined period of time, thereby allowing the computer user to rest his/her eyes. Real-time implementation of the proposed algorithm was carried out on 10 subj ects. The performance of the system was validated by noting that the AER over each 30 minutes interval and the pac over each subj ect reduces as time progresses.
[13] [ 14] [ 1 5]
[ 1 6]
[ 1 7] [ 1 8] [ 1 9] [20]
ACKNOWLEDGMENT
This study has been supported by Council of Scientific and Industrial Research (CSIR), India and Jadavpur University.
[2 1]
REFERENCES
[22]
1. Anshel, "Computer vision syndrome", Visual Ergonomics, vol. 23, 200 1 . [2] C. Blehm, S. Vishnu, A. Khattak, S. Mitra and R.W. Yee," Computer vision syndrome: a review", Survey of ophthalmology, vol. 50, no. 3, pp. 253-262, 2005. [3] L. R. Young and D. Sheena, " Survey of eye movement recording methods", Behavior Research Methods & Instrumentation, 7(5), pp. 397429, 1975. [4] L. Y. Deng, C. L. Hsu, T. C. Lin, 1. S. Tuan and S. M. Chang, "EOG based Human-Computer Interface system development", Expert Systems with Applications, vol. 37, no. 4, pp. 333 7-3343, 20 10. [5] S . Roy Choudhury, S . Venkataramanan, B. Nemade Harshal and 1.S. Sahambi, "Design and Development of a Novel EOG Biopotential Amplifier", IJBEM, vol. 7, no. 1 , 2005. [6] P. Stavrou, P. A. Good, E. 1. Broadhurst, S. Bundey, A. R. Fielder and S. J. Crews, "ERG and EOG abnormalities in carriers of X-linked retinitis pigmentosa", Eye, vol. 1 0, no. 5, pp. 5 8 1 -589, 1996. [7] A. 1. L. G. Pinckers, M. H. M. Cuypers and A. L. Aandekerk, "The EOG in Best's disease and dominant cystoid macular dystrophy (DCMD) ", Ophthalmic genetics, vol. 17, no. 3, pp. 103-108, 1996. [8] O. Rascol, M. Clanet, J. L. Montastruc, M. Simonetta, M. J. Soulier Esteve, B. Doyon and A. Rascol, "Abnormal ocular movements in parkinson's disease evidence for involvement of dopaminergic systems ", Brain, vol. 1 12, no. 5, pp. 1 1 93-12 14, 1 989. [9] E. Magosso, M. Ursino, A. Zaniboni, F. Provini and P. Montagna, "Visual and computer-based detection of slow eye movements in [1]
[23]
[24] [25] [26] [27] [28]
6
overnight and 24-h EOG recordings", Clinical neurophysiology, vo. 1 1 8, no. 5, pp. 1 1 22- 1 133, 2007. L. Deng, C. Hsu, T. Lin, 1. Tuan and S . Chang, "EOG-based Human Computer Interface system development", Expert Systems with Applications, pp 3337-3343, 20 10. E. Lanez, A. Ubeda and 1. M. Azonn, "Multimodal human-machine interface based on a brain-computer interface and an electrooculography interface", Annual International Conference of Engineering in Medicine and Biology Society, pp. 4572-4575, 201 1 . J Keegan, E . Burke, J . Condron and E . Coyle, "Improving Electrooculogram based Computer Mouse Systems : the Accelerometer Trigger", Bioengineering In Ireland, 20 1 1 . R. Barea, L . Boquete, M . Maw, E . L6pez and L . M . Bergasa, "EOG guidance of a wheelchair using neural networks", IEEE International Conference on Pattern Recognition, vol. 4, pp. 668-67 1 , 2000. T. Wissel, R. Palaniappan, "Considerations on Strategies to Improve EOG Signal Analysis", International Journal of Artificial Life Research, 201 1 . E . Cinar and F . Sahin, "EOG controlled mobile robot using Radial Basis Function Networks", IEEE International Conference on Soft Computing, Computing with Words and Perceptions in System Analysis, Decision and Control, pp. 1 -4, 2009. D. Valbuena, M. Cyriacks, O. Friman, I. Volosyak and A. Graser, "Brain-Computer Interface for high-level control of rehabilitation robotic systems", Tenth International Conference on Rehab. Robotics, pp. 6 19-625, 2007. A. Udayashankar, A. R. Kowshik, S . Chandramouli and H. S. Prashanth, "Assistance for the Paralyzed Using Eye Blink Detection", Fourth International Conference on Digital Home, pp. 1 04-108, 20 12. A. A. Lenskiy and 1. S . Lee, "Driver's eye blinking detection using novel color and texture segmentation algorithms ", International Journal of Control, Automation and Systems, vol. I 0, no. 2, pp. 3 1 7-327, 20 12. P. Corcoran, I. Bacivarov and M. C. lonita, "A statistical modeling based system for blink detection in digital cameras ", International Conference on Consumer Electronics, pp. 1 -2, 2008. A. W. North, "Accuracy and precision of electrooculographic recording", Invest. Ophthalmol., vol. 4, pp. 343-348, 1965. A. Bane�jee, S . Chakraborty, P. Das, S . Datta, A. Konar, D.N. Tibarewala and R. Janarthanan, "Single channel electrooculogram(EOG) based interface for mobility aid" , Fourth International Conference on Intelligent Human Computer Interaction, 2012. R. Panda, P. S. Khobragade, P. D. Jambhule, S . N. Jengthe, P. R. Pal and T. K. Gandhi, "Classification of EEG signal using wavelet transform and support vector machine for epileptic seizure diction", International Conference on Systems in Medicine and Biology, pp. 405-408, 2010. A. Phinyomark, A. Nuidod, P. Phukpattaranont and C. Limsakul, "Feature extraction and reduction of wavelet transform coefficients for EMG pattern classification", Electronics and Electrical Engineering, vol. 122, no. 6, pp. 27-32, 2012. A. Djohan, T. Q. Nguyen and W. J. Tompkins, "ECG compression using discrete symmetric wavelet transform", 17th Annual Conference on Engineering in Medicine and Biology, vol. 1, pp. 1 67-1 68, 1 995. R. Gunn Steve, "Support Vector Machines For Classification and Regression", Technical report, University of Southampton, 1 998. C. J. Burges, "A tutorial on support vector machines for pattern recognition", Data mining and knowledge discovery, vol. 2, no. 2, 1 2 1 1 67, 1998. T. Joachims, "Text categorization with support vector machines : Learning with many relevant features ", Machine Learning: ECML-98, Lecture Notes in Computer Science, pp. 13 7 -142, 1998. N. A. Charpe and V. Kaushik, "Computer vision syndrome (CVS): recognition and control in software professionals" . Journal of Human Ecology, vo. 28, no. 1, pp. 67-69, 2009.