Electrostatic flow probe and measuring system calibration for solids mass flow rate measurement. Juliusz B. Gajewski*. Institute of Heat Engineering and Fluid ...
Journal of Electrostatics 45 (1999) 255—264
Electrostatic flow probe and measuring system calibration for solids mass flow rate measurement Juliusz B. Gajewski* Institute of Heat Engineering and Fluid Mechanics, Technical University of Wroc!aw, WybrzezR e S. Wyspian& skiego 27, 50-370 Wroc!aw, Poland Received 10 December 1997; received in revised form 3 August 1998; accepted 10 August 1998
Abstract This paper presents an original system and procedure for calibrating, verifying, and testing any electrostatic (inductive), non-contact probe, sensor, or transducer, or the whole measuring system: a measuring head with a probe in its inside and an analog or digital measuring instrument connected with the head. The calibration system has been designed on the basis of the well-known method in which the Faraday pail is used for measuring the net, total electric charge as carried by charged solid particles. The method and system are described, and the results of preliminary tests are presented for granulated polypropylene and for different mass flow rates. � 1999 Elsevier Science B.V. All rights reserved. Keywords: Solids mass flow rate measurement; Electrostatic flow probe; Electric charge; Voltage; Calibration; Faraday pail calibration
1. Introduction The calibration system presented here enables both the calibration and verification or test of the electrostatic (inductive), non-contact probes, sensors, or transducers, or measuring systems intended for the continuous, real-time, indirect, non-intrusive measurement of the mass flow rate or concentration (volume loading) as well as the electric charge of solid particles that are transported pneumatically in pipes. The solids mass flow rate measurement is crucial for controlling the operation of pneumatic transport systems as well as the technological parameters of different industrial processes in which pneumatic transfer of particulates is used. To measure properly the mass flow rate without any flow disturbance, a non-contact method is employed which was described and discussed elsewhere in detail [1]. There are some
* Tel.: #48 71 320 3821; tel./fax:#48 71 328 3818. 0304-3886/99/$ — see front matter � 1999 Elsevier Science B.V. All rights reserved. PII: S 0 3 0 4 - 3 8 8 6 ( 9 8 ) 0 0 0 4 8 - 5
256
J.B. Gajewski/Journal of Electrostatics 45 (1999) 255–264
other methods similar to that presented here [2—7]. A microprocessor-based system was built on the basis of this method for the continuous and quasi-real-time measurements of the mass flow rate or volume loading and mean flow velocity of solids, and for installation in large-scale industrial operations [1]. The results of preliminary tests, as presented here, were obtained for granulated polypropylene and for different mass flow rates. The relationships between the effective (RMS) value º of the probe potential (voltage) u(t) and the net charge Q of solid particles, as measured using a Faraday pail, and between the mean mass flow rate 1mR (t)2 and the charge Q within a certain measuring time t , are established — they are � referred to as calibration curves. This gives the most important function 1mR (t)2"f (º) that permits the mean mass flow rate 1mR (t)2 on the basis of the RMS value measurement to be rather quickly and precisely determined.
2. Calibration installation The experimental calibration installation consists of a specially designed transport rig and an experimental facility built for calibrating, verifying, or testing non-intrusive measuring probes, sensors, or transducers, heads as well as the whole systems. Such probes, sensors, and transducers are the component, integral parts of different systems based on non-contact methods and built for continuous monitoring and measuring the solids mass flow rate, volume loading, flow velocity, and charge. The instrumentation used permits one to verify measuring systems and to test inductive measurement methods. The calibration and verification procedures are carried out with the use of a Faraday pail. A simple transport installation is shown in Fig. 1. The installation construction is simpler than that presented earlier [8]. The powdered or granulated material is fed into the installation from a storage solids feeder (1) through a control valve (2) in portions of the exactly known mass, as measured before and after each experiment done. In the main pipeline (3) the material is falling down through vertical and inclined pipes to reach the maximum charging level possible (a saturation state) for a given material, that is the maximum surface charge density on all the solid particles before entering the calibration system. All the charged solid particles fall down through the measuring head (4) calibrated or tested which is connected to a microprocessor-based measuring system (5). The particles then reach the Faraday pail (6) which is connected with the input of an electrometer (7) working as a voltmeter. The measuring metal ring probe used in these experiments is in the inside of the measuring head calibrated or tested and is really just the same as those described in the previous reports [1,8—10], and this probe is a non-intrusive one. The probe is mounted on a dielectric pipe section whose internal diameter is the same as that of a conveying metal pipe, and which separates the probe from the flow and is “transparent” with respect to the electric field produced by the flowing charges [1]. Such a probe construction does not disturb the two-phase gas—solid flow in any pneumatic transport pipeline at all.
J.B. Gajewski/Journal of Electrostatics 45 (1999) 255–264
257
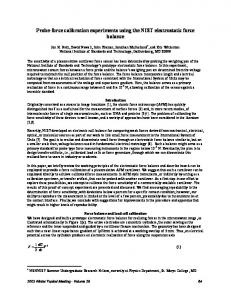
Fig. 1. Schematic diagram of the experimental installation. Description in the text.
3. Calibration system and procedure The calibration of measuring non-contact probes, sensors, or transducers, or measuring systems is carried out through measurement of the net particle charge of a powdered or granular material flowing along a pipe in portions of the well-known mass being weighed before and after each experiment. The experiments are performed using the measuring head calibrated (tested), in which inside is a probe or sensor, and the Faraday pail in the configuration, as illustrated in Figs. 1 and 2. The potential, that is induced in the metal ring probe which is used in the present experiments, is measured by means of an original microprocessor system [1,8] that has been built on the basis of a measurement method described in detail in the previous papers [11,12]. The experimental facility is being used for calibrating and verifying or testing the non-contact measuring probes, sensors, transducers, heads, or the whole systems, and is the lower part of the experimental pneumatic transport installation (Fig. 1). This set-up has two principal parts: the head calibrated or tested along with the ring probe
258
J.B. Gajewski/Journal of Electrostatics 45 (1999) 255–264
Fig. 2. Experimental stand for calibrating the measuring heads and systems. Description in the text.
inside and the Faraday pail. The head used consists of the following parts: a housing (1) that provides the mechanical support, thermal protection, and electromagnetic screening, the metal ring probe (2), a dielectric pipe section (3), and a measuring preamplifier (4) that transmits the analog electric signals of the probe to the microprocessor-based measuring system. The lower part of the set-up is the Faraday pail that has also the strong supporting housing (5). There is an insulated container (6) inside the Faraday pail. An electrometer is directly connected with the container to measure the total, net charge of a particulate material (7) under test. The container is put on an insulating support (8). A sliding door (9) was mounted on the side wall of the pail to pull the container out of the pail and to empty it. The procedure of measurement of the metal ring probe potential or voltage, when the probe is considered as a part of the larger measuring system consisting of the probe itself and any measuring preamplifier, is based on the continuous and almost real-time monitoring of variations with time of the potential (voltage) [1]. The microprocessor-based system converts the analog electric probe signals into a digital form for further processing, and calculates the effective value º of the voltage u(t) within the measuring time t . � The voltage u(t) is proportional to the net charge q(t) that flows within the sensing zone of the probe [10]. It is assumed that the effective value º should be proportional to the mean value of a particle charge 1q(t)2,Q"Cº "Cº that flows in a pipe � ��� and is measured with an electrometer in the Faraday pail. The relationships º"f (Q) and 1mR (t)2"g(Q) should rather be linear, as predicted. The calibration curves
J.B. Gajewski/Journal of Electrostatics 45 (1999) 255–264
259
obtained enable the net charge of flowing particles to be precisely and quickly determined on the basis of voltage readings done using any measuring system or instrument, for example, voltmeter. Since the mass m of each portion of solid particles must be exactly determined each time before and/or after they are fed into the installation, then the mean mass flow rate 1mR (t)2 is easily calculated. Having obtained the proper calibration curve(s) 1mR (t)2" f (Q)"g(º) after calibration of the whole measuring system: the head with the probe(s) inside and the microprocessor-based system or any device, instrument for measuring, for example, the RMS value of voltage, or using the system described and discussed elsewhere in detail [1], one can easily measure indirectly the both quantities 1q(t)2 and 1mR (t)2. In consequence the measurement (or determination) of the effective value º of the probe voltage permits one to quickly obtain the values of both the net electric charge of solid particles and their mass flow rate at the same time.
4. Calibration results The calibration of the metal ring probe and remaining parts of the whole measuring system used were performed using the polypropylene granules that are almost monodisperse at 0.0044 m in diameter. Their shape is regular and similar to the flat pellets (or pills) which thickness ranged from 0.0024 to 0.0028 m. The granules were fed into the installation in the different portions: 0.05, 0.10, 0.15, 0.20, 0.25, 0.30, and 0.40 kg within the measuring time t "2 s. Each measurement of � the probe voltage and granules’ net charge was repeated 10 times for each mass of the granules to collect a certain statistics, observe the repeatability of measurements, and eliminate random errors. The granule portions entered the Faraday pail after they had fallen down through the head and their net charge Q was measured with a vibrating-capacitor electrometer STATRON 6350 as a voltmeter and using a standard capacitor of a capacitance of 55 nF. The results of measurements of the net charge Q and mean mass flow rate 1mR (t)2 along with the effective values º of the probe voltage, as measured for different portions of the polypropylene granules, are given in Table 1. All the values: 1mR (t)2, Q, and º are the mean ones of 10 measurements and additionally 1mR (t)2 is also a mean value over the measuring time t , and therefore the standard � deviations of the charge p , mass flow rate p R , and effective voltage p are given in 3 / K�R� Table 1 as well. The relationships º"f (Q) and 1mR (t)2"g(Q) are referred to as calibration curves, and are presented in Fig. 3. Changes in the flow of the charged granules ( flow noise) were detected and recorded by means of the microprocessor-based measuring system that processed the digital electric signals of the ring probe and the plots of the time variations of the signal along with the results of calculation of the effective values º were displayed on the monitor screen. The plots º"f (Q) and 1mR (t)2"g(Q) reveal certain non-linearity. Using linear regression, the linearization of data for all the net charges has given the following
260
J.B. Gajewski/Journal of Electrostatics 45 (1999) 255–264
Table 1 The net charge, mass flow rate of the polypropylene granules, and the effective value of the probe voltage as well as relevant standard deviations m (kg)
Q p / 1mR (t)2 pR K �R� º p 3
(nC) (nC) (kg s\�) (kg s\�) (mV) (mV)
0.05
0.10
0.15
0.20
0.25
0.30
0.40
88 6.6 0.03 0.002 7.44 1.31
165 15.4 0.05 0.005 11.32 1.8
248 6.3 0.08 0.007 13.96 1.62
325 13.1 0.11 0.009 16.55 1.86
396 12.5 0.12 0.013 21.20 1.6
440 10.3 0.15 0.013 24.65 2.27
550 13.8 0.18 0.020 31.54 2.07
Fig. 3. Dependence of the mean mass flow rate 1mR (t)2 and effective voltage value º on the electric charge Q of granulated polypropylene.
J.B. Gajewski/Journal of Electrostatics 45 (1999) 255–264
261
relationship for the measuring head used in the experiments: Q"19.1;10\�º!30.2;10\�,
(1)
where Q is in coulombs and º in volts. Fig. 3 shows that the electric charge of polypropylene granules in this case is an auxiliary quantity. Also the interpretation of the plots confirms that the method of the mass flow rate measurement is an indirect one and the probe voltage measured depends first of all on the net charge of particles within the sensing zone of the probe. For the mean mass flow rates obtained in all the experiments done one can linearize the data with the use of linear regression as well. The mean mass flow rate 1mR (t)2 depends on the effective value º of the probe voltage linearly and is expressed as follows: 1mR (t)2"6.674º!0.0165,
(2)
where 1mR (t)2 is in kilograms per second and º in volts. According to the linearization of the data obtained in the preliminary test upon a calibration process of the electrostatic flow probe connected with the microprocessor-based measuring system and using granulated polypropylene, as given in Eq. (2), the appropriate calibration curve is shown in Fig. 4 for the range of the mass flow rate variations. Within this range of the mass flow rate the calibration curve is a straight line, though in reality for the very wide range of flow rates it can be a certain non-linear relationship which must and will be verified during further stages of research. Even if such non-linearity occurred, it would be linearized within a narrow necessary range of the mass flow rate variations or the microprocessor-based system would identify the curve using, e.g., orthogonal polynomials, as intended to be done in the future.
Fig. 4. Calibration curve for granulated polypropylene: 1mR (t)2"f (º).
262
J.B. Gajewski/Journal of Electrostatics 45 (1999) 255–264
Table 2 The coefficients of variation of the net charge » , and mass flow rate » R of granulated polypropylene, and / K�R� of the effective value of the probe voltage » 3 m (kg)
» / »R K�R� » 3
(%) (%) (%)
0.05
0.10
0.15
0.20
0.25
0.30
0.40
7.3 6.7 17.6
9.3 10.0 15.9
2.5 8.7 11.6
4.1 8.2 11.2
1.8 10.8 7.5
2.3 8.7 9.2
2.5 11.1 6.6
The values of the standard deviations are rather great and can be caused by the entire randomness of phenomena of a charged particle flow in pipelines, and by the measurement repeatability. A good indicator of the measurement repeatability is the coefficient of variation » (for example, » "p /xN , where p is the standard deviation V V V of a variable x and xN is the mean value of x) which is a measure of the dispersion of measurand values in their distribution about the arithmetic mean of a measurand. All the coefficients of variation » computed are collected in Table 2. The measurement of a charge tends to be more accurate for the higher masses of the polypropylene granules and simultaneously for their higher charge values. The better value of the coefficient of variation can be attributed to the more accurate electrometer reading for a higher scale range which is obvious according to the metrological rules for measurements with the use of analog instruments. The mass flow rate determination on the basis of the known granule mass and its time of passage through the whole pneumatic system has given quite different results as for the coefficient of variation calculated. The more likely reason of the worse coefficient of variation for the higher values of mass is, as suspected, the stronger agglomeration of highly charged granules and their slower, irregular flow, and fall in both inclined and vertical parts of the calibration installation. The values of time for each portion of granules are also the evidence of this statement. The effective values of voltage º were determined by the microprocessor-based measuring system, and its readings and their accuracy depend strongly on the two main errors of an analog-digital converter that can be made during the signal quantization. These errors are conversion and resolution (quantization) ones. The resolution error is especially important since this is directly related to the maximum signal amplitude; the error is lower when the signal amplitude is closer to the maximum input voltage range of an A/D converter. The input signal must then be amplified to suit its amplitude to the useful input voltage range of the converter and to utilize the converter’s dynamic properties to the maximum. The higher the input voltage amplitude and corresponding effective value, the lower the coefficient of variation of the effective voltage. The sampling frequency can also affect the output system readings, though it is thought to be less important in this case. The higher the sampling frequency, the resolution error is lower when Shannon’s Sampling ¹heorem is satisfied by the A/D converter.
J.B. Gajewski/Journal of Electrostatics 45 (1999) 255–264
263
Also the amplitude and phase errors of a measuring preamplifier may play a role in the total error of the system, as supposed, the more so as the preamplifier along with the probe itself acts as a differentiating network, circuit, device, etc. whose accuracy strongly depends on the circuit time constant that should be as low as possible over a range of the expected input probe signal frequencies [13].
5. Conclusions The experimental calibration installation and procedure should be very good, useful tools while calibrating, verifying, and/or testing different non-contact, inductive devices (probes, sensors, or transducers) and systems for the continuous, non-intrusive, real-time measurement of the solids mass flow rate in the pipes of pneumatic transport. The experimental results of the preliminary tests are promising and can be of practical value. They are also verification of an inductive, non-contact method for measuring the mass flow rate of particulates [1,11,12]. It must be clearly stated that the calibration of any system based upon the induction flow probes and intended for indirect measurements of the flow physical quantities and parameters should be done for a wide range of those quantities’ variation; the physical quantities and parameters, that are of prime importance, are, for example, the flow velocity, particle concentration, equilibrium moisture content of particles transported, temperature of the continuous phase (a dispersion medium, mainly air), material (conductor or insulator) and geometry of the transport piping (pipe diameters, diffusers, confusors, elbows, valves, etc.). It is necessary to obtain the family of calibration curves that would be stored in the internal system memory to enable a quick, reliable identification of real flow parameters after any change observed in the flow of particulates. If the measuring system has no such possibility to store adequate, relevant calibration data, it should be calibrated only under and for well-defined flow conditions as those encountered, for example, in industry. Also the system calibration should be repeated periodically for the system inspection, even if the pneumatic transport conditions are sensibly constant over a long time.
References [1] J.B. Gajewski, Monitoring electrostatic flow noise for mass flow and mean velocity measurement in pneumatic transport, J. Electrostat. 37 (1996) 261. [2] R.P. Corbett, J.D. Bassett, Electric field measurements in ionic and particulate clouds, Proc. Static Electrification Conf., London, England, 1971, p. 307. [3] P.W. King, Mass flow measurement of conveyed solids by monitoring of intrinsic electrostatic noise levels, Proc. 2nd Int. Conf. on the Pneumatic Transport of Solids in Pipes Pneumotransport 2, Guildford, England, 1973, p. 9. [4] S.E. Law, Electrostatic induction instrumentation for tracking and charge measurement of airborne agricultural particulates, ASAE Trans. 18 (1975) 40. [5] C.D. Hendricks, K.F. Yeung, Technique of single-particle charge measurement, IEEE Trans. Ind. Appl. IA-12 (1) (1976) 56.
264
J.B. Gajewski/Journal of Electrostatics 45 (1999) 255–264
[6] R.H. Al Rabeh, J. Hemp, A new method for measuring the flow rate of insulating fluids, Proc. Symp. on Advances in Flow Measurement Techniques, Warwick, England, 1981, p. 267. [7] T.J. Williams, T.H. Wilmhurst, A.G. Bailey, An in-flight particle charge detector, Proc. 7th Int. Conf. on Electrostatic Phenomena Electrostatics ’87, Oxford, England, Inst. Phys. Conf. Ser. No. 85, 1987, p. 273. [8] J.B. Gajewski, Electric charge measurement in pneumatic installations, Proc. 8th Int. Conf. on Electrostatics Electrostatics ’97, Poitiers-Futuroscope, France, 1997, J. Electrostat. 40&41 (1997) 231. [9] J.B. Gajewski, Measuring probes, head and system for the non-contact, electrostatic measurements of the two-phase flow parameters in pneumatic transport of solids, J. Electrostat. 32 (1994) 297. [10] J.B. Gajewski, Dynamic effect of charged particles on the measuring probe potential, Proc. 8th Int. Conf. on Electrostatics Electrostatics ’97, Poitiers-Futuroscope, France, 1997, J. Electrostat., 40&41 (1997) 437. [11] J.B. Gajewski, W. Ka"a, How to measure the velocity and mass flow rate of a two-phase flow of solid particles in pipelines?, Proc. 4th Int. Conf. on Electrostatics Elstat ’90, Wroc"aw—Szklarska Poreba, © Poland, 1990, Mater. Sci. XVI(1—3) (1990) 113. [12] J.B. Gajewski, B. G"o´d, W. Ka"a, Electrostatic method for measuring the two-phase pipe flow parameters, IEEE Trans. Ind. Appl. 29 (3) (1993) 650. [13] J.B. Gajewski, Electrostatic, inductive ring probe bandwidth, Meas. Sci. Technol. 7 (1996) 1766.