February 2, 2008
Electrostatic trapping of metastable NH molecules Steven Hoekstra,∗ Markus Mets¨al¨a, Peter C. Zieger, Ludwig Scharfenberg, Joop J. Gilijamse, Gerard Meijer, and Sebastiaan Y. T. van de Meerakker
arXiv:0709.3212v2 [physics.atom-ph] 7 Jan 2008
Fritz-Haber-Institut der Max-Planck-Gesellschaft, Faradayweg 4-6, 14195 Berlin, Germany We report on the Stark deceleration and electrostatic trapping of 14 NH (a 1 ∆) radicals. In the trap, the molecules are excited on the spin-forbidden A 3 Π ← a 1 ∆ transition and detected via their subsequent fluorescence to the X 3 Σ− ground state. The 1/e trapping time is 1.4 ± 0.1 s, from which a lower limit of 2.7 s for the radiative lifetime of the a 1 ∆, v = 0, J = 2 state is deduced. The spectral profile of the molecules in the trapping field is measured to probe their spatial distribution. Electrostatic trapping of metastable NH followed by optical pumping of the trapped molecules to the electronic ground state is an important step towards accumulation of these radicals in a magnetic trap. PACS numbers: 37.10.Pq, 37.10.Mn, 37.20.+j, 33.55.Be
I.
INTRODUCTION
The ability to confine cold gas-phase (polar) molecules in traps has increased interest in gas-phase molecular physics in recent years. This interest stems from the exotic and intriguing phenomena that are predicted to be observable in these cold molecular gases, ranging from chemistry at ultralow temperatures [1] to the engineering of macroscopic collective quantum states [2]. The field of (ultra)cold molecules might revolutionize molecular physics. It even has the potential to affect physics at large, just as the first successful production of (ultra)cold atoms has led to spectacular advances far beyond the realm of classical atomic physics. The techniques to produce cold molecules are slowly maturing; photo-association [3], buffer gas cooling [4], and Stark deceleration [5] have already resulted in the three dimensional trapping of molecules. Many other techniques are currently being developed by various groups. The method of Stark deceleration and electrostatic trapping combines molecular beam technology with concepts from charged particle accelerator physics. In essence, a part of a molecular beam pulse of polar neutral molecules can be decelerated to a standstill and confined in a trap, exploiting the interaction of polar molecules with inhomogeneous electric fields. The technique works for a large class of polar molecules, and has resulted to date in the trapping of ND3 molecules [5], OH radicals [6, 7] and metastable CO molecules [8]. The density of the decelerated and trapped molecular packets has proven to be sufficient for a number of experiments [9, 10, 11, 12, 13]. However, it is still a formidable challenge to reach high enough densities in the trap that collisions occur between the trapped molecules on the trapping time scale. This is required to be able to experimentally study the interactions between the trapped molecules, and it is a prerequisite for the future applica-
∗ Electronic
address:
[email protected]
tion of cooling schemes like evaporative or sympathetic cooling. An obvious route towards higher number densities in the trap is the accumulation of several packets of molecules that are produced in distinct cycles of the experiment. Although an increase of the phase-space density in this way is forbidden by Liouville’s theorem, a reloading scheme has been proposed for the NH radical that circumvents this fundamental obstacle [14]. In this scheme, NH radicals that are produced in the longlived metastable a 1 ∆ state are Stark decelerated to a standstill and subsequently optically excited to the A 3 Π state. Spontaneous fluorescence from the A 3 Π state to the X 3 Σ− ground state provides the required unidirectional pathway. A magnetic quadrupole trap can be placed at the end of the Stark decelerator, such that the created ground state molecules are magnetically trapped. The Stark interaction in the ground state is rather weak, therefore the Stark decelerator can be used to decelerate the next pulse of metastable NH radicals without affecting the trapping potential for ground state NH molecules. A number of prerequisites for the successful implementation of this accumulation scheme have already been experimentally demonstrated. The hitherto unobserved A 3 Π ← a 1 ∆ transition was found and characterized [15], and in a preliminary deceleration experiment, a beam of metastable NH radicals was Stark decelerated from 550 m/s to 330 m/s [16]. However, the intensity of the decelerated packet was rather poor, and prevented the demonstration of deceleration to lower velocities. Here we present the deceleration and electrostatic trapping of a pulsed beam of NH (a 1 ∆) radicals. The trapping time of the metastable radicals in the quadrupole electrostratic trap is measured. A laser-based diagnostic method has been used to characterize the spatial distribution of the trapped cloud. The NH radical has several additional properties that make this species of interest for cold molecule experiments. In fact, NH in the a 1 ∆ state is one of the prime candidates for the Stark deceleration and trapping technique. The Stark shift over mass ratio (the parameter
2 PMT LIF zone trap
detection laser (584 nm) 3
A Π1 (v'=0, J'=1)
Stark decelerator
584 nm
hexapole
1m
1.3
skimmer
336 nm
photodissociation laser (193 nm) pulsed valve
a 1Δ (v=0, J=2)
X 3Σ (v''=0)
FIG. 1: Scheme of the experimental setup. NH molecules in the a1 ∆ state are created by photodissociation of HN3 seeded in Kr. The beam passes through a skimmer, a hexapole, and a Stark decelerator. The decelerated molecules are subsequently loaded into an electrostatic trap. The molecules are probed at the center of the trap by a far off-resonant laserinduced fluorescence detection scheme, that is shown in the inset. A photograph of the Stark decelerator is shown in the upper left corner.
that determines the efficiency of the deceleration process) is significantly larger than for the OH radical, a system that is extensively used in deceleration and trapping experiments. In the X 3 Σ− ground state, its 2 µB magnetic moment makes the molecule a good candidate for magnetic trapping experiments. Recently, ground state NH molecules have been magnetically trapped using the buffer gas cooling technique [17], taking advantage of the favorable properties of He-NH collisions [18]. The electric dipole allowed A 3 Π, v ′ = 0 ← X 3 Σ− , v ′′ = 0 transition has an unusually large Franck-Condon factor [19], which offers interesting prospects for direct laser cooling. It has also been predicted that NH in the ground state has favorable properties to perform evaporative cooling [20]. Finally, interesting collision properties are expected between cold NH (X 3 Σ− ) molecules and ultracold Rb atoms [21, 22].
II.
EXPERIMENT
The experiments to decelerate the NH radicals, and the experiments to subsequently confine the molecules in an electrostatic quadrupole trap, are performed in two different pulsed molecular beam machines, operating at a repetition frequency of 10 Hz. The deceleration experiments are performed in a newly constructed Stark deceleration molecular beam machine; for the trapping experiments the same setup is used as in our OH trapping experiments. The latter setup is schematically depicted in Figure 1, and has been described in detail elsewhere [6]. A molecular beam of NH molecules is formed by photo-
dissociation of about 1 vol % hydrogen azide (HN3 ) seeded in Krypton by focussing the 6 mJ output of a ArF excimer laser on a small quartz capillary that is mounted on the tip of a pulsed supersonic valve. Gaseous HN3 is prepared by the reaction of sodium azide (NaN3 ) with an excess of lauric acid under vacuum. The reaction starts at approximately 348 K and proceeds smoothly at 353363 K. The NH radicals are produced both in the X 3 Σ− ground state and in the metastable a 1 ∆ electronically excited state. With Krypton as a carrier gas the molecular beam has a forward velocity centered at about 450500 m/s with a full-width half-maximum (FWHM) velocity spread of about 20 %. The use of Xenon as a carrier gas, which would result in a lower initial velocity, is not possible since it is known to efficiently quench the metastable NH molecules [23]. After the supersonic expansion, most molecules in the a 1 ∆ electronic state reside in the v = 0, J = 2 ro-vibrational ground state. The Stark shift of this level is shown in the upper part of Figure 2. Only molecules in the low-field seeking MJ Ω = −4 component are decelerated and trapped in the experiments. On a smaller energy scale, in the lower part of Figure 2, the effect of the hyperfine structure of 14 NH on the Stark splitting becomes visible. Due to the nuclear spin of both the 14 N and the H nucleus, the a 1 ∆, J = 2 level is split into six hyperfine levels that are labelled by the quantum number F . The Λ-doublet splitting of the J = 2 level is only 116 kHz [24], and is not visible on this energy scale. The hyperfine splitting is therefore (much) larger than the Λ-doublet splitting, and the low- and high-field seeking MF components of the different hyperfine states interact strongly. This unusual situation is rather different from that in the molecules that have been used in Stark deceleration experiments thus far, and one may wonder (and worry) if this complex energy level structure could result in a redistribution over the MJ Ω states during the deceleration process. Approximately 3 cm downstream from the nozzle orifice, the molecular beam passes through a skimmer, and enters the decelerator chamber. The molecules are focussed into the Stark decelerator by a short hexapole. The Stark decelerator that is installed in the trapping machine consists of 108 electric field stages with a center to center distance of 11 mm. Each stage consists of 2 parallel 6 mm diameter electrodes that are placed around the molecular beam axis to provide a 4 × 4 mm2 opening area for the molecular beam to pass. A voltage difference of 40 kV is applied to the electrodes. At the end of the decelerator an electrostatic quadrupole trap is mounted. The trap loading procedure is similar to that used to trap OH [6]. The Stark decelerator that is used in the deceleration experiments consists of 104 electric field stages. The electrode geometry of this decelerator is identical to that of the other decelerator, except for an overall scaling factor of 0.75, i.e., the electrodes have a 4.5 mm diameter, are placed 8.25 mm apart, and provide a 3 × 3 mm2 aperture. However, the same voltage
3 pulsed dye amplifier pumped by a frequency-doubled injection seeded Nd:Yag pump laser. For the excitation, a 3 mm diameter laser beam with a pulse energy of up to 25 mJ in a 5 ns duration pulse, with a bandwidth of approximately 130 MHz, is used. This intensity is sufficient to saturate even this weak spin-forbidden transition. In the deceleration experiment, the laser beam excites the molecules just behind the last electrodes of the decelerator. In the trapping experiments, the laser beam is directed through holes in the center trap electrode, and the fluorescence is collected through a 6 mm hole in the end-cap electrode. The fluorescence is imaged with a lens onto a photomultiplier tube. Unless stated otherwise, all electrodes are grounded 10 µs before the laser excites the molecules.
III. A.
FIG. 2: The Stark shift of the metastable a 1 ∆(v = 0, J = 2) state. In the upper panel the energy splitting (in cm−1 ) in strong electric fields is shown, not resolving the hyperfine structure. The lower panel shows the energy splitting (in MHz) in low electric fields, including the hyperfine structure of 14 NH.
difference of 40 kV is applied to the electrodes. A photograph of the latter decelerator is shown in the upper left corner of Figure 1. As can be seen from this photograph, the last 8 electric field stages are mounted on conically shaped rods to provide an optimal solid angle for fluorescence collection. The NH (a 1 ∆) radicals that exit the decelerator are state-selectively detected using a far off-resonant Laser Induced Fluorescence (LIF) scheme that is schematically shown in the inset of Figure 1. The molecules are excited to the upper Λ-doublet component of the A 3 Π1 , v = 0, J = 1 level on the P2 (2) line of the spinforbidden A 3 Π ← a 1 ∆ transition around 584 nm [15], and the subsequent fluorescence to the X 3 Σ− ground state around 336 nm is recorded. Although the use of a spin-forbidden transition for LIF detection of molecules is unconventional, this scheme is advantageous as it allows almost background-free detection by blocking the straylight from the excitation laser with optical filters. The 584 nm light is generated by a narrow-band pulsed laser system. In this laser the output of a frequency stabilized single mode ring dye laser is amplified in a three stage
RESULTS AND DISCUSSION Deceleration of NH (a 1 ∆) radicals
A typical time-of-flight (TOF) profile of NH (a 1 ∆, v = 0, J = 2) radicals that is observed in a deceleration experiment is shown in curve (a) of Figure 3. In this experiment, a packet of molecules with an initial velocity of 520 m/s is selected, and the Stark decelerator is programmed to extract 1.6 cm−1 of kinetic energy from the packet in every electric field stage. The selected fraction of the molecular beam pulse that is decelerated to a final velocity of 84 m/s arrives in the detection region about 3 ms after production, and is split off from the remaining part of the beam that is not decelerated. The TOF profile that is obtained from a three dimensional trajectory simulation of the experiment is shown in curve (b), and is seen to quantitatively reproduce the observed TOF profile. In the simulations, the NH radicals are assumed to be produced in each of the six MJ Ω components of the J = 2 state with equal probability. In the curves (c), (d ), and (e) the individual contributions of the MJ Ω = −4, the MJ Ω = −2, and both MJ Ω = 0 components to the TOF profile are shown, respectively. The decelerated packet of molecules exclusively consists of molecules in the J = 2, MJ Ω = −4 state, but molecules in the MJ Ω = −2 state significantly contribute to the signal of the non-decelerated part of the beam. The MJ Ω = 0 components hardly contribute to the signal as molecules in these components do not experience transverse focussing forces as they progress through the decelerator. Molecules in the high-field seeking MJ Ω = +2 and MJ Ω = +4 components are deflected from the molecular beam axis and do not reach the exit of the Stark decelerator. From these simulations, the MJ Ω composition of the structured TOF profile of the non-decelerated part of the beam is easily identified. This structure, and in particular also the ratio between signal intensity of the decelerated and non-decelerated part of the beam pulse, is well reproduced by the simulations. This is a strong indica-
4
FIG. 3: A measured time-of-flight (TOF) profile of metastable NH molecules observed in a deceleration experiment (a), compared with the outcome of a numerical simulation (b). The molecules are decelerated from 520 m/s to a final velocity of 84 m/s. The contribution of individual MJ Ω components to the simulated TOF-profile is shown in the lower part of the figure.
tion that there is no significant redistribution over the various MJ Ω components when switching from one highvoltage configuration to the next in the Stark decelerator. B.
Trapping of NH (a 1 ∆) radicals
When the molecules are brought to a standstill the electrostatic trap is switched on. The details of the trap loading process are published elsewhere [6]. The intensity of the LIF signal of NH (a 1 ∆, v = 0, J = 2) radicals, detected at the center of the trap, is shown as a function of time in Figure 4. The trap is switched on about 6 ms after the NH radicals are produced. After a few initial oscillations a steady signal of the trapped molecules remains. In the inset the signal of the trapped molecules is plotted on a longer time scale. We have fitted a single exponential decay to the data, resulting in a 1/e trapping time of 1.4 ± 0.1 s. There are three main processes that limit the trapping time: rotational excitation due to absorption of room-temperature blackbody radiation, collisions with the background gas and the spontaneous decay of the metastable state itself. In a recent study, the effects of blackbody radiation have been quantified for OH/OD, and tabulated for a variety of molecules [13]. For NH(a 1 ∆, v = 0, J = 2) the loss rate due to optical pumping by room-temperature blackbody radiation is
FIG. 4: The arrival of undecelerated NH molecules in the trap center is followed by the steady signal of trapped NH molecules. The molecules are brought to a standstill 6 ms after their production. At that moment the trap is switched on. In the inset the population of electrostatically trapped NH(a1 ∆, v = 0, J = 2) molecules is plotted as a function of time. The solid line is a single exponential fit to the data with an 1/e lifetime of 1.4 s.
0.36 s−1 . The most abundant collision partner for the trapped metastable NH radicals is Krypton, the carrier gas used in these experiments. Unfortunately this loss factor can not be quantified because the NH(a 1 ∆)Krypton collision cross-section is unknown. The radiative lifetime of the a 1 ∆ state of NH is not known accurately, but is expected to be on the order of a few seconds (see [25] and references therein). When we combine the measured trapping time with the calculated loss rate due to blackbody radiation pumping and when we assume no loss due to collisions with the background gas, we find a lower limit for the radiative lifetime of the NH(a 1 ∆, v = 0, J = 2) state of 2.7 seconds. The number of trapped molecules can be estimated from the intensity of the detected fluorescence. The averaged number of detected photons, after 200 ms of trapping, is 2.4 per excitation laser pulse. From this the number of trapped NH(a 1 ∆, v = 0, J = 2) molecules is estimated to be about 104 , corresponding to a density on the order of 106 molecules cm−3 . This is about one order of magnitude less than in our OH trapping experiments, reflecting the inferior beam intensity of NH(a 1 ∆) radicals. The production of NH(a 1 ∆) radicals in the beam can be improved when the HN3 molecules are photodissociated using the 266 nm light of a Nd:Yag laser. In this scheme, the production of NH (X 3 Σ− ) is spin forbidden, and the NH radicals are exclusively produced in the a 1 ∆ state [26]. Alternatively, NH (a 1 ∆) molecules can be produced with a high quantum yield by photodissociation of HNCO at 193 nm [27].
5
number of molecules
Simulations
0.0
II
II
x III
III
0.1
0.2
0.3
0.4
Stark shift (cm-1)
-8
1 3
-6
0.5 0
5
10
15
20
25
speed (m/s)
-4
-2
0
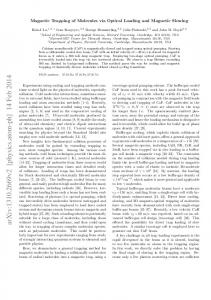
FIG. 5: Spectral profiles obtained by scanning the detection laser frequency over the highest frequency component of the P2 (2) transition, which excites the trapped NH molecules from the a1 ∆ to the A3 Π state. The field-free profile (I) is shown, scaled down by a factor 3, together with the profiles obtained while the shallow (II) or deep (III) trapping field is on. In the inset the result of numerical simulations is given, showing the number of trapped molecules as a function of their Stark shift and speed.
C.
Spectral profiles
An important property of the trapped gas is the temperature. Measuring the temperature, however, is notoriously difficult. The temperature can in principle be determined by measuring the spatial distribution of the molecular cloud, as the spatial and velocity distribution of the molecules in the trap are coupled. In trapping experiments with ND3 molecules, that are detected using a Resonance Enhanced Multi Photon Ionization (REMPI) scheme with a focussed laser, the spatial distribution can be measured by mechanically scanning the laser focus along a symmetry axis of the trap [28]. This strategy can only be implemented if the detection laser beam is (much) smaller than the size of the molecular cloud. When LIF is used as a detection scheme, the laser beam can usually not be made small enough to measure the spatial distribution this way. When the laser beam is comparable in size to the molecular cloud, however, the temperature can be deduced from the spectral profile of the molecules in the presence of the trapping potential, a method that has, for instance, been applied to magnetically trapped CaH molecules [4]. Unfortunately, if the excitation wavelength is in the ultraviolet part of the spectrum, scattered photons can release electrons from the trap electrode material. This can cause electrical breakdown in electrostatic traps, and has thus far hampered the application of this method to electrostatically trapped molecules. The detection scheme that is used in the present experiments does not suffer from these limitations, as
the 584 nm radiation can safely be used to excite the molecules while the trap electrodes are still on high voltage. In the main part of Figure 5 three different spectral profiles of the P2 (2) line are shown, all recorded after 16 ms of trapping. The origin of the horizontal axis is set at the center of the field-free line profile, indicated as profile (I). This line profile is measured 10 µs after the trap electrodes are switched off and grounded. This time interval is sufficiently short that the molecules do not move significantly, while being long enough to ensure field-free conditions. A near-Gaussian lineshape with a FWHM of ∼ 130 MHz, mainly determined by the bandwidth of the laser, is observed. Weak shoulders due to partly resolved hyperfine structure and the intrinsic spectral structure in the laser pulse can be recognized in this profile. Also shown are two broadened line profiles, (II) and (III), observed when the molecules are excited in the presence of the trapping potential. In the electric field of the trap, the trapped molecules in the a 1 ∆, v = 0, J = 2 level and the A 3 Π1 , v ′ = 0, J ′ = 1 level both experience a positive Stark shift. Since the Stark shift for molecules trapped in the a1 ∆ state is considerably larger than the Stark shift in the excited A3 Π1 state, a broadened profile of the P2 (2) line results that is shifted to lower frequencies. The difference between profile (II) and (III) reflects the difference in the depth and slope of the trapping potentials that are being used; the deceleration and trap loading process is identical in both cases. Profile (II) is recorded when the ring electrode of the trap is grounded, whereas a voltage of +15 kV is applied to this electrode to record profile (III). The endcaps of the electrostatic trap are at a potential of -15 kV in both cases. The resulting trap potentials therefore differ in slope and depth by a factor of two, and are referred to hereafter as ’shallow’ (II) and ’deep’ (III). The laser excitation and fluorescence detection in the experiment is done through holes in the trap electrodes, inevitably restraining access to the trapping volume. For a direct determination of the temperature of the trapped molecules from the measured line profiles a complicated instrument function would have to be taken into account; the laser position, its spatial intensity profile and the spatial sensitivity of the detection system have to be accurately known. Therefore, a detailed analysis of the line profiles intrinsically has many uncertainties. However, information on the energy and the position of the molecules in the trap can also be obtained in a straightforward manner by comparing the experimental line profiles with each other. In such a comparison, complications related to details of the excitation- and detectionprocesses cancel out. The integrated signal of the three line profiles is, within experimental accuracy, the same. Moreover, if profile (II) is stretched out in frequency by a factor of two, and reduced in intensity by a factor of two, it is virtually identical to profile (III). This alone indicates that the spatial distribution of the trapped molecules in the shallow and deep potential are the same. This in turn implies that
6 the initial kinetic energy of the molecules, at the moment that the trap is switched on, is small relative to the depth of the trapping potentials. The energy distribution (temperature) is therefore mainly determined by the trapping potential, and is about a factor of two different for the shallow and the deep trap. This conclusion is supported by numerical simulations of the deceleration and trapping process. The inset in Figure 5 shows the results of these simulations, indicating the number of trapped molecules as a function of their Stark shift and speed, for both trapping geometries. The molecules in the shallow trap potential (II) have a smaller Stark shift and a narrower speed distribution than the molecules trapped in the deep trap potential (III). The simulated speed distribution can be characterized by a temperature, which is on the order of 60 mK and 100 mK for the molecules trapped in the shallow and deep trap potential, respectively. IV.
CONCLUSIONS
A pulsed molecular beam of NH radicals in the metastable a1 ∆ state has been produced, Stark decel-
[1] R. Krems, Int. Rev. Phys. Chem. 24, 99 (2005). [2] M. Baranov, L. Dobrek, K. G´ oral, L. Santos, and M. Lewenstein, Phys. Scr. T102, 74 (2002). [3] T. Takekoshi, B. M. Patterson, and R. J. Knize, Phys. Rev. Lett. 81, 5105 (1998). [4] J. D. Weinstein, R. deCarvalho, T. Guillet, B. Friedrich, and J. M. Doyle, Nature 395, 148 (1998). [5] H. L. Bethlem, G. Berden, F. M. H. Crompvoets, R. T. Jongma, A. J. A. van Roij, and G. Meijer, Nature 406, 491 (2000). [6] S. Y. T. van de Meerakker, P. H. M. Smeets, N. Vanhaecke, R. T. Jongma, and G. Meijer, Phys. Rev. Lett. 94, 023004 (2005). [7] B. C. Sawyer, B. L. Lev, E. R. Hudson, B. K. Stuhl, M. Lara, J. L. Bohn, and J. Ye, Phys. Rev. Lett. 98, 253002 (2007). [8] J. J. Gilijamse, S. Hoekstra, S. A. Meek, M. Mets¨ al¨ a, S. Y. T. van de Meerakker, G. Meijer, and G. C. Groenenboom, J. Chem. Phys. 27, 221102 (2007). [9] J. van Veldhoven, J. Kupper, H. L. Bethlem, B. Sartakov, A. J. A. van Roij, and G. Meijer, Eur. Phys. J. D 31, 337 (2004). [10] E. R. Hudson, H. J. Lewandowski, B. C. Sawyer, and J. Ye, Phys. Rev. Lett. 96, 143004 (2006). [11] J. J. Gilijamse, S. Hoekstra, S. Y. T. van de Meerakker, G. C. Groenenboom, and G. Meijer, Science 313, 1617 (2006). [12] S. Y. T. van de Meerakker, N. Vanhaecke, M. P. J. van der Loo, G. C. Groenenboom, and G. Meijer, Phys. Rev. Lett. 95, 013003 (2005). [13] S. Hoekstra, J. J. Gilijamse, B. Sartakov, N. Vanhaecke, L. Scharfenberg, S. Y. T. van de Meerakker, and G. Mei-
erated, and loaded into an electrostatic trap. The density of the trapped sample is on the order of 106 cm−3 , which can be further enhanced by implementing more efficient production schemes. The 1/e trapping lifetime is determined as 1.4±0.1 s, which yields a lower limit of 2.7 s for the radiative lifetime of the a 1 ∆, v = 0, J = 2 state. The spatial distribution of the trapped cloud is probed by performing spectroscopy on the molecules in the presence of the trapping field. This experiment is an important step towards the accumulation of multiple packets of Stark-decelerated molecules in a magnetic trap, which is a promising route towards higher densities of cold molecules. Modifications to the machine that will enable the transfer of the NH radicals into a magnetic trap are currently being implemented.
V.
ACKNOWLEDGEMENTS
We acknowledge the experimental support from Henrik Haak and Sandy Gewinner, and the theoretical support from Boris Sartakov. M.M. is grateful to the Academy of Finland for financial support.
jer, Phys. Rev. Lett. 98, 133001 (2007). [14] S. Y. T. van de Meerakker, R. T. Jongma, H. L. Bethlem, and G. Meijer, Phys. Rev. A 64, 041401(R) (2001). [15] S. Y. T. van de Meerakker, B. G. Sartakov, A. P. Mosk, R. T. Jongma, and G. Meijer, Phys. Rev. A 68, 032508 (2003). [16] S. Y. T. van de Meerakker, I. Labazan, S. Hoekstra, J. K¨ upper, and G. Meijer, J. Phys. B 39, S1077 (2006). [17] W. C. Campbell, E. Tsikata, H.-I. Lu, L. D. van Buuren, and J. M. Doyle, Phys. Rev. Lett. 98, 213001 (2007). [18] R. V. Krems, H. R. Sadeghpour, A. Dalgarno, D. Zgid, J. Klos, and G. Chalasi´ nski, Phys. Rev. A 68, 051401(R) (2003). [19] D. R. Yarkony, J. Chem. Phys. 91, 4745 (1989). [20] M. Kajita, Phys. Rev. A 74, 032710 (2006). [21] P. Soldan and J. M. Hutson, Phys. Rev. Lett. 92, 163202 (2004). [22] M. Tacconi, L. Gonzalez-Sanchez, E. Bodo, and F. A. Gianturco, Phys. Rev. A 76, 032702 (2007). [23] W. Hack and A. Wilms, J. Phys. Chem. 93, 3540 (1989). [24] W. Ubachs, G. Meyer, J. J. ter Meulen, and A. Dymanus, J. Mol. Spectrosc. 115, 88 (1986). [25] J. L. Rinnenthal and K. H. Gericke, J. Mol. Spectrosc. 198, 115 (1999). [26] J. R. McDonald, R. G. Miller, and A. P. Baronavski, Chem. Phys. Lett. 51, 57 (1977). [27] W. S. Drozdoski, A. P. Baronavski, and J. R. McDonald, Chem. Phys. Lett. 64, 421 (1979). [28] H. L. Bethlem, F. M. H. Crompvoets, R. T. Jongma, S. Y. T. van de Meerakker, and G. Meijer, Phys. Rev. A 65, 053416 (2002).