ELEMENTARY STATISTICAL METHODS
ELEMENTARY STATISTICAL METHODS SECOND EDITION
J. B. OFOSU, BSc, PhD, FSS Professor of Statistics Methodist University College Ghana
C. A. HESSE, BSc, MPhil Lecturer in Statistics Methodist University College Ghana
ELEMENTARY STATISTICAL METHODS
ii
ELEMENTARY STATISTICAL METHODS
Preface Like the first edition, the purpose of this book is to acquaint the reader with the increasing number of applications of statistics in engineering and the applied sciences. It can be used as a textbook for a first course in statistical methods in Universities and Polytechnics. The book can also be used by decision makers and researchers to either gain basic understanding or to extend their knowledge of some of the most commonly used statistical methods. Our goal is to introduce the basic theory without getting too involved in mathematical detail, and thus to enable a larger proportion of the book to be devoted to practical applications. Because of this, some results are stated without proof, where this is unlikely to affect the reader’s comprehension. However, we have tried to avoid the cook-book approach to statistics by carefully explaining the basic concepts of the subject, such as probability and sampling distributions; these the reader must understand. The worst abuses of statistics occur when scientists try to analyze their data by substituting measurements into statistical formulae which they do not understand. The book contains seven Chapters. Chapter 1 deals with the nature of statistics. In Chapter 2, we discuss how to describe data, using graphical and summary statistics. Chapter 3 covers probability while Chapter 4 covers probability distributions. Chapters 5 and 6 present basic tools of statistical inference; point estimation, interval estimation and hypothesis testing. Our presentation is distinctly applications-oriented. Chapter 7 presents linear regression and correlation. A prominent feature of the book is the inclusion of many examples. Each example is carefully selected to illustrate the application of a particular statistical technique and or interpretation of results. Another feature is that each chapter has an extensive collection of exercises. Many of these exercises are from published sources, including past examination questions from King Saud University (Saudi Arabia) and Methodist University College Ghana. Answers to all the exercises are given at the end of the book. iii
ELEMENTARY STATISTICAL METHODS
We are grateful to Mr. A. Lotsi of University of Ghana and Professor O. A. Y. Jackson of Methodist University College Ghana, for reading a draft of the book and offering helpful comments and suggestions. We are also indebted to Professor Abdullah Al-Shiha of King Saud University (Saudi Arabia) for his permission to publish the statistical tables he used the Minitab software package to prepare. These tables are given in the Appendix. Last, but not least, we thank King Saud University and Methodist University College Ghana, for permission to use their past examination questions in Statistics. We have gone to great lengths to make this text both pedagogically sound and errorfree. If you have any suggestions, or find potential errors, please contact us at
[email protected] or
[email protected]. J. B. Ofosu C. A. Hesse January, 2010
iv
ELEMENTARY STATISTICAL METHODS
Contents 1 1.1 1.2 1.3 1.4 1.5 1.6 1.7
THE NATURE OF STATISTICS ......................................................... Some basic concepts ............................................................................... Opportunities for statisticians ................................................................ Types of variables ................................................................................... Measurement scales ................................................................................ Sources of statistical data ........................................................................ Methods of data collection...................................................................... Computers and statistical analysis .........................................................
1 1 3 4 5 7 10 11
2 2.1 2.2 2.3 2.4 2.5 2.6
DESCRIPTIVE STATISTICS................................................................ Organization of data ............................................................................... Graphical representation of data ............................................................ Measures of central tendency ................................................................. Quartiles and Percentiles ........................................................................ Measures of dispersion ........................................................................... Shapes of distributions ............................................................................
13 13 23 38 51 56 69
3 3.1 3.2 3.3 3.4 3.5 3.6 3.7 3.8 3.9 3.10
PROBABILITY ...................................................................................... Random experiments .............................................................................. Sample space and events ........................................................................ Operations on events .............................................................................. Classical definition of probability ........................................................... The relative frequency definition of probability ..................................... Probability laws ....................................................................................... Two-set problems ................................................................................... Conditional probability ........................................................................... The multiplication law of probability ..................................................... Independent events .................................................................................
75 75 75 77 78 83 85 87 91 94 96
v
ELEMENTARY STATISTICAL METHODS
3.11 3.12
Bayes’ theorem ........................................................................................ 80 Arrangements and selections ..................................................................105
4 4.1 4.2 4.3 4.4 4.5 4.6 4.7 4.8
PROBABILITY DISTRIBUTIONS ......................................................118 The concept of a random variable ..........................................................118 The probability distribution of a discrete random variable ...................119 The cumulative distribution function of a random variable ..................122 The mean of a discrete probability distribution .....................................124 The binomial distribution .......................................................................126 The Poisson distribution ........................................................................132 Continuous probability distributions .....................................................136 The normal distribution ..........................................................................139
5 5.1 5.2 5.3 5.4 5.5 5.6 5.7 5.8
ESTIMATION........................................................................................148 Statistical inference .................................................................................148 Random sampling ..................................................................................148 Sampling distribution of the mean.............................................................. 149 Estimation of a population mean ...........................................................153 Estimation of the difference between two population means ...............157 Sampling distribution of the variance ....................................................163 Estimation of a population variance.......................................................164 Confidence interval for the ratio of the variances of two normally distributed populations ...........................................................................166 Estimation of a population proportion ...................................................169 Estimation of the difference between two population proportions .......170
5.9 5.10 6 6.1 6.2 6.3
HYPOTHESIS TESTING .....................................................................175 General concepts .....................................................................................175 Tests concerning a population mean .....................................................177 The relationship between tests of hypothesis and confidence intervals ................................................................................184 vi
ELEMENTARY STATISTICAL METHODS
6.4 6.5 6.6 6.7 6.8 6.9 6.10 6.11 6.12
Tests on the difference between two population means ........................184 The paired t-test ......................................................................................189 Tests concerning a population variance .................................................193 Tests on the ratio of two population variances .......................................... 194 Tests concerning a population proportion .............................................198 Tests concerning two population proportions .......................................199 The use of P-values in hypothesis testing .............................................202 Analysis of frequencies ...........................................................................203 Test of independence ..............................................................................207
7. 7.1 7.2 7.3 7.4 7.5
LINEAR REGRESSION AND CORRELATION ...............................213 Introduction ............................................................................................213 Simple linear regression ..........................................................................213 Making inferences in linear regression analysis ....................................217 Correlation ...............................................................................................222 Inferences concerning the correlation coefficient ..................................224 APPENDIX.............................................................................................232 Table A.1 Cumulative Binomial Distribution .......................................233 Table A.2 Cumulative Poisson Distribution.........................................236 Table A.3 Areas under the standard normal curve ...............................238 Table A.4 Percentage points of the t-distribution ................................240 Table A.5 Percentage points of the χ2 distribution ..............................242 Table A.6 Percentage points of the F-distribution ...............................244 ANSWERS TO EXERCISES .................................................................252
vii
ELEMENTARY STATISTICAL METHODS
FOREWORD By Prof. A. H. O. Mensah Methodist University College Ghana The subject of this brief foreword is the second edition of the book, “Elementary Statistical Methods”, written by two of our seasoned and prominent professors at the Methodist University College Ghana. Like the first edition, this second edition is intended to respond to the growing applications of Statistics in engineering and the applied sciences, especially in the universities, the polytechnics and for the other more practical uses. Its coverage includes the nature of statistics, the use of graphical and summary statistics for description of data, probability and probability distributions, basic tools of statistical inference, point estimation, interval estimation, hypothesis testing, linear regression and correlation. An added benefit from this edition is that each chapter has an extensive collection of exercises carefully selected to illustrate the application of a particular statistical technique or interpretation of results. Answers to all the exercises are given at the end of the book. The book is, indeed, a priceless asset plus more! It is certainly no exaggeration to say that the principles and methods it teaches can be employed by the producer or marketer to capture his target market, by the student to gain precious knowledge and by the teacher to enhance his lectures and delivery. The book is highly recommended to all and for all who can benefit from it. Get copies now! viii
ELEMENTARY STATISTICAL METHODS
C CH HA AP PT TE ER RO ON NE E The Nature of Statistics 1.1
Some basic concepts
Like all fields of learning, statistics has its own vocabulary. Some of the words and phrases encountered in the study of statistics will be new to those not previously exposed to the subject. The following are some terms that we will use extensively in the remainder of this book.
Data The raw material of statistics is data. For our purpose, we may define data as numbers. The two kinds of numbers that we use in statistics are numbers that result from taking a measurement and those that result from the process of counting. For example, when a nurse weighs a patient or takes a patient’s temperature, a measurement, consisting of a number such as 30 kg or 37 oC, is obtained. A different type of number is obtained when a hospital administrator counts the number of patients – perhaps 15 – discharged from the hospital on a given day. Each of these three numbers is a datum, and the three numbers taken together are data.
Population and sample Consider the following example:
Example 1.1 Suppose we wish to study the body masses of all students of Methodist University. It will take us a long time to measure the body masses of all students of the university and so we may select 20 of the students and measure their body masses. Suppose we obtain the measurements in Table 1.1.
Table 1.1: Body masses (in kg) of 20 students 49 57
56 52
48 63
61 58
59 51
43 47
58 57
52 46
64 53
71 59
In this study, we are interested in the body masses of all students of Methodist University. The set of body masses of all students of Methodist University is called the population of this study. The set of body masses in Table 1.1, W = {49, 56, 48, …, 53, 59}, is a sample from this population. 1
ELEMENTARY STATISTICAL METHODS
Definition 1.1
A population is the set of all objects we wish to study.
Definition 1.2 A sample is part of the population we study to learn about the population.
Example 1.2 In a certain study, 900 men were selected from Nsawam. It was found that 25 are smokers. (a) What is the population in this study? (b) What is the sample size? Solution (a) The population is men from Nsawam. (b) The sample size is 900.
Remarks 1. If we wish to study the blood pressures of Ghanaians, then our population consists of all blood pressures of Ghanaians. If we are interested in the blood pressures of Ghanaian men, then we have a different population – the blood pressures of Ghanaian men. 2. In many situations, we cannot afford to study the entire population. Instead, we take a sample from the population and study this sample. If the sample is representative of the population, then the information from the sample can be applied to the whole population. One way of obtaining a representative sample is discussed in Section 1.6. 3. A population may be finite or infinite. If a population of values consists of a fixed number of these values, the population is said to be finite, otherwise, it is infinite. An infinite population consists of an endless succession of values. In practice, the term infinite population is used to refer to a population that cannot be enumerated in a reasonable period of time.
Example 1.3
A finite population includes the following: (a) Students studying Business Administration at the Methodist University. (b) All football clubs in the first and second divisions in Ghana. (c) All households in Nkawkaw.
Example 1.4 An infinite population includes the following: (a) The set of real numbers between two integers. (b) All fishes in River Volta. (c) All palm trees in West Africa. 2 The Nature of Statistics
ELEMENTARY STATISTICAL METHODS
What is statistics? Statistics is a field of study concerned with: (a) the collection, organization, and analysis of data, and (b) the drawing of inferences about a population from a sample taken from the population. It can be seen that statistics can be classified into two main branches – descriptive statistics and inferential statistics. Descriptive statistics is concerned with the collection and describing important features of data. In inferential statistics, our aim is to make a decision about a population based on a sample from the population. Most of the modern use of statistics, particularly in engineering and the sciences, focus on inference rather than description. For example, an engineer who designs a new computer chip will manufacture a sample or prototypes and will want to draw conclusions about how all these devices will work once they are in full-scale production. There are two main methods used in inferential statistics: estimation and hypothesis testing. These methods are discussed in chapters five and six.
1.2
Opportunities for statisticians
In almost every endeavour of human activity, the scientific method has proven effective for solving problems and improving performance. This approach involves the collection of data pertinent to the particular problem. Statisticians play several important roles in these scientific studies. First, they plan the studies to ensure that the data are collected efficiently and answer the questions relevant to the investigation. Second, they analyze the data to discover what the study has demonstrated and what issues need further investigation. In industry, statisticians design and analyze experiments to improve the safety, reliability and performance of products of all types. Statisticians are also directly involved with quality control issues in manufacturing to ensure consistent product dependability. Statisticians work with social scientists to survey attitudes and opinions. In education, statisticians are involved with the assessment of educational aptitude and achievement and with experiments designed to measure the effectiveness of curricular innovations. Statisticians are an important part of research teams which search for better varieties of agricultural crops, and for safer and more effective use of fertilizers. In major hospitals, medical schools and government agencies, statisticians study the control, prevention, diagnosis and treatment of diseases, injuries and other health abnormalities. They also investigate the efficiency of health delivery systems and practices. In the pharmaceutical industry, statisticians design experiments to measure the efficacy of drugs in treating illnesses and to assess the likelihood of undesirable side effects.
The Nature of Statistics
3
ELEMENTARY STATISTICAL METHODS Statistical methods are also used in business practice, e.g. to forecast demand for goods and services. Actuaries use statistical methods to assess risk levels and set premium rates for insurance and pension industries. Statisticians also play a vital role in assessing employment levels and needs of the population for health, economic and social services. Without accurate information from agencies like Ghana Statistical Services, Customs Excise and Preventive Services (CEPS), Environmental Protection Agency, the government cannot effectively allocate its resources. Research in statistical methods is carried out in universities, government agencies and in private industry. Statisticians employed in these activities develop new ways to collect and analyze data for the many types of data and experimental settings encountered in practical studies.
1.3
Types of variables
Any type of observation which can take different values for different people, or different values at different times, or places, is called a variable. The following are examples of variables: (a) family size, number of hospital beds, year of birth, number of schools in a country, etc. (b) height, mass, blood pressure, temperature, blood glucose level, etc. There are, broadly speaking, two types of variables – quantitative and qualitative variables.
1.3.1 Quantitative variables A quantitative variable is one that can take numerical values. The variables in (a) and (b) are examples of quantitative variables. Quantitative variables may be characterized further as to whether they are discrete or continuous.
1.3.2 Discrete variables The variables in (a), above, can be counted. These are examples of discrete variables. A discrete variable is characterized by gaps or interruptions in the values that it can assume. The following example illustrates the point. The number of daily admissions to a hospital is a discrete variable since it must be represented by a whole number, such as 0, 1, 2 or 3. The number of daily admissions on a given day cannot be a number such as 1.8, 3.96 or 5.33.
1.3.3 Continuous variables The variables in (b), above, can be measured. These are examples of continuous variables. A continuous variable does not possess the gaps or interruptions characteristic of a discrete variable. A continuous variable can assume any value within a specific relevant interval of values assumed by the variable.
4 The Nature of Statistics
ELEMENTARY STATISTICAL METHODS
1.3.4 Qualitative variables Variables which cannot take numerical values are called qualitative variables. A qualitative variable can neither be measured nor be counted. The following are examples of qualitative variables: place of birth, nationality, colour, colour of hair, gender, blood group, smoking habit, surname, rank in military.
1.4
Measurement scales
Variables can further be classified according to the following four levels of measurement: nominal, ordinal, interval and ratio. A detailed discussion of this can be found in Stevens (1946).
1.4.1 Nominal scale This scale of measure applies to qualitative variables only. On the nominal scale, no order is required. For example, gender is nominal, blood group is nominal, and marital status is also nominal. On the nominal scale, categories are mutually exclusive. Thus an item must belong to exactly one category. Notice that we cannot do arithmetic operations on data measured on the nominal scale.
1.4.2 Ordinal scale This scale also applies to qualitative data. On the ordinal scale, order is necessary. This means that one category is lower than the next one or vice versa. For example, in the Army, the rank of private is lower than the rank of captain, which is lower than the rank of major, and so on. Thus the rank of an army officer is measured on the ordinal scale. In universities, the rank of an academic staff is measured on the ordinal scale. Grades are also ordinal, as excellent is higher than very good, which in turn is higher than good, and so on. It should be noted that in the ordinal scale, differences between category values have no meaning. For example, although Professor is higher than Lecturer, the difference between these two ranks does not exist numerically. Similarly, if 4 denotes “excellent”, 3 denotes “very good”, 2 denotes “good” and 1 denotes “fair”, it does not mean that a candidate who is rated “excellent” is twice as competent as a candidate who is rated “good”, just because “excellent” is denoted by 4 and “good” is denoted by 2.
1.4.3 Interval scale This scale of measurement applies to quantitative data only. In this scale, the zero point does not indicate a total absence of the quantity being measured. An example of such a scale is temperature on the Celsius or Fahrenheit scale. Suppose the minimum temperatures of 3 cities, A, B and C, on a particular day were 0 °C, 20 °C and 10 °C, respectively. It is clear that we can find the differences between these temperatures. For example, city B is 20 °C hotter than city A. However, we cannot say that city A has no temperature. Note that city A has a temperature equivalent to 32 °F. Moreover, we cannot say that city B is twice as hot as city C, just because The Nature of Statistics
5
ELEMENTARY STATISTICAL METHODS city B is 20 °C and city C is 10 °C. The reason is that, in the interval scale, the ratio between two numbers is not meaningful.
1.4.4 Ratio scale This scale of measurement also applies to quantitative data only and has all the properties of the interval scale. In addition to these properties, the ratio scale has a meaningful zero starting point and a meaningful ratio between 2 numbers. An example of variables measured on the ratio scale, is weight. A weighing scale that reads 0 kg gives an indication that there is absolutely no weight on it. So the zero starting point is meaningful. If Yaw weighs 40 kg and Akosua weighs 20 kg, then Yaw weighs twice as Akosua. Another example of a variable measured on the ratio scale is temperature measured on the Kelvin scale. This has a true zero point.
1.4.5 Summary of types of variables Fig. 1.1 shows a chart, summarizing the relationships between the various types of variables and measurement scales. Variables
Quantitative
Continuous e.g. height and mass
Qualitative
Discrete e.g. number of students
Nominal e.g. colour
Ordinal e.g. ranks and grades
Fig. 1.1: Types of variables
Exercise 1(a) 1. For each of the following variables, state whether it is quantitative or qualitative and specify the measurement scale that is employed when taking measurements on each. (a) gender of babies born in a hospital, (b) marital status, (c) temperature measured on the Kelvin scale, (d) nationality, (e) masses of babies in kg, (f) temperature in °C, (g) prices of items in a shop, (h) position in an exam. (i) the rank of an academic staff in a University. 6 The Nature of Statistics
ELEMENTARY STATISTICAL METHODS 2. For each of the following situations, answer questions (a) through (d): (a) What is the variable in the study? (b) What is the population? (c) What is the sample size? (d) What measurement scale was used? A. A study of 150 students from St. Ann School, showed that 10% of the students had blood group A. B. A study of 100 patients admitted to St. Paul’s Hospital, showed that 25 patients lived 8 km from the hospital. C. A study of 50 teachers in Town A showed that 5% of the teachers earn GH¢800.00 per month. 3. Explain what is meant by descriptive statistics. 4. Explain what is meant by inferential statistics. 5. Define the following terms: (a) population, (c) discrete variable, (e) continuous variable,
1.5
(b) qualitative variable, (d) sample, (f) quantitative variable.
Sources of statistical data
Sources of statistical data can be put into two main categories, depending on their originality. These are primary sources and secondary sources. Data from a primary source are called primary data while those from a secondary source are called secondary data.
1.5.1 Primary sources of data When data are originally collected by the researcher, they are called primary data. Primary data can be obtained by designing an experiment or by conducting a survey.
Experiments Frequently, the data needed to answer a question are available only as a result of an experiment. A researcher may wish to know which of several drugs is most effective for treating headache. The researcher might conduct an experiment by assigning the drugs to different patients. Subsequent evaluation of the responses to the different drugs might enable the researcher to decide which drug is most effective for treating headache.
Surveys In surveys, the aim of the researcher is to find a way of obtaining information from individuals, referred to as respondents. Such information can be factual (for example, the number of cars per household, age of respondents, or income) or can concern the attitudes of the respondent (for example, his attitude to racial discrimination, or his liking for a brand of cigarette). The Nature of Statistics
7
ELEMENTARY STATISTICAL METHODS A survey conducted on a whole population of interest is called a census and a survey conducted on a sample from a population is called a sample survey. Surveys involve the use of questionnaires to obtain desired information from respondents. Questionnaires may be administered by post, by telephone, by e-mail or in person.
Personal interview Here, we gather information through oral questioning.
Disadvantages • •
It can be very costly. Requires specially trained interviewers.
Advantages • • • •
It usually yields a high proportion of returns because a well-trained enumerator can establish the necessary rapport to ensure co-operation by the respondent. Information on conceptually difficult items can be obtained since the enumerator can explain what is required. The information obtained is likely to be more accurate than that obtained by other methods since the interviewer can clarify seemingly unclear questions by explaining the questions to the respondent. Visual materials to which the respondent is able to react can be presented.
Telephone interview This is a variation of the personal interview.
Advantages • • •
It saves time. It is cheaper than personal interviews. It is easy to train and direct interviewers.
Disadvantages • • •
Telephone subscribers are usually not representative of the whole population. There is therefore the risk of a biased survey, unless great care is taken in the use of the method. Sensitive questions cannot be asked in this type of enquiry. Its use is limited to urban areas with efficient telephone services.
8 The Nature of Statistics
ELEMENTARY STATISTICAL METHODS
Postal survey In postal survey, questionnaires are posted to respondents; they complete them and mail them back to you. The questionnaires are usually accompanied by a letter that explains the survey, encourages complete and candid answers and sets a deadline for returning responses. A stamped addressed envelope is customarily included to facilitate returns.
Advantages • • • •
It makes wide geographic coverage possible at comparatively little cost. There is no need to train interviewers. It encourages the respondent to answer questions frankly in the privacy of the home and without the subjective influence of the interviewers. There is lack of interviewer bias.
Disadvantages • • •
One cannot be sure of the interpretation placed by the respondent on the questions asked. There may be a delay in receiving responses. There is the problem of non-response to the survey. This non-response is certain to affect the validity of the survey as it is most unlikely that the sections of the sample that do and do not reply are similar in the characteristics under consideration.
1.5.2 Secondary sources of data Secondary data are data originally not collected under the supervision of the person or organization using the data. Secondary data are available from libraries, government agencies and the internet.
Libraries A common place to look for secondary data is a library. Here, data can be obtained from magazines, journals and newspapers.
Government agencies Government data can be obtained from publications issued by local, state, national and international governments. Such data include laws, regulations, statistics and consumer information.
Internet Secondary data can be obtained from search engines such as Yahoo, Google, MSN.com, etc., on the internet. The Nature of Statistics
9
ELEMENTARY STATISTICAL METHODS
Advantages of secondary data • •
Immediately available. Cheaper than obtaining new data.
Disadvantages of secondary data • • •
1.6
May be incomplete. May have been collected to satisfy different needs. No control exists over the method of collection and accuracy of the data.
Methods of data collection
Why do we sample from a population? In Section 1.1, we learnt that it is sometimes not feasible to study the entire population. Three reasons why we sample are: (a) The determination of the characteristic under investigation may involve a destructive test, as for example in determining the tensile strength of a metal specimen or the lifetime of a car battery. (b) It is sometimes impossible to check all items in a population. For example, it is not possible to count the population of fish in a lake, the population of birds and the population of snakes. (c) The cost of studying all the items in a population is often prohibitive and time consuming.
Sampling methods A sampling method (or sampling design) is a definite plan for obtaining a sample from a given population. Practical difficulties in handling certain parts of a population may point to their elimination from the scope of a survey. Thus, any sample selection procedure will give some individuals the chance to be included in the sample while excluding others. The people who have a chance of being included among those selected, constitute a sample frame. Examples are: the Electoral Register of Ghana (this contains the names of all those who can vote in Ghana), the list of members of professional associations (statisticians, doctors, lawyers, etc.).
Simple random sampling Once a researcher has made a decision about a sample frame, the next question is how to select the individual units to be included. One method is to use simple random sampling. Here, each item in the population has the same chance of being selected. The sample obtained by using simple random sampling is called a simple random sample. One way of obtaining a simple random sample is to use the “lottery system”. 10 The Nature of Statistics
ELEMENTARY STATISTICAL METHODS
The lottery system The lottery system consists of writing the name of each item in the sample frame on a slip of paper or a card and then drawing them from a container one after the other. To ensure a bias free selection, shuffle the cards or the slips of paper before each draw.
Advantages of the lottery system
• • •
It is independent of the properties of the population. It is a very reliable method of selecting random samples. It eliminates selection bias.
Disadvantages of the lottery system • •
It is time-consuming and cumbersome when the population is large. Cannot be used when the population is infinite.
A discussion of methods of data collection can be found from Levy and Lemeshow (1999) and Rao (2000).
1.7
Computers and statistical analysis
The recent widespread use of computers has had a tremendous impact on statistical analysis. Computers can perform more calculations faster and far more accurately than can human technicians. The use of computers makes it possible for investigators to devote more time to the improvement of the quality of raw data and the interpretation of the results. The current prevalence of microcomputers and the abundance of statistical software packages have further revolutionized statistical computing. The researcher in search of a statistical software package will find the book by Woodward et al. (1987) extremely helpful. This book describes approximately 140 packages. Among the most prominent ones are: Statistical Package for the Social Sciences (SPSS), S-plus, Minitab, SAS and GENSTAT. The spreadsheet, Excel, also has facilities for statistical analysis.
Exercise 1(b) 1. Give two reasons why it is sometimes necessary to take a sample from a population. 2. State two ways of obtaining primary data. 3. State two sources of secondary data. 4. State two advantages and two disadvantages of the lottery system for taking a simple random sample from a population. 5. State two disadvantages and one advantage of telephone interview, as a means of collecting data. The Nature of Statistics
11
ELEMENTARY STATISTICAL METHODS
Revision Exercises 1 1. Briefly describe the difference between descriptive statistics and inferential statistics. 2. A doctor examined a patient to determine the cause of a disease. He took a drop of blood and used it to determine the state of health of the patient. What aspect of statistics is the doctor employing in order to form a judgement? 3. In your own words, explain and give an example of each of the following statistical terms: (a) population, (b) sample. 4. Mrs. Akrong wants to check whether the pot of soup she is cooking has the right taste and quantity of salt. She did this by tasting a small portion of the soup scooped in a ladle. What aspect of statistics is she employing in order to form a judgement? Briefly explain why she decided to use this particular method? 5. Explain the difference between qualitative and quantitative data. Give examples of qualitative and quantitative data. 6. List the four levels of measurement and give examples. 7. Explain the difference between: (a) nominal and ordinal data, (c) a discrete data and a continuous data.
(b) a census and a sample survey,
References Levy, P. S. and Lemeshow, S. (1999). Sampling of populations, Methods and Appications. John Wiley and Sons Inc., New York. Rao, P. S. R. S. (2000). Sampling Methodologies with applications. Chapman and Hall, London. Stevens, S. S. (1946). On the theory of scales of measurement. Science, 103, 677 – 680. Woodward, W. A., Elliott, A. C. and Gray, H. L. (1987). Directory of Statistical Microcomputer Software. Marcel Dekker, New York.
12 The Nature of Statistics
ELEMENTARY STATISTICAL METHODS
C CH HA AP PT TE ER RT TW WO O Descriptive Statistics 2.1
Organization of data
In Chapter 1, you learnt that descriptive statistics is concerned with the collection, organization, and analysis of data. Now, suppose we have done a study and have collected a large quantity of data. The next step is to organize and summarize the data. In this section, we discuss how data can be organized so that important features can be grasped quickly and effectively.
2.1.1 Frequency distribution Table 2.1 gives the number of children per family for 54 families selected from Obo, a town in Ghana. The data, presented in the form in which it was collected, is called raw data.
Table 2.1: 0 1 2
1 1 0
Number of children per family 4 4 3 2 2 3 1 2 4 3 2 2 4 0 0 4 2 2 3 4 2 1 3 2 2 3 4
3 3 4
0 1 1
2 1 0
1 2 3
1 3 2
2 2 1
2 2 1
From Table 2.1, it can be seen that the minimum and the maximum numbers of children per family are 0 and 4, respectively. Apart from these numbers, it is impossible, without further careful study, to extract any exact information from the data. By breaking down the data into the form of Table 2.2, however, certain features of the data become apparent. For instance, from Table 2.2, it can easily be seen that most of the 54 families selected have two children. This information cannot easily be obtained from the raw data in Table 2.1.
Table 2.2:
Frequency distribution of the data in Table 2.1
Number of children 0 1 2 3 4
Tally
//// //// //// //// ////
/ //// // //// //// /// //// ///
Frequency 6 12 18 10 8 Total = 54
Table 2.2 is called a frequency table or a frequency distribution. It is so called because it indicates the frequency or number of times each observation occurs. Thus, by finding the frequency of each observation, a more intelligible picture is obtained. 13
ELEMENTARY STATISTICAL METHODS The steps for constructing a frequency distribution may be summarized as follows: (i) List all values of the variable in ascending order of magnitude. (ii) Form a tally column, that is, for each value in the data, record a stroke in the tally column next to the appropriate value. In the tally, each fifth stroke is made across the first four. This makes it easy to count the entries and enter the frequency of each observation. (Note: Values with frequency zero are omitted.) (iii) Check that the frequencies sum to the total number of observations.
2.1.2 Grouped frequency distribution Table 2.3 gives the body masses of 22 patients, measured to the nearest kilogram.
Table 2.3: 60 70
45 58
Body masses (in kilograms) of 22 patients 72 48
55 67
42 64
65 68
54 52
68 60
74 58
50 75
78 83
It can be seen that the minimum and the maximum body masses are 42 kg and 83 kg, respectively. A frequency distribution giving every body mass between 42 kg and 83 kg would be very long and would not be very informative. The problem is overcome by grouping the data into classes. If we choose the classes 41 – 49, 50 – 58, 59 – 67, 68 – 76 and 77 – 85, we obtain the frequency distribution given in Table 2.4.
Table 2.4:
Grouped frequency distribution of the data in Table 2.3
Mass (kg) 41 – 49 50 – 58 59 – 67 68 – 76 77 – 85
Tally /// //// / //// //// / //
Frequency 3 6 5 6 2 Total = 22
These are, of course, not the only classes which could be chosen. Table 2.4 gives the frequency of each group or class; it is therefore called a grouped frequency table or a grouped frequency distribution. Using this grouped frequency distribution, it is easier to obtain information about the data than using the raw data in Table 2.3. For instance, it can be seen from Table 2.4, that 17 of the 22 patients have body masses between 50 kg and 76 kg (both inclusive). This information cannot easily be obtained from the raw data in Table 2.3. It should be noted that, even though Table 2.4 is concise, some information is lost. The grouped frequency distribution does not give us the exact body masses of the patients. Thus the individual body masses of patients are lost in our effort to obtain an overall picture. However, Table 2.4 is far more comprehensible and its contents are easier to grasp than Table 2.3. 14 Descriptive Statistics
ELEMENTARY STATISTICAL METHODS We now define the terms that are used in grouped frequency tables. (i) Class limits The intervals into which the observations are put are called class intervals. The end points of the class intervals are called class limits. For example, the class interval 41 – 49, has lower class limit 41 and upper class limit 49. (ii) Class boundaries The raw data in Table 2.3 were recorded to the nearest kilogram. Thus, a body mass of 49.5 kg would have been recorded as 50 kg, a body mass of 58.4 kg would have been recorded as 58 kg, while a body mass of 58.5 kg would have been recorded as 59 kg. It can be seen that, the class interval 50 – 58, consists of measurements greater than or equal to 49.5 kg and less than 58.5 kg. The numbers 49.5 and 58.5 are called the lower and upper boundaries of the class interval 50 – 58. The class boundaries of the other class intervals are given in Table 2.5.
Table 2.5:
Body masses of 22 patients (to the nearest kg)
Class interval 41 – 49 50 – 58 59 – 67 68 – 76 77 – 85
[ S1 ]
Class boundaries 40.5 – 49.5 49.5 – 58.5 58.5 – 67.5 67.5 – 76.5 76.5 – 85.5
Class mark 45 54 63 72 81
Frequency 3 6 5 6 2
Notice that the lower class boundary of the i th class interval is the mean of the lower class limit of the class interval and the upper class limit of the (i − 1)th class interval (i = 2, 3, 4, …). For example, in Table 2.5, the lower class boundaries of the second and the fourth class intervals are
[S 2 ]
1 2
(50 + 49) = 49.5 and
1 2
(68 + 67) = 67.5, respectively.
It can also be seen that the upper class boundary of the i th class interval is the mean of the upper class limit of the class interval and the lower class limit of the (i + 1) th class interval (i = 1, 2, 3, … ). Thus, in Table 2.5, the upper class boundary of the fourth class interval (68 − 76) is
1 2
(76 + 77) = 76.5.
(iii) Class mark The mid-point of a class interval is called the class mark or class mid-point of the class interval. It is the average of the upper and lower class limits of the class interval. It is also the average of the upper and lower class boundaries of the class interval. For example, in Table 2.5, the class mark of the third class interval was found as follows: class mark =
1 (59 2
+ 67) =
1 (58.5 2
+ 67.5) = 63. Descriptive Statistics
15
ELEMENTARY STATISTICAL METHODS (iv) Class width The difference between the upper and lower class boundaries of a class interval is called the class width of the class interval. Class widths of class intervals can also be found by
subtracting two consecutive lower class limits, or by subtracting two consecutive upper class limits. In particular:
[S 3 ]
The width of the i th class interval is the numerical difference between the upper class limits of the i th and the (i − 1) th class intervals (i = 2, 3, …). It is also the numerical difference between the lower class limits of the i th and the (i + 1) th class intervals (i = 1, 2, …).
In Table 2.5, the width of the first class interval is 41 − 50 = 9. This is the numerical difference between the lower class limits of the first and the second class intervals. The width of the second class interval is 50 − 59 = 9. This is the numerical difference between the lower class limits of the second and the third class intervals. It is also equal to 58 − 49 , the numerical difference between the upper class limits of the first and the second class intervals.
Example 2.1 Table 2.6 gives the distribution of the lengths of 30 iron rods, measured to the nearest ten centimetres. Find the class widths and the class boundaries of the class intervals.
Table 2.6: Lengths of iron rods (to the nearest 10 cm) Length (cm) Frequency
60 – 90 3
100 – 150 6
160 – 200 10
210 – 250 7
260 – 310 4
Solution Table 2.7, on the next page, shows the required class boundaries and the class widths. The class widths were found as follows: Class width of the first class interval = 100 – 60 = 40 (see [S 3 ] ) . Class width of the second class interval = 150 – 90 = 60, etc. The class boundaries were found as follows: By [S 2 ] , the upper class boundary of the first class interval is
1 (90 + 100) = 95. 2
Since the class
width of this class interval is 40, the lower class boundary of the class interval is 95 – 40 = 55.
16 Descriptive Statistics
ELEMENTARY STATISTICAL METHODS By [S1 ] , the lower class boundary of the last class interval is
1 ( 250 + 260) = 2
255. The class width
of this class interval is 310 – 250 = 60 (see [S3 ]) . Therefore, the upper class boundary of the last class interval is 255 + 60 = 315.
Table 2.7:
Lengths of iron rods (to the nearest 10 cm)
Length (cm)
Class boundaries
Class width
60 – 90 100 – 150 160 – 200 210 – 250 260 – 310
55 – 95 95 – 155 155 – 205 205 – 255 255 – 315
100 – 60 = 40 150 – 90 = 60 200 – 150 = 50 250 – 200 = 50 310 – 250 = 60
Notice that, since the lengths of the iron rods are recorded to the nearest 10 cm, the lengths 45 cm, 46 cm, …, 54 cm will be recorded as 50 cm, while the lengths 55 cm, 56 cm, …, 64 cm will be recorded as 60 cm. Furthermore, the lengths 85 cm, 86 cm, …, 94 cm will be recorded as 90 cm while the length 95 cm will be recorded as 100 cm. It can therefore be seen that the observations in the first class interval are greater than or equal to 55 cm and less than 95 cm.
2.1.3 Guidelines for choosing class intervals (1) Given a set of raw data (that is, data which have not been organized numerically), before we construct a grouped frequency distribution, we have to decide on the number of class intervals to use in order to give the best indication of the trends in the data. If too few class intervals are used, important features of the distribution may be overlooked and if too many class intervals are used, then the purpose of the table, the reduction of the data to a manageable size, may be defeated. Experience has shown that the best number of class intervals to choose is between 5 and 20, depending upon such factors as the range and the number of observations. Those who wish to have more specific guidance in the matter of deciding how many class intervals are needed may refer to Sturges (1926). (2) Class intervals must be uniquely defined, i.e., class intervals must be chosen such that no value in the data can be included in two different classes. Consider, for example, Table 2.9, on the next page, which shows two groupings of the data in Table 2.8. It can be seen that, in Grouping 1, the class intervals are not uniquely defined. For example, the number 58 can be included in the first two class intervals while the number 64 can be included in the second and the third class intervals. Grouping 2, however, defines the class intervals uniquely and it is therefore preferred to Grouping 1. Descriptive Statistics
17
ELEMENTARY STATISTICAL METHODS
Table 2.8: 58 76
74 57
Marks obtained by 20 students in an examination
64 63
Table 2.9:
72 70
60 62
80 53
78 65
66 74
80 67
Frequency distribution of the data in Table 2.8
Grouping 1 Class boundaries 52 – 58 58 – 64 64 – 70 70 – 76 76 – 85 (3)
58 66
Grouping 2 Class boundaries 52.5 – 58.5 58.5 – 64.5 64.5 – 70.5 70.5 – 76.5 76.5 – 82.5
As previously pointed out, all values within a class interval are assumed to be concentrated at the class mark of that class interval. Class intervals should therefore be chosen such that the class marks coincide with actually observed data. The advantage of this method is that it tends to reduce errors brought about by grouping. Furthermore, calculations will be performed on the grouped data and the class marks will be used in these calculations. It is therefore convenient to choose class marks that will make these future calculations as simple as possible. Consider, for example, Table 2.11, which shows two groupings of the data given in Table 2.10. The class marks for Grouping 1 coincide with some of the observed data, whereas those for Grouping 2 do not. Moreover, it will be easier to use the class marks for Grouping 1 for further calculations than those for Grouping 2. Hence Grouping 1 would be preferred to Grouping 2.
Table 2.10: Masses of 18 eggs (to the nearest gramme) 47 50
72 64
46 52
68 49
57 67
62 47
62 71
58 72
69 57
Table 2.11: Frequency distribution of the data in Table 2.10 Grouping 1 Class limits Class marks 45 – 49 47 50 – 54 52 55 – 59 57 60 – 64 62 65 – 69 67 70 – 74 72 18 Descriptive Statistics
Grouping 2 Class limits Class marks 44 – 49 46.5 50 – 55 52.5 56 – 61 58.5 62 – 67 64.5 68 – 73 70.5
ELEMENTARY STATISTICAL METHODS (4)
Usually, it is convenient to make all class intervals of equal size, but there are occasions when class intervals of varying sizes can be used more effectively than those of equal size. For example, in Table 2.12, we see that the frequencies of the last three class intervals are small in comparison with those of the other class intervals. In cases such as this, we combine the last three class intervals. This gives Table 2.13.
Table 2.12: Ages of women blood donors Age ( in years ) 20.5 – 30.5 30.5 – 40.5 40.5 – 50.5 50.5 – 60.5 60.5 – 70.5 70.5 – 80.5 80.5 – 90.5
Frequency 687 705 998 453 142 93 10
Table 2.13: Ages of women blood donors Age ( in years )
Frequency
20.5 – 30.5 30.5 – 40.5 40.5 – 50.5 50.5 – 60.5 60.5 – 90.5
687 705 998 453 245
2.1.4 Relative frequency It is sometimes useful to know the proportion, rather than the number, of values falling within a particular class interval. We obtain this information by dividing the frequency of the particular class interval by the total number of observations. We refer to the proportion of values falling within a class interval as the relative frequency of the class interval. In Table 2.13, the relative frequency of the first class interval is 687 = 0.2225, 3088 since the class frequency is 687 and the sum of the frequencies is 3 088. Note that relative frequencies must add up to 1, allowing for rounding errors.
Descriptive Statistics
19
ELEMENTARY STATISTICAL METHODS
2.1.5 Cumulative frequency
In many situations, we are not interested in the number of observations in a given class interval, but in the number of observations which are less than (or greater than) a specified value. For example, in Table 2.5, on page 15, it can be seen that 3 patients have body masses less than 49.5 kg and 9 patients (i.e. 3 + 6) have body masses less than 58.5 kg. These frequencies are called cumulative frequencies. A table of such cumulative frequencies is called a cumulative frequency table or cumulative frequency distribution. Table 2.14 shows the data in Table 2.5 along with the cumulative frequencies and the relative frequencies. Notice that the last cumulative frequency is equal to the sum of all the frequencies.
Table 2.14:
Frequency, cumulative frequency, and relative frequency distributions of the data in Table 2.5
Mass (kg) 40.5 – 49.5 49.5 – 58.5 58.5 – 67.5 67.5 – 76.5 76.5 – 85.5
Frequency 3 6 5 6 2 Total = 22
Cumulative frequency 3 9 14 20 22
Relative frequency 0.1364 0.2727 0.2273 0.2727 0.0909 Total = 1.0000
Example 2.2 Table 2.15 gives the ages of a sample of patients who attended Hope Medical Hospital. (a) Find the sample size. (b) Complete the blank cells.
Table 2.15:
Ages of patients
Ages (years) 10 – 14 15 – 19 20 – 24 25 – 29 30 – 34
Freqency – 8 15 – –
Relative frequency – 0.16 – – –
Cumulative frequency – 12 – 37 –
Solution (a) If the sample size is n, then the relative frequency of the second class interval is 8 ÷ n. Hence, n is a root of the equation 8 8 = 0.16 ⇒ n = = 50 . n 0.16 The sample size is 50. 20 Descriptive Statistics
ELEMENTARY STATISTICAL METHODS (b) Table 2.16 gives the completed blank cells.
Table 2.16:
Ages of patients
Ages (years) 10 – 14 15 – 19 20 – 24 25 – 29 30 – 34
Freqency 4 8 15 10 13 Total = 50
Relative frequency 0.08 0.16 0.30 0.20 0.26 Total = 1.00
Cumulative frequency 4 12 27 37 50
Notice again that: (i) the last cumulative frequency is equal to the sum of all the frequencies; (ii) relative frequencies must add up to 1, allowing for rounding errors.
Exercise 2(a) 1. The following are the blood groups of a sample of patients who attend Peace Hospital.
A B AB
B B O
O A A
AB O B
B O A
A AB O
O O A
O B A
AB A B
B B A
(a) What is the population in this study? (b) What is the variable in this study? (c) Construct a frequency table for the data. 2. The following table shows the number of hours 45 hospital patients slept following the administration of a certain anesthetic.
7 12 4 8 3
10 11 5 13 1
12 3 5 1 17
4 8 8 7 10
8 1 7 17 4
7 1 7 3 7
3 13 3 4 7
8 10 2 5 11
5 4 3 5 8
(a) Construct a frequency distribution for the data using the class intervals 0 – 2, 3 – 5, 6 – 8, …, 15 – 17. (b) Find the relative frequencies and the cumulative frequencies of the frequency distribution in part (a). 3. Find the relative frequencies and the cumulative frequencies of the frequency distribution in Table 2.6 on page 16. Descriptive Statistics
21
ELEMENTARY STATISTICAL METHODS 4. In a certain study, blood glucose levels (in mg/dl) of a sample of students of St. Andrew High School were measured.
103 116 127 101
125 119 127 114
120 117 114 128
118 119 129 125
117 110 120 109
109 117 105 122
114 124 121 123
118 117 112 130
131 124 115 115
118 113 126 123
(a) State the population and the variable in the study. (b) Make a frequency table of the data using the class intervals 100 – 104, 105 – 109, 110 – 114, …, 130 – 134. (c) Obtain the class boundaries, class mid-points and class widths of the frequency distribution in part (a). (d) Find the relative frequencies and the cumulative frequencies of the frequency distribution in part (a). 5. Find the class boundaries, class mid-points and class widths of the class intervals of the following grouped frequency distributions. (a)
(b)
Class interval Frequency Class Interval 1500 – 1540 1550 – 1600 1610 – 1690 1700 – 1800 1810 – 1870
3–7 5 Frequency
4 6 10 7 3
8 – 10 15 (c)
11 – 15 25
16 – 18 12
Class Interval 50 – 90 100 – 240 250 – 340 350 – 440
19 – 25 7 Frequency 6 10 14 5
6. The following table gives the distribution of the ages of a sample of patients who attend Hope Hospital. Age (years) 5 – 14 15 – 24 25 – 34 35 – 44 45 – 54 55 – 64
Frequency 6 9 – 24 15 –
(a) What is the population in this study? (c) What is the sample size? 22 Descriptive Statistics
Relative Frequency 0.08 – 0.24 – – – (b) What is the variable in this study? (d) Complete the blank cells in the table.
ELEMENTARY STATISTICAL METHODS 7. The following table gives the distribution of the ages of a sample of 25 students from St. Luke’s School. Complete the blank cells in the table. Age (years)
Frequency
10 – 15 16 – 21 22 – 32 33 – 43 44 – 60
2 4 – – 5
Relative Frequency – – 0.32 – –
Cumulative Frequency – – – – –
8. The following are the number of babies born during a year in 60 community hospitals.
30 47 35 29 49 43
55 56 46 42 53 46
27 37 24 42 30 54
45 55 57 54 53 31
56 52 32 53 21 22
48 34 26 59 34 31
45 54 40 39 28 24
49 42 28 56 50 24
32 32 53 59 52 57
57 59 54 58 57 29
From these data: (a) Construct a frequency distribution using the class intervals 20 – 24, 25 – 29, 30 – 34, … (b) Find the relative frequencies and the cumulative frequencies of the frequency distribution in part (a). 9. The following are the lengths of 22 iron rods, measured to the nearest centimetre.
83 78
75 50
58 74
60 68
52 54
68 65
64 42
67 55
72 48
58 45
60 70
(a) Construct a frequency distribution using the class intervals 41 – 49, 50 – 58, …, 77 – 85. (b) Find the relative frequencies and cumulative frequencies of the frequency distribution in part (a).
2.2
Graphical representation of data
In the last section, we found that information given in a frequency distribution is easier to interpret than raw data. Information given in a frequency distribution in a tabular form is easier to grasp if presented graphically. Many types of diagrams are used in statistics, depending on the nature of the data and the purpose for which the diagram is intended. In this section, we discuss how statistical data can be presented by histograms and cumulative frequency curves. Descriptive Statistics
23
ELEMENTARY STATISTICAL METHODS
2.2.1 Histogram A histogram consists of rectangles with: (i) bases on a horizontal axis, centres at the class marks, and lengths equal to the class widths, (ii) areas proportional to class frequencies. If the class intervals are of equal size, then the heights of the rectangles are proportional to the class frequencies and it is then customary to take the heights numerically equal to the class frequencies. If the class intervals are of different widths, then the heights of the rectangles are class frequency . This ratio is called frequency density. proportional to class width
Example 2.3 Table 2.17 shows the distribution of the heights of 40 students selected from St. Paul High School. Draw a histogram to represent the data.
Table 2.17:
Heights of students
Height (cm) Frequency
150 – 154 3
155 – 159 4
160 – 169 16
170 – 174 10
175 – 184 6
185 – 189 1
Solution Since the class intervals have different sizes, the heights of the rectangles of the histogram are proportional to the frequency densities of the class intervals. The calculations of the heights of the rectangles can be set up as shown in Table 2.18. If d i is the frequency density of class interval i, then the height of the rectangle representing this class interval is cdi , where c is any positive number (see Table 2.18, column 5). Fig. 2.1, on the next page, shows a histogram for the data. It was drawn by taking c = 5. Notice that the centres of the bases of the rectangles of the histogram are at the class marks. If preferred, a histogram may be drawn showing class boundaries instead of class marks.
Table 2.18 Work table for computing the heights of rectangles of a histogram Height (cm) 150 – 154 155 – 159 160 – 169 170 – 174 175 – 184 185 – 189
Class width (a) 5 5 10 5 10 5
24 Descriptive Statistics
Frequency ( b) 3 4 16 10 6 1
Frequency density d i = (b)/(a) 0.6 0.8 1.6 2.0 0.6 0.2
Height of rectangle 0.6c 0.8c 1.6c 2.0c 0.6c 0.2c
187.0
179.5
172.0
164.5
152.0
157.0
5 × frequency density
ELEMENTARY STATISTICAL METHODS
Height (cm)
Fig. 2.1:
Histogram of the data in Table 2.17
Example 2.4
Table 2.19 shows the distribution of ages of 168 diabetic patients selected from Progress Hospital. A histogram is drawn to represent the data. If the height of the rectangle representing the second class interval is 3 cm, find the height of the rectangle which represents the third class interval.
Table 2.19: Ages of diabetic patients Age (years) Frequency
5–9 20
10 – 24 36
25 – 34 48
35 – 44 64
Solution The calculations of the heights of the rectangles of the histogram can be set up as shown in Table 2.20. Notice that the heights of the rectangles are proportional to the frequency densities of the class intervals (see Table 2.20, column 5).
Table 2.20:
Work table for computing the heights of rectangles of a histogram Class width Frequency Frequency density Height of Age (years) d i = (b) ÷ (a) (a) ( b) rectangle 5–9 5 20 4.0 4.0c 10 – 24 15 36 2.4 2.4c 25 – 34 10 48 4.8 4.8c 35 – 44 10 64 6.4 6.4c
If the height of the rectangle representing the second class interval is 3 cm, then 2.4c = 3 ⇔ c = 3 = 1.25. 2.4
The height of the rectangle which represents the third class interval is 4.8c cm = 4.8 × 1.25 cm = 6 cm. Descriptive Statistics
25
ELEMENTARY STATISTICAL METHODS Drawing a histogram 1. When drawing a histogram, suitable scales must be chosen for both the vertical and horizontal axes. Scales like “2 cm to 5 units” or “2 cm to 10 units” are the best. Avoid using scales like “2 cm to 3 units” or “2 cm to 7 units”. 2.
Label the axes.
3.
Give your graph a title.
2.2.2 Cumulative frequency curve
A graph obtained by plotting a cumulative frequency against the upper class boundary and joining the points by a smooth curve, is called a cumulative frequency curve. The following example illustrates an application of a cumulative frequency curve.
Example 2.5 Table 2.21 shows the frequency distribution of the body masses of 50 AIDS patients. (a) Draw a cumulative frequency curve to represent the data. (b) Use your cumulative frequency curve to estimate the number of patients whose body masses are: (i) less than 65 kg, (ii) at least 75 kg.
Table 2.21: Body masses of 50 AIDS patients Mass (kg) Frequency
30 – 39 3
40 – 49 6
50 – 59 17
60 – 69 13
70 – 79 8
80 – 89 3
Solution (a) The cumulative frequency table for the data is as follows: Mass (kg) less than 29.5 39.5 49.5 59.5 69.5 79.5 89.5
Cumulative frequency 0 0+3=3 3+6=9 9 + 17 = 26 26 + 13 = 39 39 + 8 = 47 47 + 3 = 50
Notice that a class with frequency zero is added before the first class. It can be seen that the last cumulative frequency is equal to the total number of observations, a check on the accuracy of our calculation. The corresponding cumulative frequency curve is shown in Fig. 2.2 on page 27. 26 Descriptive Statistics
ELEMENTARY STATISTICAL METHODS
Cumulative frequency
The curve is obtained by marking the upper class boundary on the horizontal axis and the cumulative frequencies on the vertical axis. All the points are joined by a smooth curve.
20
30
40
50
60 Mass
70
80
90
100
Fig. 2.2: Cumulative frequency curve of the data in Table 2.21 (b) (i) Since the body masses of the patients are recorded to the nearest integer, body masses less than 65 kg consist of all body masses less than 64.5 kg. Therefore, to estimate the number of patients whose body masses are less than 65 kg, we obtain the cumulative frequency which corresponds to the point 64.5 kg on the horizontal axis. From Fig. 2.2, we find that 33 patients have body masses less than 65 kg. (ii) To estimate the number of patients whose body masses are at least 75 kg, we first estimate the number of patients whose body masses are less than 75 kg. Now, the upper boundary of the interval “less than 75” is 74.5. From Fig. 2.2, the cumulative frequency which corresponds to the point 74.5 kg on the horizontal axis is 44. It follows that 44 patients have body masses less than 75 kg. Thus, the number of patients whose body masses are at least 75 kg is (50 – 44) = 6.
2.2.3 Frequency polygon A grouped frequency table can also be represented by a frequency polygon, which is a special kind of line graph. To draw a frequency polygon, we plot a graph of class frequencies against the corresponding class mid-points and join successive points with straight lines. Fig. 2.3, on the next page, shows the frequency polygon for the data in Table 2.16 on page 21. Descriptive Statistics
27
Frequency
ELEMENTARY STATISTICAL METHODS
4.5
9.5
Fig. 2.3:
14.5
19.5
24.5
29.5
34.5
39.5
Age (years) Frequency polygon of the data in Table 2.16
Frequency
Notice that the polygon is brought down to the horizontal axis at the ends of points that would be the mid-points if there were additional class intervals at each end of the corresponding histogram. This makes the area under a frequency polygon equal to the area under the corresponding histogram. Fig. 2.4 shows the frequency polygon of Fig. 2.3 superimposed on the corresponding histogram. This figure allows us to see, for the same set of data, the relationship between the two graphic forms.
4.5
9.5
14.5
19.5
24.5
29.5
34.5
39.5
Age (years) Fig. 2.4: 28 Descriptive Statistics
Histogram and frequency polygon of the data in Table 2.16
ELEMENTARY STATISTICAL METHODS
2.2.4 Stem-and-leaf plot A stem-and-leaf plot is a graphical device that is useful for representing a relatively small set of data which takes numerical values. To construct a stem-and-leaf plot, we partition each measurement into two parts. The first part is called the stem, and the second part is called the leaf. The stem of a measurement consists of one or more of the remaining digits. The stems form an ordered column with the smallest stem at the top and the largest at the bottom. The stems are separated from their leaves by a vertical line. We include in the stem column all stems within the range of the data even when a measurement with that stem is not in the data set. The rows of a stem-and-leaf plot contain the leaves, ordered and listed to the right of their respective stems. When leaves consist of more than one digit, all digits after the first may be omitted. Decimals, when present in the original data, are omitted in a stem-and-leaf plot. A stem-and-leave plot bears a strong resemblance to a histogram and serves the same purpose. A properly constructed stem-and-leaf plot, like a histogram, provides information regarding the range of the data set, shows the location of the highest concentration of measurements, and reveals the presence or absence of symmetry. An advantage of the stem-andleaf plot over the histogram is the fact that it preserves the information contained in the individual measurements. Such information is lost when we construct a grouped frequency table. Another advantage of a stem-and-leave plot is that it can be constructed during the tallying process, so the intermediate step of preparing an ordered array is eliminated. Stem-and-leaf plots are most effective with relatively small data sets. As a rule, they are not suitable for use in annual reports or other communications aimed at the general public. They are useful in helping researchers understand the nature of their data. Histograms are more appropriate for externally circulated publications. The following example illustrates the construction of a stem-and-leaf plot.
Example 2.6 The following are the marks scored by 30 candidates in an English test. Construct a stem-andleaf plot for the data.
56 53 85
71 75 88
62 78 94
81 78 96
52 56 96
61 64 67
73 65 89
80 76 78
84 78 79
93 78 68
Solution Since all the measurements are two-digit numbers, we will have one-digit stems and one-digit leaves. For example, the mark 85 has a stem of 8 and a leaf of 5. Fig.2.5, on the next page, is the required stem-and-leaf plot. The four numbers in the first row represent 52, 53, 56 and 56. Descriptive Statistics
29
ELEMENTARY STATISTICAL METHODS 5 6 7 8 9 Fig. 2.5:
2 1 1 0 3
3 2 3 1 4
6 4 5 4 6
6 5 7 8 6 8 8 8 8 8 9 5 8 9 6
Stem-and-leaf plot of the data in Example 2.6
2.2.5 The Box-and-Whisker plot Another graphical display of a set of data is the box-and-whisker plot (or simply box plot). The following are the steps for drawing a box-and-whisker plot. (1) Represent the variable of interest on a horizontal line (or sometimes on a vertical line). (2) Draw a box in the space above the horizontal axis in such a way that the left end of the box aligns with the first quartile (Q1) and the right end of the box aligns with the third quartile (Q3). (Readers not already familiar with quartiles may refer to Section 2.4 of the book). (3) Divide the box into two parts by a vertical line that aligns with the median, Q2. (4) Draw a horizontal line, called a whisker, from the left end of the box to a point that aligns with the smallest measurement in the data set. (5) Draw another horizontal line (or whisker) from the right end of the box to a point that aligns with the largest measurement in the data set. Fig. 2.6 shows a box plot representing data, whose minimum value is 2, lower quartile 4, median 5, upper quartile 7, and maximum value 10.
0
1
2
3 4 5 6 7 8 9 Fig. 2.6: A box-and-whisker plot
10
11
It can be seen that, a box plot gives a visual summary of five key numbers that are associated with a set of data. These are the minimum value, the lower quartile, the median, the upper quartile and the maximum value. Examination of a box-and-whisker plot for a set of data reveals information regarding the amount of spread, location of concentration, and summary of the data.
Example 2.7 Figure 2.7, on the next page, shows the box plot of a set of data. Write down (a) the quartiles of the data, (b) the maximum value of the data.
30 Descriptive Statistics
ELEMENTARY STATISTICAL METHODS
8
9
10
11
12
13
14
15
16
Fig. 2.7: A box plot Solution (a) Q1 = 10,
Q2 = 12,
Q3 =13.
(b) the maximum value of the data is 15.
Exploratory data analysis
Box-and-whisker plots and stem-and-leaf plots are examples of what are known as exploratory data analysis techniques. These techniques allow the investigator to examine data in ways that reveal trends and relationships, identify unique features of data sets, and facilitate their description and summarization. Books by Turkey (1977) and Du Toit et al. (1986) provide an overview of most of the well known methods of analyzing and portraying data graphically with emphasis on exploratory techniques.
2.2.6 Bar chart A bar chart is a diagram consisting of a series of horizontal or vertical bars of equal width. The bars represent various categories of the data. There are three types of bar charts, and these are simple bar charts, component bar charts and grouped bar charts. (i) Simple bar chart In a simple bar chart, the height (or length) of each bar is equal to the frequency it represents.
Example 2.8 Table 2.22 gives the production of timber in five districts of Ghana in a certain year. Draw a bar chart to illustrate the data.
Table 2.22:
Production of timber in 5 districts in Ghana
District Bibiani Nkawkaw Wiawso Ahafo Agona
Production of timber (tonnes) 600 900 1800 1500 2400
Solution Fig. 2.8, on the next page, represents the required bar chart. Notice that the bars are of equal width and the distances between them are equal. Descriptive Statistics
31
Production of timber (in tonnes)
ELEMENTARY STATISTICAL METHODS
Bibiani
Nkawkaw
Wiawso
Ahafo
Agona
Districts Fig. 2.8: A simple bar chart for the data in Table 2.22 (ii) Component bar chart In a component bar chart, the bar for each category is subdivided into component parts; hence its name. Component bar charts are therefore used to show the division of items into components. This is illustrated in the following example.
Example 2.9 Table 2.23 shows the distribution of sales of agricultural produce from Asiedu Farm in 1995, 1996 and 1997. Illustrate the information with a component bar chart.
Table 2.23: Sales of agricultural produce from Asiedu Farm Agricultural produce Coffee Cocoa Palm oil
1995 90 180 30
Sales (million dollars) 1996 120 140 30
1997 180 220 20
Solution Fig. 2.9, on the next page, shows a component bar chart for the data. The sales of agricultural produce consist of three components: the sales of coffee, cocoa, and palm oil. The component bar chart shows the changes of each component over the years as well as the comparison of the total sales between different years. 32 Descriptive Statistics
Sales (million dollars)
ELEMENTARY STATISTICAL METHODS
Palm oil Cocoa Coffee
1995
1996 1997 Year Fig. 2.9: A component bar chart of the data in Table 2.23 (iii) Grouped bar chart For a grouped bar chart, the components are grouped together and drawn side by side. We illustrate this with the following example.
Example 2.10
Illustrate the data in Table 2.23 with a grouped bar chart.
Sales (million dollars)
Solution Fig. 2.10 shows the required grouped bar chart.
Palm oil Cocoa Coffee
1995 Fig. 2.10:
1996 1997 Year A grouped bar chart of the data in Table 2.23 Descriptive Statistics
33
ELEMENTARY STATISTICAL METHODS
2.2.7 Pie Charts
A pie chart is a circular graph divided into sectors, each sector representing a different value or category. The angle of each sector is proportional to the value of the part of the data it represents. The following are the steps for drawing a pie chart. (1) Find the sum of the category values. (2) Calculate the angle of the sector for each category, using the following result: value of category A × 360o. angle of the sector for category A = sum of category values (3) Draw a circle and mark the centre. (4) Use a protractor to divide the circle into sectors, using the angles obtained in step 2. (5) Label each sector clearly.
Example 2.11 A housewife spent the following sums of money on buying ingredients for a family Christmas cake in 2007. Flour…………GH¢24 Eggs…………….. GH¢60 Margarine…… GH¢96 Baking powder…. GH¢12 Sugar………… GH¢18 Miscellaneous…… GH¢30 Represent the above information on a pie chart. Solution The angles of the sectors are calculated as shown in Table 2.24. Table 2.24: Work table for computing the angles of the sectors of a pie chart Item Flour
Amount used (GH¢) 24
Margarine
96
Sugar
18
Eggs
60
Baking powder
12
Miscellaneous
30
Total
240
Fig. 2.11, on the next page, shows the required pie chart. 34 Descriptive Statistics
Angle of sector 24 × 360 o = 36o 240 96 × 360 o = 144o 240 18 × 360 o = 27o 240 60 × 360 o = 90o 240 12 × 360 o = 18o 240 30 × 360 o = 45o 240
360o
ELEMENTARY STATISTICAL METHODS Miscellaneous
Flour
Eggs o
Sugar
36o 45 27 o 144o
18o
Baking powder
Margarine
Fig. 2.11: A pie chart of the data in Table 2.24
Exercise 2(b) 1. Refer to Exercise 2(a), Question 2. Construct a histogram and a frequency polygon using the frequency distribution in part (a). 2. Refer to Exercise 2(a), Question 8. Use the frequency distribution in part (a) to construct a histogram and a frequency polygon to represent the data. 3. The following are the ages of 30 patients seen in the emergency room of a hospital on a Monday night. Construct a stem-and-leaf plot for the data.
32 21 35 43 39 60 36 12 37 53 45 23 64 10 34 22 55 44 55 46 22 38 35 56 4. The following table gives the ages (in years) of 60 cancer patients. Age (years) Frequency
5 – 14 8
15 – 19 16
20 – 24 18
54 36 45
25 – 29 12
45 45 57 30 – 44 6
A histogram is drawn to represent this data. If the height of the rectangle representing the fifth class interval is 2 cm, find the heights of the rectangles representing the first, second and the third class intervals. Draw a histogram to represent the data. 5. The following table gives the distribution of the heights of 100 children, to the nearest centimetre.
Height (cm) 120–129 Frequency 6
130–139 140–149 150–159 160–169 170–179 15 31 37 9 2 Descriptive Statistics
35
ELEMENTARY STATISTICAL METHODS Draw a cumulative frequency curve for the data and use it to estimate: (a) the number of children whose heights are between 142 cm and 152 cm (inclusive), (b) the number of children whose heights are greater than 156 cm. 6. The following table gives the distribution of the marks scored by 40 students in an examination.
Mark (%) Frequency
30 – 34
35 – 39
40 – 44
45 – 49
50 – 54
55 – 59
60 – 64
65 – 69
2
4
7
10
8
5
3
1
Draw a cumulative frequency curve for the data and use it to estimate: (a) the number of students who scored between 42% and 62% (inclusive), (b) the least mark a student must score if he/she is to be placed in the top 25% of the class. 7. The following table gives the enrolments in primary and secondary schools in Kenya. Number of students (thousands) Primary School Secondary School 350 154 351 176 353 177 354 180
Year 1971 1975 1979 1983
Illustrate the information with (a) a component bar chart,
(b) a grouped bar chart.
8. The heights, in centimeters, of 30 boys are as follows:
168 155 177
149 172 177
156 155 168
161 162 168
172 164 157
171 165 143
156 166 158
141 173 157
151 174 145
142 176 146
Construct a stem- and- leaf plot of the data (for a boy whose height is 162 cm, record this as a stem of 16 and a leaf of 2.) 9. The following table shows the amount of rainfall in Asarekrom during the first five months of 2006. Draw a bar chart to illustrate the data.
Month Rainfall (cm)
January 5.3
February 4.9
March 6.0
April 5.2
May 3.4
10. The following table gives the frequency distribution of the results of an examination taken by students from two schools M and N. Draw a grouped bar chart to represent this information. 36 Descriptive Statistics
ELEMENTARY STATISTICAL METHODS
Grade School M School N
A 5 18
B 8 22
C 38 20
D 14 10
E 25 25
F 10 5
11. The following information gives the proportion in which Yaro spends his annual salary.
Food Rent Transport
30% 15% 7.5%
Income Tax 20% Savings 5% Miscellaneous 22.5%
(a) Draw a pie chart to illustrate the above information. (b) If Yaro’s annual salary is GH¢1 800.00, calculate the amount he spends on food. 12. The level of water in a reservoir is checked every morning at 9 o’clock. One Monday, the level was 61 mm above the zero mark. On each of the next three days, the level fell by 12 mm per day. However, because of a storm in the night, it was found that the level on Friday was 38 mm higher than on Thursday. For the next three days, the level fell by 18 mm per day. (a) Make a table of the water level during this week. (b) Draw a bar chart to illustrate this information. 13. The following table shows the distribution of academic staff by faculty and rank in a certain university. Illustrate the information with (a) a component bar chart (b) a grouped bar chart Faculty Business Administration Social Studies General Studies
Professors 2 6 3
Senior Lecturers 3 2 1
Lecturers 12 13 6
14. In an election, the number of votes won by political parties A, B, C, D and E in a village are as follows:
Party No. of votes
A 140
B 110
C 190
D 520
E 240
(a) Draw a pie chart to illustrate this information. (b) What percentage of the total votes did the winner obtain? 15. The table below shows the number of cars sold by a company from January to June, 1990:
January 7 100
February 7 668
March 10 366
April 9 940
May 8 236
June 7 810
(a) Draw a pie chart to illustrate this information. (b) What is the percentage of cars sold in February? Descriptive Statistics
37
ELEMENTARY STATISTICAL METHODS
2.3
Measures of central tendency
In the above sections, you have learnt how data can be summarised in the form of tables and presented in the form of graphs so that important features can be illustrated easily and more effectively. In this section, we consider statistical measures which can be used to describe the characteristics of a set of data. We are interested in a single value that serves as a representative value of the overall data. Three of such measures are the mean, the mode, and the median. These three measures reflect numerical values in the centre of a set of data and are therefore called measures of central tendency.
2.3.1 The mean The mean of a set of numbers x 1 , ..., x n is denoted by x , and is defined by the equation
[S 4 ]
1 n
x = (x 1 + x 2 + x 3 + ... + x n ) =
It can be seen from [S 4 ] , that:
[S 5 ]
1 n
n
∑ x i.
i =1
nx = x1 + x2 + x3 + ... + xn .
Example 2.12 Find the mean of the numbers 2, 4 , 7, 8, 11, 12. Solution The mean =
2 + 4 + 7 + 8 + 11 + 12 44 = = 7.33. 6 6
Example 2.13 The set of numbers x 2 , 3, 3 x − 4, 7, 9, where x is a positive integer, has a mean of 5. Find the value of x. Solution The value of x is given by the equation 1 2 (x 5
+ 3 + 3 x − 4 + 7 + 9) = 5
⇔ x 2 + 3 x + 15 = 25 ⇔ x 2 + 3x − 10 = 0 ⇔ ( x + 5)( x − 2) = 0 ⇔ x = −5 or x = 2. Since x is a positive integer, we reject the negative root. Hence x = 2. 38 Descriptive Statistics
ELEMENTARY STATISTICAL METHODS
Example 2.14
The maximum load that a lift can take is 1 000 kg. If 5 men with a mean weight of 61 kg and 12 women with a mean weight of 52 kg take the lift, will their total weight exceed the maximum load? Solution The total weight of the 5 men and the 12 women is (see [S 5 ] ) 5 × 61 kg + 12 × 52 kg = 929 kg. This total weight is less than 1 000 kg and so does not exceed the maximum load the lift can take.
The mean of a frequency distribution If the numbers x1 , x2 , x3 ,..., xk occur with frequencies f1 , f 2 , f 3 ,..., f k , respectively, then their mean is given by x =
∑ f ix i f 1x 1 + f 2 x 2 + f 3 x 3 + ... + f k x k = ……………………...………………(2.3.1) f 1 + f 2 + f 3 + ... + f k ∑f i
Example 2.15 Table 2.25 shows the body masses of 50 men. Find the mean body mass.
Table 2.25:
Body masses of 50 men Mass (kg) 59 60 61 62 Frequency 3 9 23 11
63 4
Solution The calculation can be arranged as shown in Table 2.26.
Table 2.26: Work table for calculating the mean Mass (x)
Frequency ( f )
fx
59 60 61 62 63
3 9 23 11 4 ∑ f = 50
177 540 1 403 682 252 ∑ fx = 3 054
fx 3 054 = 61.08. x=∑ = 50 ∑f The mean body mass is 61.08 kg. Descriptive Statistics
39
ELEMENTARY STATISTICAL METHODS
Assumed mean method
The amount of computation involved in using Equation (2.3.1) can be reduced by using the following result: If M is any guessed mean or assumed mean (which may be any number) and if d i = x i − M (i = 1, 2,..., k ), then Equation (2.3.1) becomes ∑ fi di ................................................................................................ (2.3.2) x =M + ∑ fi This method is called “finding the mean by the assumed mean method”. The following example illustrates an application of the assumed mean method.
Example 2.16 Solve Example 2.15 by using a suitable assumed mean. Solution We choose 61 (the number with the highest frequency) as the assumed mean. The solution can be arranged as shown in Table 2.27.
Table 2.27: Calculations for Example 2.16 Mass (x) 59 60 61 62 63
x = (61 +
1 ∑ 50
Frequency ( f ) 3 9 23 11 4 f ∑ = 50
(
fd ) = 61 +
4 50
d = x − 61
−2 −1 0 1 2
fd –6 −9 0 11 8 fd = 19 − 15 = 4 ∑
) = 61.08 kg, as before.
It should be noted that the assumed mean can be any real number. However, the amount of computation can be reduced further if we take the number with the highest frequency as the assumed mean.
The mean of a grouped frequency distribution Equations (2.3.1) and (2.3.2) are valid for grouped frequency distributions if we interpret x i as the class mark of a class interval and f i the corresponding class frequency. In the following example, we apply Equation (2.3.1) to find the mean of a grouped frequency distribution.
40 Descriptive Statistics
ELEMENTARY STATISTICAL METHODS
Example 2.17
Table 2.28 shows the distribution of the marks scored by 60 students in a Physics examination. Find the mean mark.
Table 2.28: Marks scored in a Physics examination Mark ( % ) Number of students
60 – 64 2
65 – 69 15
70 – 74 25
75 – 79 14
80 – 84 4
Solution The solution can be arranged as shown in Table 2.29.
Table 2.29: Calculations for Example 2.17 Marks 60 – 64 65 – 69 70 – 74 75 – 79 80 – 84
Class mark (x) 62 67 72 77 82
Frequency ( f ) 2 15 25 14 4
fx 124 1 005 1 800 1 078 328
∑ f = 60
∑ fx = 4 335
∑ fx 4335 = = 72.25. 60 ∑f The mean mark is 72.25 %. x=
If all the class intervals of a grouped frequency distribution have equal size c, then Equation (2.3.2) takes the form ∑ fi ui …………………………………………………...…………….(2.3.3) x = M +c ∑ fi x −M where ui = i , ( i = 1, 2, … , k). c This is called the “coding” method for computing the mean. It is a very short method and should always be used for finding the mean of a grouped frequency distribution with equal class widths.
Example 2.18 Use the coding method to solve Example 2.17. Solution The width of each class interval is 5 and so c = 5. We take M = 72, the class mark with the highest frequency. The calculations can be arranged as shown in Table 2.30 on the next page. Descriptive Statistics
41
ELEMENTARY STATISTICAL METHODS
Table 2.30: Calculations for Example 2.18 u = x − 72
Mark
Class mark (x)
Frequency ( f )
60 – 64 65 – 69 70 – 74 75 – 79
62 67 72 77
2 15 25 14
−2 −1 0 1
80 – 84
82
4 60
2
x = 72 + 5 ×
3 60
= 72 +
1 4
fu
5
−4 −15 0 14 8 ∑ fx = 22 − 19 = 3
= 72.25.
In calculating the mean of a grouped frequency distribution, we assume that all values within a class interval are coincident with the class mark of that class interval. The fact that this is not usually the case, means that the mean calculated from a grouped data is likely to differ from the mean of the original (ungrouped) data. As already pointed out in Section 2.1, this error, brought about by grouping, can be minimized by choosing class intervals such that class marks coincide with actually observed data.
2.3.2 The median
The median of a set of data is defined as the middle value when the data is arranged in order of magnitude. For a set of N observations x1 , x2 , ... , xN arranged in order of magnitude, there are two cases: [S6 ] If N is odd, then the median is given by median = the
[S7 ] If
1 2
( N + 1) th ordered observation.
N is even, then the median is given by median =
1 2
{ the (
1 2
N)
th
ordered observation
+ the
( 12 N + 1)
th
Example 2.19 Find the median of each of the following sets of numbers. (a) 12, 15, 22, 17, 20, 26, 22, 26, 12 (b) 4, 7, 9, 10, 5, 1, 3, 4, 12, 10 Solution (a) Arranging the data in an increasing order of magnitude, we obtain 12, 12, 15, 17, 20, 22, 22, 26, 26 Here, N (= 9) is odd, and so ( see [S 6 ] ), 42 Descriptive Statistics
}
ordered observation
ELEMENTARY STATISTICAL METHODS median = the
1 2
( 9 + 1)th
ordered observation = the 5th ordered observation = 20.
Notice that if a number is repeated, we still count it the number of times it appears when we calculate the median.
(b) Arranging the data in an increasing order of magnitude, we obtain 1, 3, 4, 4, 5, 7, 9, 10, 10, 12 Here, N(=10) is an even number and so ( see [S 7 ] ) median =
1 2
{the 5th ordered observation + the 6th ordered observation} =
1 (5 + 7) 2
= 6.
Notice that, in each case, the median divides the distribution into two equal parts, with 50% of the observations greater than it and the other 50% less than it.
Example 2.20
The following are the ages (in years) of 30 children at a birthday party. Find the median age of the 30 children: 4, 3, 5, 8, 4, 6, 7, 8, 6, 4, 5, 6, 7, 5, 7, 6, 6, 5, 4, 4, 4, 3, 5, 6, 8, 7, 3, 6, 5, 8. Solution In order to find the median of the data, we first prepare a frequency table for the data. This method is recommended when we have a large number of observations. Table 2.31 gives a frequency table of the data.
Table 2.31:
Ages, in years, of children at a birthday party
Age ( x ) 3 4 5 6 7 8
Tally
/// //// / //// / //// // //// ////
Frequency ( f ) 3 6 6 7 4 4
The total number of observations is 30, an even number, so the median is given by ( see [S 7 ] on page 42) median = 1 ( the 15th ordered observation + the 16th ordered observation ). 2
Now, the sum of the first 3 frequencies is 15, while the sum of the first four frequencies is 22. Hence, the 15th and 16th ordered observations are 5 and 6, respectively. Therefore, median = 12 (5 + 6) = 5.5. The median age is 5.5 years. Descriptive Statistics
43
ELEMENTARY STATISTICAL METHODS
Example 2.21
The monthly salaries of five employees of a certain firm are given as: $252.00, $396.00, $328.00, $924.00, $375.00. Find (a) the mean monthly salary, (b) the median monthly salary. Which of these two measures is more typical of the salaries of the five employees? Give reasons. Solution
(a) The mean monthly salary is $
{ ( 252 + 396 + 328 + 924 + 375)} = $455.00. 1 5
(b) We first arrange the salaries in order of magnitude. This gives: $252.00, $328.00, $375.00, $396.00, $924.00. Since there is an odd number of observations, the middle value, $375.00, is the median monthly salary. In this example, the mean salary gives a false picture since it is greater than the salaries of 4 out of the 5 employees. The median salary is, however, “close” to the salaries of most of the employees. It is therefore more representative of the data than the mean salary. (Notice that the median salary is not affected by the extreme value $924.00, while the mean salary is affected by it.)
The median of a grouped frequency distribution The exact value of the median of a grouped data cannot be obtained because the actual values of a grouped data are not known. For a grouped frequency distribution, the median is in the class 1 2
interval which contains the ( N )th ordered observation, where N is the total number of observations. This class interval is called the median class. The median of a grouped frequency distribution can be estimated by either of the following two methods: (i) Linear interpolation method for estimating the median The median of a grouped frequency distribution can be estimated by linear interpolation. We assume that the observations are evenly spread through the median class. The median can then be computed by using the following formula: ⎛1N −F⎞ where N = total number of observations, ⎟ c, [S8 ] Median = L + ⎜⎜ 2 L = lower class boundary of the ⎟ ⎝ fm ⎠ median class, F = sum of all frequencies below L, f m = frequency of the median class, c = class width of the median class. An application of this formula is given in Example 2.22, on the next page. 44 Descriptive Statistics
ELEMENTARY STATISTICAL METHODS (ii) Estimation of the median from a cumulative frequency curve
1 2
Cumulative Frequency
The median of a grouped frequency distribution can be estimated from a cumulative frequency curve. A horizontal line is drawn from the point
N on the vertical axis to meet the
1 2
N
cumulative frequency curve. From the Median point of intersection, a vertical line is dropped to the horizontal axis. The value on the horizontal axis is equal to the median, as shown is Fig. 2.12. An N = total frequency application of this method is given in Fig. 2.12: Estimation of the median Example 2.22. It should be noted that in determining the median of a grouped frequency distribution by these two methods, we assume that the original data, ungrouped, are evenly spread through the median class. The fact that this is not usually the case means that the value obtained is likely to differ from that obtained by using the original data.
Example 2.22 Table 2.32 gives the distribution of the heights of 60 students in a Senior High school. Find the median height of the students and explain the significance of the result.
Table 2.32: Heights of students Height (cm) Number of students
145 – 149
150 – 154
155 – 159
160 – 164
165 – 169
170 – 174
3
9
16
18
10
4
Solution We give two methods for solving the problem.
First method
Here, we estimate the median by linear interpolation. We first determine the median class. Now, N = ∑ f = 60. Therefore the median is the
(
1 × 60 = 30 2
)
th
ordered observation. The sum of
the first three class frequencies is 28 while the sum of the first four class frequencies is 46. The median class is therefore the fourth class interval with class boundaries 159.5 and 164.5. Thus, ( see [S 8 ] ) L = 159.5, c = 164.5 – 159.5 = 5, f m =18, and F = 28. The median height is therefore equal to ⎛ 1 × 60 − 28 ⎞ 2 159.5 + ⎜ 2 ⎟⎟ × 5 cm = 159.5 + 18 × 5 cm = 160.1 cm. ⎜ 18 ⎝ ⎠
(
)
Descriptive Statistics
45
ELEMENTARY STATISTICAL METHODS This means that 50% of the students are less than 160.1 cm tall and the other 50% are more than 160.1 cm tall.
Second method
Here, we estimate the median from a cumulative frequency curve. We first prepare the cumulative frequency table for the data in Table 2.32. This is given in Table 2.33. Table 2.33: Cumulative frequency table of the data in Table 2.32 Height (cm) less than 144.5 149.5 154.5 159.5 164.5 169.5 174.5
Cumulative frequency 0 3 12 28 46 56 60
Fig. 2.13 shows the cumulative frequency curve for the data.
Cumulative frequency
60 50 40
30 20 10 0 144.5
149.5
154.5
159.5
164.5
169.5
174.5
Height (cm) Fig. 2.13: Cumulative frequency curve of the data in Table 2.32
To estimate the median height, we draw a horizontal line from the point
(
1 × 60 = 30 2
) on the
vertical axis to meet the cumulative frequency curve. From the point of intersection, a vertical line is dropped to the horizontal axis, meeting it at the point 160 cm. The median height of the students is therefore 160 cm. 46 Descriptive Statistics
ELEMENTARY STATISTICAL METHODS
2.3.3 The mode
The mode of a set of data is the value which occurs with the greatest frequency. The mode is therefore the most common value.
Example 2.23 (a) The mode of 1, 2, 2, 2, 3 is 2. (b) The modes of 2, 3, 4, 4, 5, 5 are 4 and 5. (c) The mode does not exist when every observation has the same frequency. For example, the following sets of data have no modes: (i) 3, 6, 8, 9; (ii) 4, 4, 4, 7, 7, 7, 9, 9, 9.
It can be seen that the mode of a distribution may not exist, and even if it exists, it may not be unique.
Example 2.24 20 patients selected at random had their blood groups determined. The following are the results. Blood group Number of patients
A 2
B 4
AB 6
O 8
The blood group with the highest frequency is O. The mode of the data is therefore blood group O. We can say that most of the patients selected have blood group O. Notice that the mean and the median cannot be applied to the data in Example 2.24. This is because the variable “blood group” cannot take numerical values. However, it can be seen from Examples 2.23 and 2.24, that the mode can be used to describe both quantitative and qualitative data.
For a grouped frequency distribution, the class interval with the highest frequency is called the modal class. Fig. 2.14 shows a histogram for a grouped frequency distribution. The modal class is the class interval which corresponds to rectangle ABCD. An estimate of the mode of the distribution is the abscissa of the point of intersection of the line segments AE and BF in Fig. 2.14.
Frequency
The mode of a grouped frequency distribution A
B
F
E
C Class boundary Mode Fig. 2.14: A histogram, showing how to estimate the mode
D
Descriptive Statistics
47
ELEMENTARY STATISTICAL METHODS The following example illustrates how to estimate the mode of a distribution from a histogram.
Example 2.25
The following table shows the distribution of the marks scored by 20 students in a Mathematics quiz.
Table 2.34: Mark Frequency
Marks scored by students 1–5 3
6 – 10 4
11 – 15 7
16 – 20 2
21 – 25 4
Draw a histogram for the distribution and use it to estimate the mode of the distribution. Solution Fig. 2.15 shows a histogram for the data. To estimate the mode of the distribution from Fig. 2.15, we determine the abscissa of the point of intersection of the line segments AC and BD . This gives the estimated modal mark as 12.5.
Frequency
A
B
D
C
0.5
5.5
10.5 15.5 Mark
20.5
25.5
Fig. 2.15: Histogram of the data in Table 2.34
2.3.4 Relative merits of the mean, the median and the mode We have looked at three different measures of central tendency and we now consider them in the light of the various information they give about sets of data. By examining the advantages and limitations of each of the three measures, we may know what information they give. The mean (i) The mean is unique for any set of quantitative data. That is, there is one and only one mean for a given set of quantitative data. 48 Descriptive Statistics
ELEMENTARY STATISTICAL METHODS (ii)
Its main characteristic and virtue is that in its calculation, every value in the data is used. To this extent, the mean may be regarded as more representative than the other two. (iii) Since it is the result of arithmetic processes, it can be used for further calculation. For example, knowing the mean and the total frequency of a set of data, their product gives the sum of all the observations in the data. (iv) Its main defect is that it is affected by extreme values (see Example 2.21). (v) It is applicable to quantitative data only. The median (i) It is unique; that is, like the mean, there is one and only one median for a given set of data. (ii) The median cannot be found for nominal data. (iii) Because of its definition, the median is especially useful in describing data that naturally falls into rank order, such as grades, and salaries. (iv) It is preferred to the mean as a measure of central tendency if there are extreme values in the data. (v) Its main defect is that, in its calculation, every value of the data is not used. The mode (i) The mode is not unique. That is, there can be more than one mode for a given set of data. (ii) The mode can be found for both qualitative and quantitative data. (iii) It is not affected by extreme values. (iv) It is mostly used by manufacturers since it gives a better idea of what particular size of a product to manufacture in excess of the others. For instance, a shoemaker is more interested in the modal size of the shoes he manufactures than the mean or the median size.
Exercise 2(c) 1. Find the mean of the following data.
x f
0 2
1 3
2 5
3 8
4 7
5 3
2. Using a suitable assumed mean, find the mean of the following data.
x f
152 3
156 6
160 10
164 20
168 30
172 20
176 8
180 3
3. The following table gives the distribution of the lengths of 40 iron rods. Using a suitable assumed mean, find the mean length of the iron rods. Length (cm) Frequency
190 3
195 5
200 7
205 10
210 6
215 7
220 2
Descriptive Statistics
49
ELEMENTARY STATISTICAL METHODS 4. The following table gives the distribution of the marks scored by 40 students in a Physics examination. Calculate, using the assumed mean method, the mean mark. Mark (%) Frequency
20 – 29 1
30 – 39 3
40 – 49 10
50 – 59 12
60 – 69 7
70 – 79 4
80 – 89 3
5. The following table gives the distribution of the ages of 40 patients who attended a clinic on a certain day. Calculate, using the assumed mean method, the mean age of the patients. Age (years) Frequency
21 – 25 2
26 – 30 5
31 – 35 10
36 – 40 12
41 – 45 8
46 – 50 3
6. The following table gives the distribution of the lengths of a sample of leaves from a tree. Find the mean length of the leaves. Length (cm) Frequency
4–5 2
6–7 6
8–9 14
10 – 11 31
12 – 13 30
14 – 15 7
7. The following table gives the distribution of the number of eggs laid by a chicken each day in 15 days. Find the median number of eggs. Number of eggs (x) Number of days ( f )
0 1
1 2
2 4
3 5
4 3
8. The following are the marks obtained be 40 students in a quiz that contains 10 questions. Find the median mark. (Hint: see Example 2.20 on page 43). 4, 3, 5, 6, 8, 7, 3, 6, 5, 8, 4, 4, 7, 6, 6, 5, 6, 7, 4, 6, 3, 4, 6, 4, 8, 7, 8, 3, 4, 5, 5, 6, 3, 4, 8, 3, 4, 8, 6, 7. 9. The following table gives the ages of 40 patients who attended a certain clinic on a given day. Calculate the median age. Age (years) Frequency
10 –14
15 – 19
20 – 24
25 – 29
30 – 34
35 – 39
40 – 44
1
2
6
14
13
3
1
10. The following are the ages (in years) of 5 patients selected from Peace Hospital: 30, 35, 33, 29, 83. (a) Find the mean and the median ages of the patients. (b) Which of the two measures is more representative of the data? Give your reasons. 11. The following table gives the distribution of the masses of 60 eggs. (a) Calculate the median mass.
50 Descriptive Statistics
ELEMENTARY STATISTICAL METHODS (b) Estimate the median mass from a cumulative frequency curve. Mass (g) Number of eggs
41 – 46 12
47 – 49 14
50 – 52 16
53 – 55 10
56 – 61 8
12. The following table gives the distribution of the ages of 120 nurses of a certain hospital. (a) What is the upper class boundary of the modal class? (b) Estimate the modal age from a histogram. Age (years) Frequency
20 – 24 4
25 – 29 14
30 – 34 32
35 – 39 38
40 – 44 24
45 – 49 8
13. Find the mean or median, whichever you consider more suitable in the following data. Monthly salaries of five nurses: GH¢480.00, GH¢220.00, GH¢200.00, GH¢208.00, GH¢224.00. 14. With reference to the data in Question 4: (a) find the modal class, (b) estimate the modal mark from a histogram. 15. With reference to the data in Question 6: (a) find the modal class, (b) estimate the modal length of the leaves from a histogram. 16. With reference to the data in Question 11: (a) draw a histogram to represent the data, (b) find the modal class, (c) estimate the modal mass of the eggs. 17. Give examples to show when (a) the mode would be a better average than the mean, (b) the mean and the median would all be equally satisfactory, (c) the median would be a better average to use than the mean.
2.4
Quartiles and Percentiles
2.4.1. Quartiles
The median divides a set of data into two equal parts. We can also divide a set of data into more than two parts. When an ordered set of data is divided into four equal parts, the division points are called quartiles. The first or lower quartile, Q1, is a value that has one fourth, or 25% of the observations below its value. The second quartile, Q2, has one-half, or 50% of the observations below its value. The second quartile is equal to the median. The third or upper quartile, Q3, is a value that has three-fourths, or 75% of the observations below it.
Example 2.26 Find the quartiles of the following data:
11, 14, 2, 6, 5, 18, 9, 6, 11, 18, 15, 10. Descriptive Statistics
51
ELEMENTARY STATISTICAL METHODS Solution Arranging the data in ascending order of magnitude, we obtain 2, 5, 6, 6, 9, 10, 11, 11, 14, 15, 18, 18. We first find Q2 , the median of the data. The total frequency is 12, an even number. It follows that ( see [S 7 ] ).
Q 2 = median = =
1 ( the 6th 2 1 (10 + 11) 2
ordered observation + the 7 th ordered observation ) = 10.5.
Notice that Q 2 divides the data into two equal parts with six observations less than it and six observations greater than it. The first quartile, Q1, is the median of the 6 observations less than Q 2 . It follows that Q1 =
1 (6 + 2
6) = 6.
The third quartile, Q 3 , is the median of the six observations greater than Q 2. Hence,
Q3 =
1 (14 + 15) 2
= 14.5.
Example 2.27 Draw a box plot to represent the data in Exmaple 2.26. Solution Fig. 2.16 shows the required box plot.
0
2
4
Fig. 2.16:
6
8
10
12
14
16
18
20
Box plot of the data in Example 2.26
Quartiles from a grouped frequency distribution We give two methods for estimating quartiles of a grouped frequency distribution. Quartiles of a grouped frequency distribution can be estimated by linear interpolation. Assuming that the data are evenly distributed in the class interval in which Qk lies, we obtain, by linear interpolation,
⎧⎪ k N − F ⎫⎪ Qk = L + ⎨ 4 ⎬c ⎩⎪ fQk ⎭⎪
[S 9 ] where
N = ∑f
52 Descriptive Statistics
(k = 1, 2, 3)
ELEMENTARY STATISTICAL METHODS L = lower class boundary of the class interval in which Qk lies, c = size of the class interval in which Qk lies, f Qk = frequency of the class interval in which Qk lies, and
F = sum of all frequencies below L.
Example 2.28 Table 2.35 shows the distribution of the lengths of 100 iron rods. Find the lower and the upper quartiles of the distribution.
Table 2.35:
Lengths of iron rods
Length (cm) Frequency
40 – 44 45 – 49 50 – 54 55 – 59 60 – 64 65 – 69 70 – 74 6 12 22 30 15 10 5
Solution 1 4
Here, N = ∑ f = 100. The lower quartile corresponds to the ( ×100 = 25)th ordered observation. The sum of the first two frequencies is 18 while the sum of the first three frequencies is 40. Q1 therefore lies in the third class interval with class boundaries 49.5 and 54.5. Therefore (see [S 9 ] ), L = 49.5, F = 18, fQ = 22, c = 54.5 – 49.5 = 5.0 and 1
Q1 =
⎧1 N ⎪ L+ 4 ⎨ ⎪⎩
− F ⎫⎪ ⎛ 25 − 18 ⎞ ⎟ × 5 cm ⎬c = 49.5 + ⎜ f Q1 ⎪ ⎝ 22 ⎠ ⎭ = (49.5 + 1.59) cm = 51.09 cm.
The upper quartile corresponds to the
(
3 ×100 = 75 4
)
th
ordered observation. The sum of the
first four frequencies is 70 while the sum of the first five frequencies is 85. Q3 therefore lies in the fifth class interval with class boundaries 59.5 and 64.5. Hence, using [S 9 ] , we obtain L = 59.5, F = 70, fQ = 15, c = 64.5 – 59.5 = 5.0 and 3
⎧3 N −F⎫ ⎪ ⎪ ⎛ 75 − 70 ⎞ Q3 = L + ⎨ 4 ⎬c = 59.5 + ⎜ ⎟ × 5 cm = 61.17 cm. ⎝ 15 ⎠ ⎪⎩ f Q3 ⎪⎭
2.4.2 Percentiles When an ordered set of data is divided into 100 equal parts, the division points are called percentiles. More generally, the (100k)th percentile Pk, is a value such that 100k% of the observations are below this value and 100(1 – k)% of the observations are above this value.
Descriptive Statistics
53
ELEMENTARY STATISTICAL METHODS It can be seen that P0.25, the 25th percentile, has 25% of the observations below it, P0.50, the 50 percentile, has 50% of the observations below it and P0.75, the 75th percentile, has 75% of the observations below it. Thus the quartiles are the 25th, 50th, and 75th percentiles. th
Calculating the (100p)th percentile The following rule simplifies the calculation of percentiles. (1) Order the n observations from smallest to largest. (2) Determine the product np. (a) If np is not an integer, round it up to the next integer and find the corresponding ordered value. (b) If np is an integer, say k, calculate the mean of the kth and (k + 1)th ordered observations. The following example illustrates an application of the above rule.
Example 2.29 Twenty observations on the time to failure in hours of electrical insulation materials (adapted from Nelson’s Applied Life Data Analysis, 1982) are shown below (in order). Obtain the quartiles and the 84th percentile.
204 1176
228 1296
252 1392
300 1488
324 1512
444 2520
620 2856
720 3192
816 3528
912 3710
Solution The first quartile corresponds to P0.25, the 25th percentile. To find P0.25, we determine 0.25n = 0.25 × 20 = 5. This is an integer so we take the mean of the 5th and 6th ordered observations. Hence, Q1 =
1 (324 + 444) = 384. 2
The second quartile corresponds to P0.50, the 50th percentile. Since np = 20(0.50) =10 is an integer, we take the mean of the 10th and 11th ordered observations. Thus, Q2 = 12 (912 + 1 176) = 1 044. Q3 corresponds to P0.75, the 75th percentile. Since 0.75n = 0.75 × 20 the mean of the 15th and 16th ordered observations. Thus,
= 15 is an integer, we find
Q3 = 1 (1 512 + 2 520) = 2 016. 2
To find the 84th percentile, we calculate 0.84n = 0.84 × 20 = 16.8, which we round up to 17. Hence, P0.84 = 17th ordered observation = 2 856.
54 Descriptive Statistics
ELEMENTARY STATISTICAL METHODS
Exercise 2(d) 1. Find Q1, Q2 and Q3 for each of the following data. (b) 2, 6, 8, 3, 10, 5, 11, 13, 16, 19, 14 (a) 16, 20, 9, 15, 8, 21, 22 (c) 21, 6, 2, 6, 4, 10, 12, 3, 1, 2, 5, 4. 2. Draw a box plot for each set of data in Question 1. 3. The following are the number of minutes that a person had to wait for a bus to work on 15 working days: 10 1 13 9 5 9 2 10 3 8 6 17 2 10 15 (a) Find the quartiles.
(b) Draw a box plot.
4. The following are determinations of a river’s annual maximum flow in cubic metres per second:
405, 355, 419, 267, 370, 391, 612, 383, 434, 462, 288, 317, 540, 295, 508 (a) Construct a stem-and-leaf plot with two-digit leaves. (b) Use the stem-and-leaf plot to calculate the quartiles of the data. 5. The following are figures on an oil well’s daily production in barrels;
214, 204, 226, 198, 243, 225, 207, 203, 209, 200, 217, 202, 208, 212, 205, 220. (a) Construct a stem-and-leaf plot with stem labels 19, 20, …, 24. (b) Use the stem-and-leaf plot to find the quartiles of the data. 6. The following table gives the distribution of the body masses of 180 cancer patients who attend King Fahd Hospital.
Mass (kg) Frequency
50 – 54 12
55 – 59 18
60 – 64 40
65 – 69 56
70 – 74 30
75 – 79 24
Calculate the first and third quartiles of the distribution. 7. The following table gives the distances travelled by 70 workers to their offices.
Distance (km) Frequency
0–4 4
5–9 6
10 – 14 15 – 19 20 – 24 25 – 29 30 – 34 14 26 10 8 2
Calculate the first and third quartiles of the distribution. 8. In Applied Life Data Analysis (Wiley, 1982), Wayne Nelson presents the breakdown time of an insulating fluid between electrodes at 34 kV. The times, in minutes, are as follows: Descriptive Statistics
55
ELEMENTARY STATISTICAL METHODS
0.19, 0.75, 0.96, 1.31, 2.78, 3.16, 4.15, 4.67, 4.85, 6.50, 7.35, 8.10, 8.27. 12.06, 31.75. (a) Find the lower and upper quartiles of breakdown time. (b) Find the 30th and 85th percentiles of breakdown time. 9. The following are the masses of 30 eggs (to the nearest gramme).
47 72 46 68 57 62 62 58 69 50 64 52 49 67 47 71 72 57 53 53 44 62 53 53 61 68 58 (a) Construct a stem-and-leaf plot to represent the data. (b) Find the modal mass of the data. (c) Calculate the 25th, 50th and 75th percentiles of the data. (d) Calculate the 95th and 64th percentiles.
51 61 48
10. Find the 10th and 88th percentiles of the life data in Example 2.29.
2.5
Measures of dispersion
In Section 2.3, we discussed how a set of data can be summarized by a single representative value which describes the central value of the data. Consider the two sets of data in Table 2.36. Table 2.36: Data sets A and B
A B
1 −1
2 3 3 4 0 3 3 5
5 8
The mean, the mode and the median of each set of data is equal to 3. Fig. 2.17 shows the dot diagrams of the data sets A and B. It can be seen that, while values of A are grouped close to their mean, values of B are more spread out. We say that values of B are more dispersed (or scattered) than those of A.
A
B
−1
0
•
•
Fig. 2.17:
•
•
• •
•
•
1
2
3
4
5
• •
•
6
7
8
•
Dot diagrams of data sets A and B
This example shows that the mean, the mode and the median, are not enough in describing a set of data. In addition to using these measures, we need a numerical measure of dispersion (or variation) of a set of data. The most important measures of dispersion are the range, the interquartile range and the standard deviation. These measures are discussed in this section. 56 Descriptive Statistics
ELEMENTARY STATISTICAL METHODS It should be noted that: (1) If all values in a set of data are equal, then there is no dispersion. For example, the data 5, 5, 5 has no dispersion. (2) If values of a set of data are not equal, but very close to each other, then there is a small dispersion.
2.5.1 The range The range of a set of data is defined as the difference between the largest observation and the smallest observation in the set of data. Range = largest observation – smallest observation. Clearly, the larger the range, the greater the variability in the data. Thus, if the range of data set A is greater than that of data set B, then data set A is more dispersed than data set B..
Example 2.30
Consider again, the sets of data in Table 2.36. The range of data set A is (5 − 1) = 4, while the range of data set B is 8 − ( − 1) = 9. Thus the range of data set B is greater than that of data set A. This confirms that data set B is more dispersed than data set A.
Example 2.31 The marks obtained by 8 students in Mathematics and Physics examinations are as follows: Mathematics: 35, 60, 70, 40, 85, 96, 55, 65. Physics: 50, 55, 70, 65, 89, 68, 72, 80. Find the ranges of the two sets of data. Are the Physics marks more dispersed than the Mathematics marks? Solution For Mathematics, highest mark = 96, lowest mark = 35, range = 96 − 35 = 61. For Physics, highest mark = 89, lowest mark = 50, range = 89 − 50 = 39. The mathematics marks have a wider range than the Physics marks. The Mathematics marks are therefore more dispersed than the Physics marks.
Example 2.32 Examine the following sets of data: A: 3, 4, 5, 6, 8, 9, 10, 12, 15. B: 3, 8, 8, 9, 9, 9, 10, 10, 15. (a) Which of the two sets of data is more dispersed? (b) Calculate the range of each set of data. What can you say about the range as a measure of dispersion? Descriptive Statistics
57
ELEMENTARY STATISTICAL METHODS Solution (a) Fig. 2.18 shows the dot diagrams of the two sets of data. It can be seen that values of A are more scattered than those of B. There is therefore more variation or dispersion in A than in B.
A
B
•
•
•
•
3
4
5
6
•
Fig. 2.18:
7
•
•
•
•
8
9
10
11 12
• 13
14
15
• •
• • • • • • A and B in Example 2.32 Dot diagrams of data sets
(b) In both cases, the range is: largest value – smallest value = 15 − 3 = 12. Since the range indicates that the two sets of data have the same dispersion, it is not a good measure of dispersion in this case.
Remarks The range has the advantage that it is quick and easy to calculate. However, since it depends only on the maximum and the minimum values of a set of data, it does not show how the whole data is distributed between these two values. The range is therefore not a good measure of dispersion if one or both of these two values differ greatly from other values of the data. To overcome this problem, we sometimes use the interquartile range which we now discuss.
2.5.2 The interquartile range The interquartile range of a set of data is the difference between the upper and lower quartiles of the data, i.e., Q3 − Q1.
Interquartile range = Q3 − Q1 . Notice that, since 25% of a set of data is less than or equal to Q1 and 75% is less than or equal to Q3 , the central 50% of a set of data lies within the interquartile range of the data. The interquartile range of a set of data is therefore not affected by values of the data outside this range. The interquartile range is sometimes used as a measure of dispersion. Consider the two sets of data in Example 2.32. For data A, Q1 = 5, Q3 = 10, and so the interquartile range for data A is (10 − 5) = 5. For data B, Q1 = 8, Q3 = 10. Hence the interquartile range for data B is (10 − 8) = 2. Since the interquartile range of data A is greater than that of data B, these results confirm that data A is more dispersed than data B. Recall that the range gave us a misleading result. 58 Descriptive Statistics
ELEMENTARY STATISTICAL METHODS
Example 2.33
The box plots in Fig. 2.19 give the results of a study of the ages of students from two schools, A and B.
School B School A 13
14
15
16
17
18
19
20
21
22
23
24
Fig. 2.19: Box plots of ages of students in Schools A and B (a) (b)
What is the median age of students from School A? Determine whether the ages of students from School A are more variable than those of students from School B.
Solution (a) The median age of students from School A is 18 years. (b) We first calculate the interquartile range of the data from each school. Q1 = 16 years, Q3 = 21 years, School A: Interquartile range = 21 years – 16 years = 5 years. Q1 = 17 years, Q3 = 20 years, School B: Interquartile range = 20 years – 17 years = 3 years. The interquartile range of the data from School A is greater than that of the data from School B, and so the ages of students from School A are more variable than those from School A. Notice that the two sets of data have the same range but different dispersions. This example also shows that the range is a poor measure of dispersion (see Example 2.32).
2.5.3 The variance and standard deviation The most important measures of variability are the sample variance and the sample standard deviation. If x1, …, xn is a sample of n observations, then the sample variance is denoted by s² and is defined by the equation. 1 n s2 = ∑ ( xi − x ) 2 …………………………………………………………...(2.5.1) n − 1 i =1 The sample standard deviation, s, is the positive square root of the sample variance. The reason for dividing by n – 1 rather than n, as we might have expected, is that s² is based on (n – 1) degrees of freedom. The term degrees of freedom results from the fact that the n deviations x1 − x , x2 − x , …, xn − x always sum to zero, and so specifying the values of any (n – 1) of these automatically determines the remaining one. Thus, only (n – 1) of the n Descriptive Statistics
59
ELEMENTARY STATISTICAL METHODS deviations, xi − x , are freely determined. From a practical point of view, dividing the squared differences by (n – 1) rather than n is necessary in order to use the sample variance in the inference procedures discussed later. Students interested in pursuing the matter further should refer to the article by Walker (1040). If sA, the standard deviation of data set A, is greater than sB, the standard deviation of data set B, then data set A is more dispersed than data set B. It should be noted that the standard deviation of a set of data is a non-negative number. It follows that s A > s B ⇔ s A2 > s B2 .
Example 2.34 Calculate the variances and standard deviations of the sets of data, A and B, in Table 2.36. Solution The calculations can be arranged as shown in Tables 2.37 and 2.38.
Table 2.37: Data A x − x = x −3 –2 –1 0 0 1 2 0
x 1 2 3 3 4 5 18
Table 2.38: Data B (x − x)2 4 1 0 0 1 4 10
6
x A = 16 ∑ xi = 18 =3 6 i =1
6
=2. Variance, s A2 = 15 ∑ ( xi − x ) 2 = 10 5 i =1
x − x = x −3 –4 –3 0 0 2 5 0
x –1 0 3 3 5 8 18
(x − x)2 16 9 0 0 4 25 54
6
xB = 16 ∑ xi = 18 =3 6 i =1
6
= 10.8 . Variance, sB2 = 15 ∑ ( xi − x )2 = 54 5 i =1
Standard deviation, s A = 2 = 1.41 . Standard deviation, s B = 10.8 = 3.29 . It can be seen that s B > s A , confirming that data set B is more dispersed than data set A (see the dot diagrams in Fig. 2.17 on page 56). The units of measurement of the sample variance are the square of the original units of the variable. Thus, if x is measured in centimetres (cm), the unit of the sample variance is cm2. The standard deviation has the desirable property of measuring variability in the original unit of the variable of interest, x. 60 Descriptive Statistics
ELEMENTARY STATISTICAL METHODS
An alternative formula for computing the variance The computation of s² requires calculation of x , n subtractions and n squaring and adding operations. If the original observations, or the deviations xi − x are not integers, the deviations
xi − x may be difficult to work with, and several decimals may have to be carried to ensure numerical accuracy. A more efficient computational formula for s² is 2 1 ⎧⎪ n 2 1 ⎛ n ⎞ ⎫⎪ − s2 = x x ∑ ∑ ⎨ ⎬ …………………………………………………..(2.5.2) i i n − 1 ⎪i =1 n ⎜⎝ i =1 ⎟⎠ ⎪ ⎩ ⎭ The following two examples illustrate applications of Equation (2.5.2) in calculating s².
Example 2.35 Calculate the variances and the standard deviations of the sets of data, A and B, in Example 2.32, on page 57. Which of the two sets of data is more dispersed? Solution The calculation can be arranged as shown in Table 2.39.
Table 2.39: Calculations for Example 2.35 Data A
Data B
i
xi
xi2
xi
xi2
1 2 3 4 5 6 7 8 9
3 4 5 6 8 9 10 12 15 72
9 16 25 36 64 81 100 144 225 700
3 8 8 9 9 9 10 10 15 81
9 64 64 81 81 81 100 100 225 805
s 2A = 18 ⎡⎣700 − 19 (72)2 ⎤⎦ = 15.5 , s A = 3.94
sB2 = 18 ⎡⎣805 − 19 (81) 2 ⎤⎦ = 9.5 , sB = 3.08. It can be seen that sA > sB, confirming that data set A is more dispersed than data set B (see Example 2.32 on page 57). Descriptive Statistics
61
ELEMENTARY STATISTICAL METHODS
Example 2.36
The following are the haemoglobin levels (g/dl) of 10 patients selected from St. Paul Hospital. 10
∑ xi = 160 ,
i =1
10
∑ xi2 = 2 596 .
i =1
Find the mean and the standard deviation of the data. Solution 10
x = 1 ∑ xi = 1 × 160 = 16 g/dl. 10 10 i =1
⎡ 10 10 ⎞ 2 ⎤ 1 ⎛ ⎜⎜ ∑ xi ⎟⎟ ⎥ s 2 = 19 ⎢ ∑ xi2 − 10 ⎢⎣i =1 ⎝ i =1 ⎠ ⎥⎦ 1 (160) 2 ⎤ = 4 (g/dl)2 ⇒ s = 2 g/dl. = 19 ⎡ 2 596 − 10 ⎣ ⎦
The sample variance of an ungrouped frequency distribution If, in a frequency distribution, xi, …, xk occur with frequencies f1, …, fk, respectively, then Equation (2.5.2) becomes 2 k ⎞ ⎫⎪ 1 ⎧⎪ k 2 2 1⎛ s = ⎨ ∑ f i xi − ⎜⎜ ∑ f i xi ⎟⎟ ⎬ …………………………………….................(2.5.3) n − 1 ⎪i =1 n ⎝ i =1 ⎠ ⎪⎭ ⎩ k
where n = ∑ fi . i =1
Assumed mean method The amount of computation involved in using Equation (2.5.3) can be reduced by using the assumed mean method we introduced in Section 2.3. If M is any assumed mean, and if di = xi − M (i = 1, 2, ..., k ), then Equation (2.5.3) becomes 2 k ⎞ ⎫⎪ 1 ⎧⎪ k 2 1⎛ ⎟ ⎜ f d f d − ∑ i i ⎟ ⎬, ………………………………………………(2.5.4) ⎨∑ i i n − 1 ⎪i =1 n ⎜⎝ i =1 ⎠ ⎪⎭ ⎩ where n is the sum of the frequencies. The following two examples illustrate an application of Equation (2.5.4).
s2 =
Example 2.37 Table 2.40, on the next page, gives the lengths (to the nearest mm) of 100 leaves from a given plant. Using a suitable assumed mean, calculate the mean length and the standard deviation. 62 Descriptive Statistics
ELEMENTARY STATISTICAL METHODS
Table 2.40:
Lengths of 100 leaves
Length (mm) Number of leaves
57 9
58 8
59 29
60 22
61 18
62 14
Solution We take 59 (the number with the highest frequency) as the assumed mean. This gives Table 2.41.
Table 2.41:
Calculations for Example 2.37
Length (x) Frequency (.f ) 57 58 59 60 61 62
d = x − 59
−18 −8
−2 −1 0 1 2 3
9 8 29 22 18 14
0 22 36 42 ∑ fd = 100 − 26 = 74
∑ f = 100
x = 59 + 1 ∑ fd = 59 + 74 = 59.74 mm. 100 100 s2 =
1 99
{ ∑ fd
2
} { 264 −
2 1 ( − 100 ∑ fd ) =
= 2.1135 mm
2
1 99
fd 2
fd
1 (74) 2 100
36 8 0 22 72 126 2 ∑ fd = 264
}
So s = 2.1135 mm2 = 1.45 mm. The mean length of the leaves is 59.74 mm and the standard deviation is 1.45 mm.
Example 2.38 In order to choose between two measuring instruments A and B, each instrument was used to measure the diameters of 18 coins. Instrument A gave the following measurements in centimetres: 3.53, 3.54, 3.55, 3.52, 3.54, 3.51, 3.54, 3.56, 3.53, 3.54, 3.53, 3.55, 3.52, 3.53, 3.55, 3.54, 3.55, 3.53. (a) Using an assumed mean of 3.54 cm, calculate the mean and the standard deviation of these measurements. (b) Instrument B gave the same mean as A but its standard deviation was 0.0107 cm. Which of the two instruments is better? Give reasons for your answer. Solution (a) The solution is best arranged as in Table 2.42 on the next page. Descriptive Statistics
63
ELEMENTARY STATISTICAL METHODS
Table 2.42:
Calculations for Example 2.38
d = x − 3.54 –0.03 –0.02 –0.01 0 0.01 0.02
x 3.51 3.52 3.53 3.54 3.55 3.56
Frequency (f ) 1 2 5 5 4 1 ∑ f = 18
fd 2 0.0009 0.0008 0.0005 0.0000 0.0004 0.0004
fd –0.03 –0.04 –0.05 0 0.04 0.02 ∑ fd = −0.06
∑ fd 2 = 0.0030
From Table 2.42,
x = 3.54 + 1 ∑ fd = 3.54 − 0.06 = 3.537 cm. 18 18
{
2 1 1 s 2 = 17 ∑ fd − 18 ( ∑ fd )
2
} = { 0.003 − 1 17
1 (−0.06) 2 18
} = 0.000 1647 cm . 2
So s = 0.0128 cm. (b) Since the standard deviation of the measurements obtained by using instrument A is greater than that obtained by using insrument B, there will be a smaller variation in the measurements obtained by using instrument B than that obtained by using instrument A. Instrument B is better than instrument A since it will give more consistent measurements.
The sample variance and sample standard deviation of a grouped frequency distribution Equation (2.5.3) is valid for grouped frequency distributions if we interpret xi as the class mark of a class interval and fi the corresponding class frequency. In the following example, we apply Equation (2.5.3) to find the standard deviation of a grouped frequency distribution.
Example 2.39 Table 2.43 shows the ages (in years) of 50 cancer patients. Find the standard deviation of the distribution.
Table 2.43:
Ages of cancer patients
Age (years)
35 – 39
40 – 44
45 – 49
50 – 54
55 – 59
60 – 64
Frequency
1
4
12
23
7
3
64 Descriptive Statistics
ELEMENTARY STATISTICAL METHODS Solution The work can be arranged as shown in Table 2.44. We take the assumed mean M = 52.
{∑
(∑ )2 }
{
}
1 1 1 1 400 − 1 ( −50) 2 = 27.551 (years)2 s 2 = 49 fd 2 − 50 fd = 49 50 So s = 5.249 years. The standard deviation of the distribution is 5.2 years.
Table 2.44:
Calculations for Example 2.39
Age (years) Class mark (x) 35 – 39 37 40 – 44 42 45 – 49 47 50 – 54 52 55 – 59 57 60 – 64 62
d = x − 52 −15 −10 −5 0 5 10
f 1 4 12 23 7 3 ∑ f = 50
fd −15 −40 −60 0 35 30 ∑ fd = 65 − 115 = −50
fd 2 225 400 300 0 175 300 2 ∑ fd = 1 400
2.5.4 The coefficient of variation
The coefficient of variation of a set of data is defined by the equation CV = s (100)% ………………………………………………………………...(2.5.5) x
It can be seen that, since x and s are expressed in the same unit of measurement, the unit of measurement cancels out in computing the coefficient of variation. Coefficient of variation is therefore a measure which is independent of the unit of measurement. Applications (a) Coefficient of variation is used to compare the variability of sets of data measured in different units. For example, we may wish to know, for a certain population, whether body masses, measured in kilograms, are more variable than heights, measured in centimetres. (b) Coefficient of variation is also used to compare the variability of sets of data measured in the same unit, but whose means are quite different. For example, if we compare the standard deviation of heights of primary school students with the standard deviation of heights of university students, we may find that the latter standard deviation is numerically larger than the former, because the heights themselves are larger, not because the dispersion is greater.
Example 2.40
Measurements made with a micrometer of the diameter of a ball bearing have a mean of 4.52 mm and a standard deviation of 0.0142 mm, whereas measurements made with a second micrometer of the length of a screw have a mean of 1.64 inches and a standard deviation of 0.0075 inch. Which of the two micrometers gives more precise measurements? Descriptive Statistics
65
ELEMENTARY STATISTICAL METHODS Solution Since the two sets of data are measured in different units, we use coefficient of variation to compare variability. The coefficients of variation are: mm × 100% = 0.314%, ( 0.0142 4.52 mm ) in × 100% = 0.457%, CVscrew = ( 0.0075 1.64 in )
CVball =
respectively. Since CVball < CVscrew, the measurements made with the first micrometer exhibit relatively less variability than those made with the second one. The first micrometer therefore gives more precise measurements than the second micrometer.
Example 2.41 The following table gives the results of a survey to study the body masses of primary and high school students in a certain country.
Primary School High School
Mean mass (kg) 24 45
Standard deviation (kg) 8 12
We wish to know which is more variable, the body masses of the High school students or the body masses of the Primary school students. Solution Since the means of the two sets of data are very different, we use coefficient of variation to compare variability. The coefficients of variation are. CVPrimary school = CVHigh school
=
(
) ×100% = 33.3%, ( ) ×100% = 26.6%,
8 kg 24 kg
12 kg 45 kg
respectively. It can be seen that the body masses of the Primary school students have a greater relative variation than those of the High school students.
Exercise 2(e) 1. Find the range and the interquartile range of each of the following sets of data. (a) 8, 6, 11, 21, 14, 9, 3 (b) 28, 61, 26, 44, 39, 27, 45, 24, 32, 47 (c) 33, 24, 29, 27, 21, 12, 16, 23, 9, 18, 14 2. Find: (a) the range, (b) the interquartile range, of each of the sets of data in Exercise 2(d), Question 1 (see page 55). 66 Descriptive Statistics
ELEMENTARY STATISTICAL METHODS 3. Calculate the standard deviation of each of the following sets of data. (b) 1, 4, 6, 8, 9, 11 (a) 5, 7, 11, 2, 6, 3, 15 (c) 3x, 8x, 9x, 11x, 14x (d) 4, 5, 7, 9, 10, 14 4. Calculate the standard deviation of the following data.
x f
5
6
7
8
9
43
39
14
3
1
5. Calculate the standard deviation of each of the following sets of data, using a suitable assumed mean. (a)
x f
37 1
42 4
47 12
(b)
x f
152 4
157 14
162 26
(c)
x f
53 3
52 23 167 32
55 4
57 7
62 3
172 21 57 8
177 10
182 3
61 5
6. The masses, to the nearest kilogram, of 100 students were as given below. Calculate the standard deviation of the data, using a suitable assumed mean.
Mass (kg) Frequency
55 2
56 1
57 6
58 8
59 22
60 29
61 18
62 10
63 2
64 2
7. The following table gives the ages of 50 blood donors. Calculate the standard deviation of the data, using a suitable assumed mean.
Age (years) Frequency
35 – 39
40 – 44
45 – 49
50 – 54
55 – 59
60 – 64
1
4
12
23
7
3
8. The following table gives the distribution of the lengths of 40 leaves from a certain plant. Find the mean and the standard deviation, using a suitable assumed mean.
Length (mm) 10 – 14 15 – 19 20 – 24 25 – 29 30 – 34 35 – 39 Number of leaves 1 5 16 14 3 1 9. The body masses of students selected at random from two schools, P and Q, were measured. The results are given in the following table. Descriptive Statistics
67
ELEMENTARY STATISTICAL METHODS
Mean (kg) 15 kg 64 kg
School P School Q
Standard deviation (kg) 3 kg 8 kg
Determine whether the body masses of students from School P are more variable than those of students from Q. 10 (a) The following are the body masses, measured to the nearest kilogram, of 5 students from St. Andrew School: 35, 40, 45, 45, 50. Find the sample mean and the sample standard deviation. (b) The following are the body masses, measured to the nearest kg, of 10 students from St. Paul College: 10
∑ xi = 450 ,
i =1
10
∑ xi2 = 20 439.
i =1
Determine whether the body masses of this group are more variable than those of the 5 students from St. Andrew School. 11. The following table gives the results of a survey to study the haemoglobin and blood glucose levels of patients selected from King James Hospital.
Haemoglobin level (g/dl) Blood glucose level (mmol/l)
Mean
Standard Deviation
10 5
6 4
Determine whether haemoglobin levels of the patients are more variable than their blood glucose levels. 12. The following are the days seven (7) patients stayed in a hospital: 5, 5, 7, 10, 5, 20, 102. Find the mean and the median of the data. Which of the two measures is more representative of the data? Give reasons for your answer. 13. The following table gives the shoe sizes of 20 women selected from Sapele, a town in Nigeria. Find the mean and the modal shoe sizes. Which of these measures is more useful to the manufacturer of shoes? 36 38 39 37 38 36 40 39 37 38 39 38 40 39 39 40 38 42 38 38 14. The following are the blood glucose levels of six (6) patients in mg/dl: 78, 80, 540, 77, 80, 78. (a) Find the mean and the median blood glucose levels. (b) Which of the two measures is more representative of the data? Give reasons for your answer. 68 Descriptive Statistics
ELEMENTARY STATISTICAL METHODS
2.6
Shapes of distributions
Another important property of a set of data is the shape of its distribution. We can evaluate the shape of a distribution by considering two characteristics of data sets: symmetry and kurtosis. Both symmetry and kurtosis evaluate the manner in which the data are distributed around their mean.
Symmetry
(Median)
(Mean)
(a) Positively or right-skewed
m x M
(b) Symmetrical
x
m
M (Mode)
x
(Median)
m
(Mean)
M (Mode)
A symmetrical distribution can be defined as one in which the upper half is a mirror image of the lower half of the distribution. If a vertical line is drawn through the mean of a distribution depicted by a histogram, the lower half could be “folded over” and would coincide with the upper half of the distribution. One way to identify symmetry involves a comparison of the mean and the median. If these two measures are equal, we may generally consider the distribution to be symmetrical. If the mean is greater than the median, the distribution may be described as positively or rightskewed (that is, has a long tail to the right). If the mean is less than the median, the distribution is considered to be negatively or left-skewed (that is, has a long tail to the left). Fig. 2.20 illustrates the relationship between the mean, the mode and the median in these three types of distributions. In summary: mean > median ⇒ right-skewed, mean = median ⇒ symmetrical, mean < median ⇒ left-skewed.
(c) Negatively or left-skewed
Fig. 2.20: Comparison of the mean x , the median (m), and the mode (M), when a histogram is skewed to the right (a), symmetrical (b), skewed to the left (c) In a general way, skewness may be judged by looking at the sample histogram, or by comparing the mean and median. However, this comparison is imprecise and does not take the sample size into account. When more precision is needed, we use the sample coefficient of skewness given by Microsoft Excel (see Redmond, 1999). Descriptive Statistics
69
ELEMENTARY STATISTICAL METHODS
Skewness =
n ( n −1)( n − 2)
n
∑ ⎛⎜⎝
i =1
xi − x ⎞3 . s ⎟⎠
This unit-free statistic can be used to compare two samples measured in different units (say, dollars and cedis) or to compare one sample with known reference distribution such as the symmetric normal (bell-shaped) distribution. The skewness coefficient is obtained from Excel’s Tools > Data Analysis > Descriptive Statistics or by the function = SKEW(Data). Fig. 2.21 shows how the shape of a distribution affects the box-and-whisker plot of the distribution. In Fig. 2.21(a), a bell-shaped curve, we observe that, because most of the data are located near the centre of the distribution, the quartiles are located closer to the median than the extremes of the distribution. We also note that, because the curve is symmetrical, the median is equidistant from the quartiles, and the distance from the minimum value to Q1 is the same as from Q3 to the maximum value. In Fig. 2.21(b), a right-skewed distribution, we note that there is a long tail on the right side of the distribution. The distance between Q1 and the median is less than the distance between the median and Q3, while the distance between Q1 and the minimum value is less than the distance between Q3 and the largest value. In Fig. 2.21(c), a left-skewed distribution, we note that there is a long tail on the left side of the distribution. The distance between Q1 and the median is greater than the distance between the median and Q3, while the distance between the smallest value and Q1 is greater than the distance between Q3 and the largest value.
(a) Bell-Shaped Distribution
(b) Right-Skewed Distribution
(c) Left-Skewed Distribution
Fig. 2.21: Box-and-whisker plots for three hypothetical distributions
Kurtosis Kurtosis concerns the relative concentration of values in the centre of the distribution as compared to the tails. In terms of this property, we can define three types of distributions: leptokurtic, mesokurtic, and platykurtic. A leptokurtic distribution is characterized by a prominent peak. The prefix lepto means thin and refers to the taller, thinner peak of the distribution (see Fig. 2.22). A mesokurtic distribution is one in which the values are predominantly located in the centre of the distribution, with relatively few values falling in the tails. The normal distribution (see Section 4.8) is an example of a mesokurtic distribution. A 70 Descriptive Statistics
ELEMENTARY STATISTICAL METHODS platykurtic distribution is one in which the values are relatively spread out through the range of the distribution, so that the peak is relatively flat and very few values appear in the tails. The prefix platy means flat and refers to the relatively flattened peak of the distribution (see Fig. 2.22).
Platykurtic Flatter tail Kurtosis < 0
Leptokurtotic Sharper peak Kurtosis > 0
Mesokurtic Normal peak Kurtosis = 0
Fig. 2.22 A histogram is an unreliable guide to kurtosis because its scale and axis proportions may vary, so a numerical statistic is needed. Microsoft Excel uses the statistic
Kurtosis =
n( n + 1) ( n − 1)( n − 2)( n − 3)
n
∑ ⎛⎜⎝
i =1
xi − x ⎞4 3( n − 1)2 . − ⎟ s ⎠ ( n − 2)( n − 3)
This sample kurtosis coefficient is obtained from Excel’s function = KURT(Data). Kurtosis is not the same thing as dispersion, although the two are sometimes confused. For a study of measures of kurtosis, see Ramsey and Ramsey (1990).
Exercise 2(f) 1. For each of the following sets of data, find the mean, the mode and the median. State whether the data are skewed. If so, how? (a) 40, 50, 50, 60, 60, 50, 50, 70, 100, 50, 50, 40, 90, 80, 60. (b) 40, 60, 50, 60, 70, 60, 80, 80, 70, 70, 80, 70, 90, 70, 100. (c) 90, 90, 40, 50, 90, 90, 80, 80, 80, 60, 90, 100, 90, 100, 70. 2. State whether each of the following box-and-whisker plots, represents a symmetric, a rightskewed or a left-skewed distribution. (a) (b) (c)
(d)
Descriptive Statistics
71
ELEMENTARY STATISTICAL METHODS
Revision Exercises 2 1. An examination was conducted for 100 students and the results were given in the table below.
Marks scored No. of students Marks scored No. of students
50 – 54 5 75 – 79 9
55 – 59 15 80 – 84 5
60 – 64 20 85 – 89 3
65 – 69 28 90 – 94 2
70 – 74 12 95 – 99 1
(a) Draw a histogram to represent the data. (b) From your histogram, estimate, correct to one decimal place, the modal score. (c) Using an assumed mean of 67, calculate, correct to one decimal place, (i) the mean, (ii) the standard deviation. 2. (a) The following are haemoglobin level (g/dl) of 5 children who are receiving treatment from St. Thomas Hospital: 8, 11, 14, 12, 10. Find the mean and the standard deviation of the data. (b) The following are the haemoglobin levels (g/dl) of a sample of 10 healthy children: 10
10
i =1
i =1
∑ xi = 160 ,
2 ∑ xi = 2 596.
Determine whether haemoglobin levels of this group are more variable than those of the children who are receiving treatment from St. Thomas Hospital. 3. The following table shows the distribution of the marks scored by 100 students in a mathematics examination.
Marks scored Number of students Marks scored Number of students
Under 20 5 50 – 59 16
20 – 29 13 60 – 69 8
30 – 39 30 70 – 79 5
40 – 49 22 80 – 89 1
Draw a suitable diagram and use it to find (a) the median, (b) the upper quartile, (c) the pass mark if 60% of the students pass the examination. 4. The table below shows the distribution of the marks of 60 students in a test.
Marks Frequency
0–9 2
10 – 19 5
20 – 29 20
30 – 39 23
40 – 49 7
50 – 59 3
Calculate, correct to two decimal places, (a) the mean and (b) the standard deviation. 72 Descriptive Statistics
ELEMENTARY STATISTICAL METHODS 5. Forty small-scale industries in a certain country are classified according to their size (i.e. the number of people employed). The table below shows the classification.
Number of employees Number of industries
1– 20
21– 40
3
8
41– 60
61– 80
13
81 – 100
101 – 120
5
1
10
(a) State (i) the modal class of the distribution, (ii) the median class of the distribution. (b) Draw a cumulative frequency curve and use it to estimate: (i) the median of the distribution, (ii) the number of industries with more than 45 but less than 85 employees. 6. The data below are the masses (in kg) at birth of 32 babies born at a maternity home in a week. 3.2 3.0 3.8 4.2 2.8 3.3 3.3 2.7 3.6 2.8 3.5 4.6 4.3 3.7 4.4 3.1 3.9 2.5 3.7 4.3 3.7 4.0 2.8 3.6 3.1 3.0 3.4 2.8 3.7 3.3 3.0 3.2 (a) Construct a frequency table using the class intervals 2.25 – 2.75, 2.75 – 3.25, 3.25 – 3.75, 3.75 – 4.25 and 4.25 – 4.75. (b) Draw a histogram to illustrate the data, and use it to estimate: (i) the median of the distribution, (ii) the mode of the distribution. (c) Calculate the mean of the distribution. 7. The table below gives the distribution of marks obtained by 500 candidates in an examination.
Mark Frequency Mark Frequency
1 – 10 5 51 – 60 120
11 – 20 15 61 – 70 50
21 – 30 40 71 – 80 10
31 – 40 105 81 – 90 5
41 – 50 150 91 – 100 0
Draw a cumulative frequency curve for the distribution (a) Use your graph to estimate: (i) the median mark, (ii) the interquartile range. (b) If only 5 % of the candidates attained the distinction level, estimate the lowest mark for this level. 8. The table below gives the distribution of the marks of 200 pupils in a certain test.
Mark 11 – 20 Frequency 18
21 – 30 36
31 – 40 34
41 – 50 44
51 – 60 42
61 – 70 16
71 – 80 10
Descriptive Statistics
73
ELEMENTARY STATISTICAL METHODS Using an assumed mean of 45.5 marks, calculate, correct to two decimal places (a) the mean mark , (b) the standard deviation of the distribution. 9. The table below shows the distribution of marks.(x) obtained in a Chemistry examination.
Mark (x) Number of candidates Mark (x) Number of candidates
45 – 49
50 – 54
55 – 59
60 – 64
65 – 69
0
2
21
36
56
70 – 74
75 – 79
80 – 84
85 – 89
70
42
31
28
(a) Draw: (i) a histogram, (ii) a cumulative frequency curve for the distribution. (b) Use your diagrams for the distribution to estimate: (i) the mode, (ii) the median. 10. The marks obtained in a test by 40 pupils are as follows: 78 60 76 66 33 81 67 84 72 60 54 42 27 33 24 66 27 63 18 30 39 44 30 30 33 45 39 33 30 45 27 36 42 18 42 36 60 72 72 63 (a) Construct a frequency table, using class intervals 10–19, 20–29, 30–39, etc. (b) Draw a histogram for the data. (c) (i) Use your histogram to estimate the mode. (ii) Calculate the mean of the distribution.
References Du Toit, S. H. C., Steyn, A. G. W. and Stumpf, R. H. (1986). Graphical Exploratory Data Analysis. Springer-Verlag, New York. Nelson, W. (1982). Applied Life Data Analysis. John Wiley & Sons, New York. Ramsey, P. P. and Ramsey, P. H. (1990). Simple tests of normality in small samples. Journal of Quality Technology, 22, 299 – 309. Redmond, W. A. (1999). Microsoft Excel 2000, Microsoft Press. Sturges, H. A. (1926). The choice of a class interval. Journal of the American Statistical Association, 21, 65 – 66. Turkey, J. W. (1977). Exploratory Data Analysis, Addison-Wesley, Reading, Mass. Walker, H. W. (1040). Degrees of freedom. Journal of Educational Psychology, 31, 253 – 269. 74 Descriptive Statistics


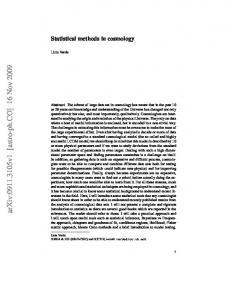

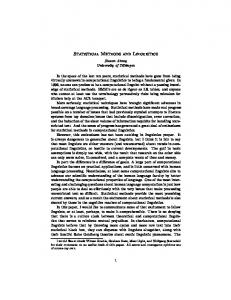


![[DOWNLOAD] Elementary Statistical Physics Popular - Google Sites](https://m.moam.info/img/260x300/download-elementary-statistical-physics-popular-go_6477c631097c4796708c132a.jpg)
![[EPUB] Elementary Statistical Physics Free - Google Sites](https://m.moam.info/img/260x300/epub-elementary-statistical-physics-free-google-si_6477c635097c4737708c12db.jpg)


