IEEE TRANSACTIONS ON KNOWLEDGE AND DATA ENGINEERING,
VOL. 20,
NO. 2,
FEBRUARY 2008
145
Eliciting Consumer Preferences Using Robust Adaptive Choice Questionnaires Jacob Abernethy, Theodoros Evgeniou, Olivier Toubia, and Jean-Philippe Vert Abstract—We propose a framework for designing adaptive choice-based conjoint questionnaires that are robust to response error. It is developed based on a combination of experimental design and statistical learning theory principles. We implement and test a specific case of this framework using Regularization Networks. We also formalize within this framework the polyhedral methods recently proposed in marketing. We use simulations, as well as an online market research experiment with 500 participants, to compare the proposed method to benchmark methods. Both experiments show that the proposed adaptive questionnaires outperform the existing ones in most cases. This work also indicates the potential of using machine-learning methods in marketing. Index Terms—Marketing, machine learning, statistical, interactive systems, personalization, knowledge acquisition.
Ç 1
INTRODUCTION
A
central problem in marketing is the understanding of consumers’ preferences. Various methods have been developed for this purpose with conjoint analysis [9], [8], [18], [19], [47] being among the most widely used ones. The approach is based on asking respondents questions about their preferences among products (for example, “do you prefer product A or product B?”) and estimating their preferences for the features (attributes) of the products based on their responses. A key issue in conjoint analysis is the design of the questionnaires. The traditional approach has been to use nonadaptive questionnaires: The questions are determined in advance and are not influenced by the respondents’ answers. With the advent of online marketing research, researchers and practitioners have become increasingly interested in adaptive questionnaires [21]: Each question for every individual is designed in real time based on his or her responses to earlier questions. Despite their attractiveness, adaptive questionnaires can be subject to endogeneity (as will be illustrated in Section 3.5): Questions are influenced by the response errors to earlier answers [22]. As a result, although recently proposed adaptive methods tend to outperform nonadaptive benchmarks when response error is low, they typically do not perform as well when response error is high [43], [44] (as is often the case in online environments). This suggests the need for questionnaires
. J. Abernethy is with the Department of Computer Science, University of California at Berkeley, 387 Soda Hall, Berkeley, CA 94720. E-mail:
[email protected]. . T. Evgeniou is with INSEAD, Bd de Constance, 77300 Fontainebleau, France. E-mail:
[email protected]. . O. Toubia is with the Marketing Division, Columbia Business School, 3022 Broadway, Room 522, New York, NY 10027. E-mail:
[email protected]. . J.-P. Vert is with Ecole des Mines de Paris, 35 rue Saint-Honore´, Fontainebleau 77300, France. E-mail:
[email protected]. Manuscript received 30 Jan. 2006; revised 22 Aug. 2006; accepted 5 Feb. 2007; published online 21 Feb. 2007. For information on obtaining reprints of this article, please send e-mail to:
[email protected], and reference IEEECS Log Number TKDESI-0044-0106. Digital Object Identifier no. 10.1109/TKDE.2007.1031. 1041-4347/08/$25.00 ! 2008 IEEE
that retain the benefits of adaptive interviews while being robust to response error. In this paper, we propose a framework for constructing such questionnaires. It combines some fundamental principles used in experimental design [10], [17], [25], [32], [40] and in the recent marketing work by Toubia et al. [43], [44], with statistical learning theory [45]. Robustness to response errors is achieved by using complexity control, widely used in machine learning such as in Support Vector Machines (SVM) and Regularization Networks (RN) [41], [45]. We develop and test a specific case within the proposed framework using RN. We also show how the recently proposed polyhedral estimation (Poly est) method by Toubia et al. [44] may be viewed as a special case of our framework, albeit with an arbitrarily small weight on complexity control leading to greater sensitivity to response error. We use simulations as well as a field experiment to compare our method to the polyhedral method (Poly-Q) by Toubia et al. [44] and to the widely used nonadaptive questionnaire design methods. Both experiments show that the proposed approach performs best in most cases. The paper is organized as follows: We start in Section 2 with a brief overview of previous related work. We present the proposed framework in Section 3, where we also discuss the relation with previous methods. We then compare the performance of the proposed method to benchmark questionnaires using simulations (Section 4) and an online experiment (Section 5) and conclude in Section 6.
2
PROBLEM DEFINITION
AND
RELATED WORK
2.1 Notations and Definitions As we use terminology that is standard in marketing but not in machine learning, to facilitate exposition, we summarize in Table 1 the definitions of some terms. The underlying model in conjoint analysis is that the utility that a consumer derives from a product (also called a profile) is a function of the attributes of this product (for example, size, weight, battery life, and so forth). Each attribute may take different levels, which can be continuous (for example, size Published by the IEEE Computer Society
Authorized licensed use limited to: ECOLE DES MINES PARIS. Downloaded on October 30, 2009 at 13:01 from IEEE Xplore. Restrictions apply.
146
IEEE TRANSACTIONS ON KNOWLEDGE AND DATA ENGINEERING,
TABLE 1 Terms Used throughout the Paper
VOL. 20, NO. 2,
FEBRUARY 2008
zi ¼ xi1 % xi2 . Alternative formats of conjoint questions include rating [47] or ranking [39] sets of profiles and numerically comparing sets of pairs of profiles [36], [37], [43]. The accuracy of the estimated ws is driven by two critical aspects: 1) the method used to construct the questionnaires and 2) the method used to estimate the respondents’ partworths based on their responses to the questionnaires. In this paper, we focus on the first aspect.
2.2
Previous Work on Choice-Based Conjoint (CBC) Questionnaire Design
2.2.1 Nonadaptive CBC Designs The literature on nonadaptive CBC questionnaire design builds primarily on the field of experimental design [10], [17], [25], [32], [40]. The approach can be summarized as minimizing a norm of the asymptotic covariance matrix of ^ If one makes the standard the parameter estimates w. response error assumption that the probability that a consumer with partworth vector w will choose profile xi1 exi1 $w over xi2 is Pi1 ¼ exi1 $w þexi2 $w , then, in [28], McFadden showed that the maximum likelihood estimate of w is asymptotically normal with mean equal to its true value and covariance matrix equal to the inverse of the information matrix ! given by ! n X 2 X > ð1Þ Pij qij qij ; !¼ i¼1 j¼1
in inches) or discrete (for example, “small” or “large”). We represent a product (profile) by a row vector x that has one entry per continuous attribute and k binary entries for each discrete attribute with k levels (the number of levels may vary across attributes), where all k entries are 0 except for the one corresponding to the level present in the profile (such representation is called “binary coding” [26]). Our method is developed for continuous attributes, and we use an existing transformation to adapt it to discrete attributes. The utility derived by a consumer from a product x may be written as a function UðxÞ. A typical assumption is that the function U is additive [5], [39] and linear: UðxÞ ¼ x $ w. Our approach may be generalized to nonlinear functions using kernels [45]. The vector w is called the partworths vector. In order to estimate the partworths vectors ws of a set of consumers, a series of questions is asked to each consumer. Different formats of questions have been developed. We focus on the popular format of “Choice-Based Conjoint (CBC) Analysis” [4], [7], [23], [24], [44], in which each question asked to each consumer consists of choosing one profile out of a set (that is, indicating which one has the highest utility). See Fig. 2 for an example. For simplicity, we first consider binary choices: Question i consists of choosing among two profiles fxi1 ; xi2 g. Without loss of generality, we assume that the first profile xi1 is always selected. We describe the extension to larger choice sets in Section 3 and use four choices per question in our experiments. The set of questions asked to a respondent is called a design and is represented by a matrix called the design matrix Z with rows
where n isP the total number of choice questions, and qij ¼ xij % 2k¼1 xik Pik . ! is also the Hessian of the loss function corresponding to maximum likelihood estimation [30], formulated as (recall that we assume without loss of generality that xi1 is always selected) ^ ¼ argminw w
n X i¼1
% logðPi1 Þ:
ð2Þ
An efficient nonadaptive CBC design is defined as one that minimizes a norm of the asymptotic covariance matrix !%1 . Different norms lead to different definitions of efficiency. The most widely used norm is the determinant, giving rise to so-called D-efficient designs [4], [23], [25], [26]. D-efficiency minimizes the volume of the confidence ^ [20] ellipsoid around the maximum likelihood estimate w ^ ' 1g. ^ > !ðw % wÞ defined by fw : ðw % wÞ Note that the covariance matrix !%1 is a function of the true (unknown) w through the probabilities Pij . Until recently, researchers systematically made the simplifying assumption that w ¼ 0 (and, hence, that all Pij s are equal), leading to a set of approximate efficiency measures, including D0 -efficiency which approximates D-efficiency. D0 -efficiency is maximized by orthogonal and balanced designs [1], extensively studied and used in practice. These designs are such that the confidence ellipsoid around the estimated w—calculated under the assumption that w ¼ 0 —is spherical (that is, the covariance matrix is proportional to the identity matrix). Such designs are available only for specific combinations of the numbers of questions, profiles per question, attributes, and levels per attribute. Bunch et al. [7] (see also [23]) provide a method for constructing such designs when they exist. Algorithms have been developed
Authorized licensed use limited to: ECOLE DES MINES PARIS. Downloaded on October 30, 2009 at 13:01 from IEEE Xplore. Restrictions apply.
ABERNETHY ET AL.: ELICITING CONSUMER PREFERENCES USING ROBUST ADAPTIVE CHOICE QUESTIONNAIRES
to (approximately) maximize D0 -efficiency when orthogonal and balanced designs do not exist [12], [25], [26], [29]. Conjoint methods that relax the assumption that w ¼ 0 have been recently proposed. In particular, [4], [23], [24], and [35] consider a nonzero prior on w, obtained in practice from a set of pretest respondents (in which case, the designs are adapted between respondents) or from the managers’ beliefs. This prior may be captured by a point estimate or a probability density function over a set of vectors. Maximizing D-efficiency over the prior on w leads to so-called aggregate customization designs. The main characteristic of aggregate customization designs is utility balance: The profiles in each choice set are close in utility—utility being calculated according to the prior on w—making the choices “a priori” hard (that is, the probabilities Pij s are closer to one another). Intuitively, utility balance increases the information provided by each question. Utility balance has been shown to increase efficiency empirically [4], [23], [24], [35] and theoretically [22].
2.2.2 Previous Work on Adaptive CBC Designs The only published method for adaptively designing CBC questionnaires is Poly-Q in [44]. Note that adaptive conjoint analysis has been made possible only recently, with the development of online marketing research. The main idea behind Poly-Q is that the answer to each choice question may be interpreted as a set of inequality constraints on w (the constraints reflect the fact that the selected profile has the highest utility in the set). The set of ws that satisfy all the constraints implied by the first n choice questions is a polyhedron defined by "n ¼ fw ( 0; 1 $ w ¼ 100; 8i ¼ 1 $ $ $ n; zi $ w ( 0g;
ð3Þ
where 1 is a vector of 1s, 1 $ w ¼ 100 is a scaling constraint, and zi ¼ xi1 % xi2 . If "n is nonempty, then w is estimated by ^ n .1 We describe the general the analytic center [38] of "n , w case (in which "n may be empty) in Section 3.5. The question selection method proposed by Toubia et al. [44] is such that this polyhedron never becomes empty. Choosing the ðn þ 1Þth question is equivalent to choosing the next constraint znþ1 that will define the new polyhedron "nþ1 . The polyhedron "nþ1 may be conceptually compared to the confidence ellipsoid around the estimates used in maximum likelihood estimation (2) (see above). Just like D0 -efficient designs minimize the confidence ellipsoid around the maximum likelihood estimate and make it spherical, Poly-Q attempts to minimize the volume of "nþ1 and make it as spherical as possible. Moreover, to achieve this, Poly-Q also uses utility balance just like aggregate customization designs. In particular, Toubia et al. [44] choose the ðn þ 1Þth question according to the following criteria: 1.
Minimize maximum uncertainty. The new constraint znþ1 should be perpendicular to the longest axis of the current polyhedron "n . This will tend to make
1. For a polyhedron written in standard Pform as " ¼ fw ( 0; Aw ¼ bg, the analytic center is defined as argminw pi¼1 % lnðwi Þ subject to Aw ¼ b, where p is the number of positivity constraints—dimensionality of w in this case.
147
the next polyhedron "nþ1 as spherical as possible (see [44, pp. 119-120], for details). The longest axis of "n can be interpreted as the direction of greatest uncertainty regarding the location of w. It is computed using the eigenvector with the smallest positive eigenvalue of a matrix describing the polyhedron [44]. 2. Utility balance. The new constraint znþ1 should go through the analytic center (w ^ n ) of the current ^ n ¼ 0. Toubia et al. polyhedron "n , that is, znþ1 $ w [44, p. 119] argue that this minimizes the expected volume of the polyhedron "nþ1 . These two criteria, motivated by the theory of nonadaptive experimental design discussed above, will also be used in our framework, which we describe next.
3
ADAPTIVE DESIGN QUESTIONNAIRES
OF
ROBUST CHOICE
3.1 Presentation of the Method Our framework is motivated by the combination of the two experimental design criteria summarized above on one hand and statistical learning principles (which we now briefly review) on the other. A standard approach to conjoint estimation is to maximize some measure of fit. However, this may lead to overfitting, and the estimates may be sensitive to response errors, especially if they are based on limited data (for example, few choices per respondent). Statistical learning theory [45], introduced to marketing in [16] and [14], has addressed this issue by introducing the fundamental notion that the estimates should reflect a trade-off between maximizing fit and minimizing the complexity of the estimated model. In particular, after n questions, we estimate w as the minimizer of a loss function of the following general form: minw Ln ðwÞ ¼
n X i¼1
V ðw; fzi gÞ þ !JðwÞ;
ð4Þ
where V ðw; fzi gÞ (with zi ¼ xi1 % xi2 ) measures the fit, and J controls (penalizes) the complexity of the partworths. The parameter !, called the regularization parameter, reflects the trade-off between fit and complexity (we set it to n1 —see below). This parameter may also be chosen using cross validation or a validation set [45]. Different specifications of V and J lead to different machine-learning methods. Our approach can be applied to any loss function (4) that is convex and twice differentiable with respect to w. We will adopt a specific formulation known as RN [41], [45], [15], which leads to closed form solutions that are fast to compute—see below. We note that a special case of (4) that is widely used in machine learning is SVM [13], [45]. Our framework does not apply to SVM because that loss function is not twice differentiable, which is a requirement as shown below. Let us now combine the loss function (4) with the two design criteria outlined at the end of Section 2. Let us assume that n ( 1 questions have been asked thus far2 2. Clearly, for n ¼ 0, we have no data, hence, we cannot use our (or any adaptive) method. As in previous work (for example, [44]), we design the first question randomly.
Authorized licensed use limited to: ECOLE DES MINES PARIS. Downloaded on October 30, 2009 at 13:01 from IEEE Xplore. Restrictions apply.
148
IEEE TRANSACTIONS ON KNOWLEDGE AND DATA ENGINEERING,
and that the loss function Ln is minimized by our ^ n . Notice that the loss function only depends estimate w on the zi ¼ ðxi1 % xi2 Þs. Therefore, for products with realvalued attributes, we only need to determine znþ1 in order to generate the next question (and choose any two profiles such that znþ1 ¼ ðxnþ1;1 % xnþ1;2 Þ). In creating the next question, we adapt the two criteria outlined at the end of Section 2 as follows: .
Minimize maximum uncertainty. We choose a direction for znþ1 along which the current loss function Ln ðwÞ is as flat as possible. The flatness of the loss function is by definition given by its second derivate matrix, the Hessian, and it may be interpreted as a measure of uncertainty in the partworth estimates. For example, in the case of maximum likelihood estimation (see Section 2), the Hessian of the loss function (2) is asymptotically equal to the inverse of the covariance matrix of the estimates [30]. The flattest direction can also be seen as a generalization of the longest axis of the polyhedron in the Poly-Q method in [44]. . Utility balance. We create a question involving a set of products that are “a priori” equally attractive. In the case of binary choices, this ^ n ¼ xnþ1;2 $ w ^ n , or znþ1 $ w ^ n ¼ 0. implies xnþ1;1 $ w Let us now formalize these two criteria. The estimated ^ n that satisfies rLn ðwÞ ¼ 0, utility vector is the only point w where r is the gradient operator. The loss function Ln being strictly convex and twice differentiable, its “flatness” (or convexity) around that minimum is given by its second @ 2 Ln derivative matrix (Hessian) ½r2 Ln *i;j :¼ @w . More prei @wj cisely, the convexity along a direction z is given by zr2 Ln z> . In order to find the direction of the smallest convexity ^ n (second criterion), we (first criterion) orthogonal to w therefore solve the following optimization problem: minz
^ n Þz> zr2 Ln ðw
^ n ¼ 0; zz> ¼ 1; Subject to zw
ð5Þ
where zz> ¼ 1 is a scaling constraint. After projecting the
^ n by the Hessian matrix onto orthogonal to w ! the hyperplane " ^ w ^> w
^ n Þ, where p is the diequation Bn :¼ Ip % w^ >n w^ nn r2 Ln ðw n
mensionality of w and Ip is the p + p identity matrix, this
^nþ1 as the eigenvector of Bn problem reduces to choosing z
^nþ1 with the smallest positive eigenvalue. Note that both z and %^ znþ1 minimize the loss function, that is, switching the
^ nþ1;2 is not consequential. ^ nþ1;1 , and x labels of the profiles x Thus stated, this strategy is very general and can be applied to any estimation procedure of the form (4) as long as V and J are such that the loss function is convex and twice differentiable. We adopt a specific formulation based on RN. RN estimation (RN est) solves the following minimization problem: minw Rn ðwÞ ¼
n X i¼1
ð1 % ðxi1 % xi2 Þ $ wÞ2 þ !kwk2 ;
ð6Þ
VOL. 20, NO. 2,
FEBRUARY 2008
where the constant of 1 in the square error plays a scaling ^ n after n questions is [45] role for w # w. The $estimate %1 ^ n ¼ Zn> Zn þ !Ip Zn> 1n , where 1n is a vector of 1s and w Zn is the design matrix after n questions (the ith row of Zn is ðxi1 % xi2 Þ). The next question is designed using the eigenvector with the smallest positive eigenvalue of % & $ ^ nw ^> # w Ip % > n Zn> Zn þ !Ip : ð7Þ ^nw ^n w Indeed, simple linear algebra shows that Rn (6) and its derivatives can be written in matrix form as follows: # $ rRn ðwÞ ¼ 2 Zn> Zn þ !Ip w % 2Zn> 1n and # $ r2 Rn ðwÞ ¼ 2 Zn> Zn þ !Ip :
These lead to the expressions above. In summary, for the RN loss function (6), the proposed conjoint analysis method consists of the following two steps at each iteration (question) the estimate # n: Step 1: Compute $%1 ^ n ¼ Zn> Zn þ !Ip Zn> 1n . Step 2: The of the partworths w next question (difference vector znþ1 ) is defined by the eigenvector associated with the smallest positive eigenvalue of the matrix given by (7). Note that all of the expressions are in closed form and only require the inversion of a matrix of size equal to the number of partworths (dimensionality of w). Hence, this method is very fast computationally and can be used, for example, for real-time online market research. We label it RN-Q.
3.2 Practical Issues 3.2.1 Choosing the Parameter ! in (4) As discussed above (see also [45]), the “trade-off” parameter ! in (4) is often chosen in practice using a small validation set or using cross validation. Although this is a feasible ex post when estimating the partworths, this is not a feasible ex ante when designing questions. In this paper, we set ! to n1 , where n is the number of questions. This formulation addresses the concern that ! should decrease as the amount of data increases [45]. Future work on how to better (possibly adaptively, using data across respondents) set parameter ! may further improve the performance of our method. 3.2.2 Designing Questions with More than Two Profiles When more than two profiles per question are needed, we do as in Poly-Q [44]: We consider not only the smallest positive eigenvalue of the Hessian (7) but also the second smallest, third, and so forth and the corresponding eigenvectors. For example, to construct a choice set with four profiles as in the experiments, we use two difference vectors znþ1;1 and znþ1;2 corresponding to the smallest and second smallest positive eigenvalues of the Hessian matrix (7). 3.2.3 Designing Profiles with Discrete Attributes The approach outlined above generates a continuous difference vector znþ1 . In many cases, attribute levels are discrete, and it is not possible to find two profiles such that znþ1 ¼ ðxnþ1;1 % xnþ1;2 Þ. As this is not the focus of this paper, we address this issue by simply replicating the approach in [44]. Such replication also makes the empirical
Authorized licensed use limited to: ECOLE DES MINES PARIS. Downloaded on October 30, 2009 at 13:01 from IEEE Xplore. Restrictions apply.
ABERNETHY ET AL.: ELICITING CONSUMER PREFERENCES USING ROBUST ADAPTIVE CHOICE QUESTIONNAIRES
comparisons with Poly-Q below fair. Other discrete transformations may be used, but this is beyond the scope of this paper. The idea behind the method used in [44] is to construct two binary profiles xnþ1;1 and xnþ1;2 such that ðxnþ1;1 % xnþ1;2 Þ is as close as possible to being proportional to znþ1 ^ n , 0). while preserving utility balance (ðxnþ1;1 % xnþ1;2 Þ $ w This is done in two steps: First, two vectors cnþ1;1 and cnþ1;2 are constructed such that cnþ1;1 % cnþ1;2 is proportional to znþ1 . Second, two binary profile vectors xnþ1;1 and xnþ1;2 are created to be as close as possible to cnþ1;1 and cnþ1;2 while ^ n , 0. satisfying ðxnþ1;1 % xnþ1;2 Þ $ w For the first step [44], select cnþ1;1 and cnþ1;2 to be maximally different while being within the feasible polyhedron "n of (3). Ensuring that the points stay within the polyhedron is important in [44] because it implies that the polyhedron "n never becomes empty. Although this is irrelevant to our framework, in order not to confound the ^ n þ "znþ1 comparisons, we follow [44] and use cnþ1;1 ¼ w ^ n % #znþ1 , where " and # are chosen as and cnþ1;2 ¼ w ^ n þ "znþ1 ( 0; zi $ ðw ^ n þ "znþ1 Þ ( 0; 8i ' ng " ¼ maxf" : w (similarly for #), where the zi s are the profile differences from the previous n questions. We exclude data points that are misclassified by our estimate, that is, for which ^ n < 0. zi $ w The second step is achieved by solving two knapsack problems (for i ¼ 1; 2): maximize xnþ1;i $ cnþ1;i subject to ^ n ' M, where M is a random budget constraint, xnþ1;i $ w and xnþ1;i is constrained to be a binary vector of the appropriate format. Intuitively, xnþ1;1 and xnþ1;2 are the binary vectors closest to cnþ1;1 and cnþ1;2 such that ^ n , M , xnþ1;2 $ w ^ n . If more than two profiles per xnþ1;1 $ w question are needed, we obtain one pair of points cnþ1;i per eigenvector and, similarly, associate one profile xnþ1;i with ^ n and M in all the Knapsack each point, using the same w problems. In our experiments, in which the number of profiles per question was four, if all the resulting xnþ1;i s were not distinct, we drew another M and repeated the procedure up to 10 times (for computational efficiency reasons). If the profiles were still not distinct after these 10 draws of M, we simply used the nondistinct set of xnþ1;i s as our question set. This is the procedure used in [44].
3.3
Relation with Nonadaptive Experimental Designs As reviewed in Section 2, the large literature on experimental designs typically attempts to construct designs that minimize a norm of the asymptotic covariance matrix of the estimates (!%1 in (1)), which is equal to the inverse of the Hessian of the loss function (2) minimized by maximum likelihood estimation. Let us consider our first design criterion, “minimize maximum uncertainty.” It is implemented by selecting the direction of the next question znþ1 as the eigenvector associated with the smallest eigenvalue of the Hessian of the loss function (6). We can show that this maximally decreases with each question the largest eigenvalue of the inverse of this matrix. The largest eigenvalue of a matrix being a norm on the set of positive semidefinite matrices, our first criterion may also be interpreted as
149
(greedily) leading toward the minimization of a norm of the inverse of the Hessian of the loss function. Indeed, the Hessian r2 Rnþ1 of (6) after the ðn þ 1Þth question is simply r2 Rnþ1 ¼ r2 Rn þ z> nþ1 znþ1 . If znþ1 is the eigenvector with the smallest positive eigenvalue of r2 Rn , then any eigenvector of r2 Rn is also an eigenvector of r2 Rnþ1 with the same eigenvalue, except znþ1 . The latter is also an eigenvector of r2 Rnþ1 but with eigenvalue equal to !n þ kznþ1 k2 ¼ !n þ 1, where !n is the eigenvalue of r2 Rn corresponding to znþ1 . Hence, the smallest eigenvalue of r2 Rn (equal to the inverse of the largest eigenvalue of the inverse of the Hessian) is maximally increased by 1. When combining the first design criterion with the second criterion of utility balance, our method is equivalent to ^ n as one of performing a change of (orthogonal) basis with w the new axes and applying the first criterion to the projection of the Hessian on the other axes. Note that another interpretation of utility balance is that we restrict the first criterion only to uncertainty regarding the direction of w (that is, the relative importance of the product ^n attributes), not its norm. Reducing uncertainty along w would only change the norm of our estimate, not its direction. Let us now stress two key differences between our method and nonadaptive methods. First, the nonadaptive methods minimize the norm of the asymptotic covariance matrix exante, whereas we decrease a comparable matrix adaptively based on the additional information provided by the respondent’s previous choices. Second, more importantly, we use complexity control. Because maximum likelihood estimation does not control for complexity, the adaptive approach used in this paper does not appear promising for maximum likelihood estimation. The lack of complexity control would result in designs that are sensitive to response errors like those obtained from Poly-Q as we show below.
3.4 Relation with Active Learning The problem of designing conjoint questionnaires is comparable to that of active learning [42], [11], [46], [34]. However, in active learning, the problem is typically3 stated as follows: Given a (usually small) set of (so-called) unlabeled data (for example, candidate questions to ask), select one for which to ask the label/output (for example, the dependent variable y in a regression problem). In our case, we are not given any set of unlabeled data, but, instead, we design the next data point/question. The method we develop here is motivated by principles from the experimental design literature. Interestingly, these principles have been used in active learning as well: For example, utility balance has been used in [42], where the data point/question selected at every step is the one for which there is maximal uncertainty regarding the response. There are also active learning methods that attempt to minimize the variance of the estimates, where various measures of variance can be used [11], [34]. However, we do not know of any active learning method that uses the 3. This is a matter of definition. In the most general definition, active learning can include our problem as a special case [11], but that is not the typical definition.
Authorized licensed use limited to: ECOLE DES MINES PARIS. Downloaded on October 30, 2009 at 13:01 from IEEE Xplore. Restrictions apply.
150
IEEE TRANSACTIONS ON KNOWLEDGE AND DATA ENGINEERING,
Hessian of the regularized loss function (4)—which includes the complexity control kwk2 —while achieving utility balance. Our approach may be adopted to develop a novel active learning method, but we do not develop this avenue further and, instead, focus on the marketing problem at hand. We also note that an implicit goal of this work is to explore possible links between machine learning and marketing. Future work may explore this interaction further.
3.5 Relation with Polyhedral Adaptive CBC Methods Our method and that in [44] use the same criteria: 1) minimize the maximum uncertainty on the partworths estimates and 2) utility balance. Formally, in both cases, the optimal direction is defined by the smallest positive eigenvector of a matrix describing the space of partworth solutions. However, there is a key difference: Although we use a regularized loss function (4), the method in [44] does not consider a proper trade-off between fit and complexity as we now show. In its general form, Poly est consists of finding the analytic center of the polyhedron: "n ¼ fw ( 0; 1 $ w ¼ 100; 8i ¼ 1 $ $ $ n; zi $ w ( %$- g; where 1 is a vector of 1s, 1 $ w ¼ 100 is a scaling constraint, zi ¼ xi1 % xi2 (we again assume binary choices for ease of notation), and $- is an estimate of noise obtained by solving minw;$ $ Subject to zi $ w ( %$ for all i; 1 $ w ¼ 100; w ( 0; $ ( 0: We formalize this two-stage estimation method within the statistical learning theory framework by writing it as the limit case when ! ! 0 of Xn Xp 1 $% lnðzi $ w þ $Þ % lnðwi Þ i¼1 i¼1 ! Subject to 1p $ w ¼ 100; $ ( 0: minw;$
ð8Þ
Hence, the Poly est method can be seen as a special case of the general regularized estimation method (4), where fit is measured by $ and complexity by %
n X i¼1
lnðzi $ w þ $Þ %
p X i¼1
lnðwi Þ:
(Note that this problem may not be solvable efficiently.) A positive value of ! would ensure a proper trade-off between fit and complexity. However, the estimation method in [44] corresponds to the case when ! ! 0: In this case, the optimal solution of (8) is equal to the optimal solution of the two-stage method in [44] outlined above. Hence, the relative weight on fit goes to þ1 in a Poly est. Therefore, a proper trade-off between fit and complexity control is not achieved. As a result, the polyhedron defining the feasible estimates and, hence, its longest axis and center are sensitive to the errors in the previous responses. Because this longest axis and center are used to implement the two criteria reviewed above, the adaptive designs of [44] are sensitive to response error. In particular, once a wrong answer is given, the analytic center of the polyhedron will never converge to the true partworths value since the latter will be
VOL. 20, NO. 2,
FEBRUARY 2008
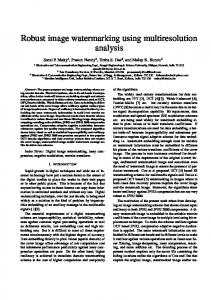
left outside of all subsequent polyhedra (hence, analytic center estimation is inconsistent). In contrast, our method reduces the endogeneity issues inherent in adaptive designs [22] by introducing a more proper trade-off between fit and complexity. We use simulations to illustrate this difference and study the evolution of estimation error as a function of the number of questions. The simulations are designed similarly to the ones we discuss in Section 4, which are in turn designed based on past studies—see Section 4. We randomly generated partworths for 500 respondents from a Gaussian with mean ð0:5#; #; 1:5#; 2#Þ and diagonal covariance matrix with all diagonal elements equal to #. Because the method in [44] requires positive partworths, we used the absolute value of the partworths generated from the Gaussian. Using each method (Poly-Q and RN-Q), we simulated 16 questions per respondent, each between four profiles (with four continuous attributes each). We used the logistic model standard in choice modeling [3], [33] to simulate the answers: The probability of selecting product j in question i is exij $w : Pij ¼ P4 xik $w k¼1 e
With that assumption, the parameter # in the above Gaussian distribution is a “magnitude” parameter that controls the response error (noise). We chose # conservatively such that the probability that an individual makes an error (does not choose the product with the maximum “true” utility) is, on the average, approximately the same as in the high-magnitude (low noise) case in the simulations reported in Section 4. This leads to # ¼ 8. We measured the estimation error using the Root Mean Square Error (RMSE) of the estimated partworths from the true (generated) ones. Both estimated and true partworths were normalized before computing the RMSE such that their absolute values summed to 1. Fig. 1 plots the average RMSE of the estimates as a function of the number of questions used for estimation. We observe that, although the accuracy of the RN-Q estimates continually improves after every question, the Poly-Q estimates stop improving after a few questions. As discussed above, once a wrong answer is given to a question, from that point on, Poly-Q will not converge to the true partworths vector as it will always try to find an estimate that is in agreement with the wrong answer given. In the theoretical scenario where response error is reduced to exactly 0 (not shown in the figure), this phenomenon is not observed, and Poly-Q also converges to the true partworths values.4 4. In that case, one could also improve the performance of RN-Q by using a smaller value for !—much like a larger value of ! may improve performance if the response error is higher—as known for RN estimation. However, as noted above, such adjustment of ! is not possible a priori when no prior data is available before the questionnaire. The selection of the parameter ! is a central and heavily researched problem in machinelearning methods like RN or SVM. Future research may further improve the performance of our method through a better selection of !.
Authorized licensed use limited to: ECOLE DES MINES PARIS. Downloaded on October 30, 2009 at 13:01 from IEEE Xplore. Restrictions apply.
ABERNETHY ET AL.: ELICITING CONSUMER PREFERENCES USING ROBUST ADAPTIVE CHOICE QUESTIONNAIRES
Fig. 1. The horizontal axis is the number of questions. The vertical axis is the average RMSE of the estimated utility functions from the true ones (among the 500 individuals). Poly-Q is the dotted line. The RN-based method (RN) is the solid line. The questions are for products with four real-valued attributes (see text).
4
SIMULATIONS
We now empirically compare the performance of RN-Q to that of previously published adaptive and nonadaptive methods. We use simulations often used in past research (described in this section), as well as an online field experiment (reported in the next section). The design of both experiments follows the marketing tradition.
4.1 Simulation Design We compare the performance of the following four types of questionnaire design methods (two adaptive and two nonadaptive): .
orthogonal and balanced designs (that is, D0 -efficient designs), . aggregate customized designs [4], [23], [35] where aggregate customization was based on the true mean of the population distribution, and relabeling and swapping were used to improve utility balance (see [4] for details), . adaptive designs obtained from Poly-Q, and . adaptive designs obtained from RN-Q. For each of these four questionnaires, we estimated the partworths using three different estimation methods:5 . . .
Poly est method in [44], RN est (see (6)), and Hierarchical Bayes (HB) estimation (HB est) [3], [33], [27], which is considered to be the state-of-the-art conjoint estimation method in marketing and widely used in practice. Unlike Poly est and RN est, HB simultaneously estimates the partworths for all respondents—hence, it is not an individual-level estimation method. Because it uses more information
5. The polyhedral estimation method by default uses information about the lowest level for each discrete attribute. We used this information as well for the RN and HB methods, the former by using virtual examples [16] and the latter by redrawing the partworths from the Metropolis Hastings algorithm until they satisfied the corresponding constraints [2].
151
Fig. 2. Example screen shot from the online experiment. An example of a choice-based question.
to estimate each individual partworths vector, we expect the HB est method to outperform the RN est and Poly est methods. Recall that the focus of this paper is not on estimation but on questionnaire design. Including HB in our simulations allows us to examine how the proposed questionnaire method performs when coupled with the state-of-the-art estimation method. Each estimation method may be applied to each type of questionnaire in practice (independent of possible theoretical reasons not to do so). Hence, following previous research, we consider all the combinations of design + estimation method. Note that, in many commercial applications, HB is used as the estimation method irrespective of the questionnaire design method. We based the design of our simulations on previously published simulation studies. In particular, in order to ensure complete orthogonal and aggregate customization designs, we followed [4], [44], [16] and assumed 16 questions per respondent, each between four alternatives described by four discrete attributes with four levels each, and used logistic probabilities to simulate the answers. Like these other papers, we also considered two levels of response accuracy and two levels of respondent heterogeneity (that is, how similar respondents’ partworths are), giving rise to four conditions. We considered different heterogeneity levels because one of the estimation methods, HB, is affected by the level of similarity among respondents. In each response accuracy + heterogeneity case, we generated five sets of 100 respondents, with partworths drawn from a normal distribution with mean 1 1 ð%#; % #; #; #Þ 3 3 for each attribute and with variance %2# . The magnitude parameter # was set to 0.5 and 2 in the low-accuracy and high-accuracy cells, respectively. The parameter %2# controls heterogeneity and was set, respectively, to %2# ¼ 0:5# and %2# ¼ 2# in the low and high-heterogeneity cells. Those values were used in the published simulations mentioned above and capture the range of response error and heterogeneity observed in practice [4], [44]. Our performance metric was the RMSE of the estimated partworths
Authorized licensed use limited to: ECOLE DES MINES PARIS. Downloaded on October 30, 2009 at 13:01 from IEEE Xplore. Restrictions apply.
152
IEEE TRANSACTIONS ON KNOWLEDGE AND DATA ENGINEERING,
TABLE 2 Simulation Results (RMSE of Estimated from True Utility Functions)
Bold numbers indicate best or not significantly different from the best at p < 0:05 for each (magnitude + heterogeneity + estimation method) combination. Orth is the orthogonal and balanced design, Cust is the aggregate customized one, Poly-Q is the adaptive design in [44], and RN-Q is the proposed one.
from the true (generated) ones. Both estimated and true partworths were normalized before computing the RMSE such that the partworths of each attribute summed to 0 and that their absolute values summed to 1.
4.2 Simulation Results We summarize the results in Table 2. We compare estimation methods first (for completeness) and question selection methods second (our focus). 4.2.1 Estimation Our results confirm previous findings (for example, [16], [44]) that HB outperforms other conjoint estimation methods. HB estimates the utilities of all respondents simultaneously, hence, implicitly “combining” information across respondents. Unlike HB, the RN est and Poly est methods are individual-level ones. In our case, HB provides the (significantly) lowest RMSE in all four Magnitude + Heterogeneity cells. In turn, RN est performs better than the other individual-level estimation method, Poly est: Out of the 16 Magnitude + Heterogeneity + Question selection method cells, RN est is significantly better (at the p < 0:05 level) in 11, tied in 2, and significantly worse in 3. Note that these significance tests, comparing the first two columns in Table 2, are not reported in Table 2. These results suggest that performance may be improved further by applying our general framework to other loss functions that pool information across respondents. Because HB does not minimize a loss function but rather samples from a posterior distribution, which is not given in closed form, the proposed framework is not directly applicable to HB est. Future research may construct estimation methods that combine data from multiple respondents and that are compatible with our framework. 4.2.2 Question Design The more relevant comparisons for this paper are the comparisons between the questionnaire design methods. The results suggest that the RN-based questionnaire design
VOL. 20, NO. 2,
FEBRUARY 2008
method is the best overall: It is significantly the best or tied with the best in eight of 12 Magnitude + Heterogeneity + Estimation method cells and the best or tied with the best in three of the four Magnitude + Heterogeneity cells. (The latter comparisons consider the best performance across all estimation methods.) We have argued that one of the main contributions of our approach is to produce adaptive CBC designs that are robust to response error. Two types of comparisons are possible in order to test this claim. Comparing RN-Q to the other adaptive method (Poly-Q) allows us to evaluate whether the RN-based designs are more robust to noise than the other choice-based adaptive designs. Comparing RN-Q to the nonadaptive methods also allows us to evaluate conditions under which the benefits from adaptive questionnaires overweight endogeneity issues. Let us start with the first comparison. RN-Q is significantly better than Poly-Q in 10, tied in 1, and significantly worse in one of the 12 Magnitude + Heterogeneity + Estimation Method cells. More importantly, RN-Q is significantly better than Poly-Q in all six low magnitude (high-response error) cells. Using HB est (the best estimation method), RN-Q performs on the average 11.9 percent better than Poly-Q in the high-response-error conditions, whereas it performs only 2.9 percent better on the average, in the lowresponse-error conditions. We finally compare RN-Q to the nonadaptive benchmarks (orthogonal and customized designs). In the high-magnitude conditions, RN-Q (as well as Poly-Q—hence, both adaptive designs) systematically outperforms both nonadaptive benchmarks, confirming the attractiveness of adaptive methods when response error is low, established in previous simulations (for example, [44]). The more interesting comparisons are when response error is high (low magnitude). RN-based questionnaires perform better than both nonadaptive methods in three of the six low magnitude + Heterogeneity + Estimation method cells and one of two low magnitude + Heterogeneity cells. This shows that, with RN-based adaptive designs, the benefits from adaptive questionnaires can overweight endogeneity issues even under high levels of response error. RN-based questionnaires achieve the lowest performance relative to nonadaptive benchmarks in the low-magnitude + low-heterogeneity condition. In that case, two factors work against adaptive methods as discussed in [44]. First, the endogeneity effects are amplified due to the higher response error. Second, as discussed in [44] and confirmed by our simulations, adaptive methods (Poly-Q and RN-Q) do not perform relatively as well relative to nonadaptive benchmarks (Orth and Cust) under lower levels of heterogeneity, as the similarity among respondents makes it more attractive to use a single questionnaire for everyone.
5
AN ONLINE EXPERIMENT
We next tested the proposed framework using an online field experiment. The sets of question selection methods and partworths estimation methods tested in this experiment were the same as those tested in the previous simulations (question selection methods: Orthogonal design, Aggregate customization,6 Poly-Q, and RN-Q; estimation methods: 6. The prior used by aggregate customization was obtained from a pretest involving 50 students from a large US university.
Authorized licensed use limited to: ECOLE DES MINES PARIS. Downloaded on October 30, 2009 at 13:01 from IEEE Xplore. Restrictions apply.
ABERNETHY ET AL.: ELICITING CONSUMER PREFERENCES USING ROBUST ADAPTIVE CHOICE QUESTIONNAIRES
153
TABLE 3 Comparison of the Question Selection Methods
Mean and median (across 125 respondents) of the average performance across questions 3-8 and 9-16. The estimation method used is HB. The higher a number, the better.
Fig. 3. Screen shot from the online experiment: The final external validity ranking task.
Poly est, RN est, and HB est). Five hundred respondents from an online panel were randomly assigned to one of the four question selection methods, resulting in 125 respondents per questionnaire. Each respondent completed a 16-question design obtained by the corresponding method, followed by four randomly designed holdout questions (the transition from the questionnaire to the holdouts was seamless), a filler task (as a transition), and an external validity ranking task. In this last task, the respondents were asked to rank six profiles (from the most to least preferred), randomly selected from a 16 profile orthogonal and balanced design (different from the one used for the questionnaire). See Figs. 2 and 3 for example screen shots from the experiment. The product chosen for this experiment was digital cameras. We focused on five attributes with four levels each: Price ($500, $400, $300, and $200), Resolution (2, 3, 4, and 5 Megapixels), Battery Life (150, 300, 450, and 600 pictures), Optical Zoom (2+, 3+, 4+, and 5+), and Camera Size (SLR, Medium, Pocket, and Ultra compact). The attributes were introduced and described to the respondents before the questionnaire. Each choice question comprised four profiles. We measured performance using the following three metrics: 1.
the percentage of the four holdouts correctly predicted (“Holdout hit rate”), 2. the correlation between predicted and observed rankings in the external validity task (“Choice correlation”), and 3. the proportion of first choices correctly predicted in the external validity task (“Choice hit rate”). We report the results in Table 3. In agreement with the simulations and past research, HB was again the best estimation method in all cases; hence, for simplicity, we
only report the performance of the HB estimates for the four types of questionnaires. We estimate the partworths based on three to 16 questions and compute the performance of each intermediate estimate. To test the relative performance of the different questionnaires when there are few versus more questions, we report the average performance for questions 3-8 (not including questions 1 and 2, the first being a random one) and questions 9-16. Moreover, we report both the mean and the median (across respondents) of the performance, the latter being less sensitive to possible “outlier respondents.” We use bold numbers in Table 3 to indicate the best performing method in each performance metric + (3-8 versus 9-16 questions) + (mean versus median) combination. Table 3 shows that the proposed question design method is the best in eight out of the 12 cases, more than any other method. In terms of the median, it is the best in five out of six cases. A series of pairwise Mann-Whitney U-tests to compare RN-Q to each of the other questionnaires shows that RN-Q is never significantly worse and is significantly better (at the 0.05 level) than each of the other questionnaires in at least one of the (3-8 versus 9-16) + (performance metric) possible comparisons. In conclusion, the experiment confirms the relative advantage offered by the proposed questionnaire design method.
6
CONCLUSIONS
We have developed a framework for designing robust adaptive CBC questionnaires, an important problem in marketing, based on experimental design and statistical learning theory principles. We have shown how to use complexity control to design questionnaires that are less affected by response error and endogeneity. We have validated our framework using simulations, as well as a field experiment, and discussed similarities and differences between our method and previous nonadaptive and adaptive ones. The recently proposed adaptive polyhedral CBC estimation method [43], [44] can be seen as a special case within our framework, albeit with an arbitrarily small weight on complexity control leading to greater sensitivity to response error.
Authorized licensed use limited to: ECOLE DES MINES PARIS. Downloaded on October 30, 2009 at 13:01 from IEEE Xplore. Restrictions apply.
154
IEEE TRANSACTIONS ON KNOWLEDGE AND DATA ENGINEERING,
Various research questions can be explored in the future. For example, one could explore ways of better tuning the parameter ! adaptively as respondents answer questions. There are also open theoretical questions such as the study of the nonasymptotic rate of convergence and the consistency properties of our methods. Another exciting area for future research is the exploration of alternative definitions of complexity that capture the “cognitive” complexity of making decisions. In particular, a lot of work in consumer research indicates that people use various heuristics for making choices [31], [6]. Such heuristics may be modeled as penalties or constraints on the estimated utility functions, much along the lines of the standard complexity control penalty kwk2 used in machine learning. A fundamental premise of a large body of work in machine learning supports that constraints (for example, in the forms of penalties) on the partworths (such as the complexity control kwk2 ) lead to estimates that are more accurate and robust to noise (see, for example, [45]). Other constraints (for example, other complexity controls), based on prior knowledge about how people make choices, may further improve performance.
ACKNOWLEDGMENTS The author names are listed alphabetically. J. Abernethy was a researcher at INSEAD during this work. The authors are indebted to Eric Bradlow, Fred Feinberg, John Hauser, John Liechty, Oded Netzer, Foster Provost, and Alexander Tuzhilin for their helpful comments and suggestions. They would also like to thank the seminar participants at NYU, Columbia, MIT, and Wharton for their feedback, as well as the comments and suggestions of the anonymous reviewers and the editors. A preliminary version of this paper was presented at the International Workshop on Customer Relationship Management: Data Mining Meets Marketing that was held in New York on 18-19 November 2005.
REFERENCES [1]
S. Addelman, “Symmetrical and Asymmetrical Fractional Factorial Plans,” Technometrics, vol. 4, pp. 47-58, Feb. 1962. [2] G.M. Allenby, N. Arora, and J.L. Ginter, “Incorporating Prior Knowledge into the Analysis of Conjoint Studies,” J. Marketing Research, vol. 32, pp. 152-162, May 1995. [3] G.M. Allenby and P.E. Rossi, “Marketing Models of Consumer Heterogeneity,” J. Econometrics, vol. 89, pp. 57-78, Mar./Apr. 1999. [4] N. Arora and J. Huber, “Improving Parameter Estimates and Model Prediction by Aggregate Customization in Choice Experiments,” J. Consumer Research, vol. 28, Sept. 2001. [5] M. Ben-Akiva and S.R. Lerman, Discrete Choice Analysis: Theory and Application to Travel Demand. MIT Press, 1985. [6] J.R. Bettman, M.F. Luce, and J.W. Payne, “Constructive Consumer Choice Processes,” J. Consumer Research, vol. 25, Dec. 1998. [7] D.S. Bunch, J.J. Louviere, and D. Anderson, “A Comparison of Experimental Design Strategies for Multinomial Logit Models: The Case of Generic Attributes,” working paper, Graduate School of Management, Univ. of California at Davis, 1994. [8] D. Carroll and P. Green, “Psychometric Methods in Marketing Research: Part I, Conjoint Analysis,” J. Marketing Research, vol. 32, pp. 385-391, Nov. 1995. [9] P. Cattin and D.R. Wittink, “Commercial Use of Conjoint Analysis: A Survey,” J. Marketing, vol. 46, pp. 44-53, 1982. [10] K. Chaloner and I. Verdinelli, “Bayesian Experimental Design: A Review,” Statistical Science, vol. 10, no. 3, pp. 273-304, 1995.
VOL. 20, NO. 2,
FEBRUARY 2008
[11] A.D. Cohn, Z. Ghahramani, and M. Jordan, “Active Learning with Statistical Models,” J. Artificial Intelligence Research, vol. 4, pp. 129145, 1996. [12] D.R. Cook and C.J. Nachtsheim, “A Comparison of Algorithms for Constructing Exact E-Optimal Designs,” Technometrics, vol. 22, pp. 315-324, Aug. 1980. [13] C. Cortes and V. Vapnik, “Support Vector Networks,” Machine Learning, vol. 20, pp. 1-25, 1995. [14] D. Cui and D. Curry, “Predicting Consumer Choice Using Support Vector Machines with Benchmark Comparisons to Multinomial Logit,” Marketing Science, vol. 24, no. 4, pp. 595-615, 2005. [15] T. Evgeniou, M. Pontil, and T. Poggio, “Regularization Networks and Support Vector Machines,” Advances in Computational Math., vol. 13, pp. 1-50, 2000. [16] T. Evgeniou, C. Boussios, and G. Zacharia, “Generalized Robust Conjoint Estimation,” Marketing Science, vol. 24, no. 3, 2005. [17] I. Ford, C.P. Kitsos, and D.M. Titterington, “Recent Advances in Nonlinear Experimental Designs,” Technometrics, vol. 31, pp. 4960, 1989. [18] P. Green and V. Srinivasan, “Conjoint Analysis in Consumer Research: Issues and Outlook,” Consumer Research, vol. 5, no. 2, pp. 103-123, 1978. [19] P. Green and V. Srinivasan, “Conjoint Analysis in Marketing: New Developments with Implications for Research and Practice,” J. Marketing, vol. 54, no. 4, pp. 3-19, 1990. [20] W. Greene, Econometric Analysis. Prentice Hall, 2003. [21] J.R. Hauser, G. Tellis, and A. Griffin, “Research on Innovation: A Review and Agenda for Marketing Science,” Marketing Science, 2006. [22] J.R. Hauser and O. Toubia, “The Impact of Endogeneity and Utility Balance in Conjoint Analysis,” Marketing Science, vol. 24, no. 3, 2005. [23] J. Huber and K. Zwerina, “The Importance of Utility Balance in Efficient Choice Designs,” J. Marketing Research, vol. 33, pp. 307317, 1996. [24] B. Kanninen, “Optimal Design for Multinomial Choice Experiments,” J. Marketing Research, vol. 36, pp. 214-227, May 2002. [25] W.F. Kuhfeld, R.D. Tobias, and M. Garratt, “Efficient Experimental Design with Marketing Applications,” J. Marketing Research, vol. 31, no. 4, pp. 545-557, Nov. 1994. [26] W.F. Kuhfeld, “Marketing Research Methods in SAS,” SAS Inst., http://support.sas.com/techsup/technote/ts722.pdf, 2005. [27] P.J. Lenk, W.S. DeSarbo, P.E. Green, and M.R. Young, “Hierarchical Bayes Conjoint Analysis: Recovery of Partworth Heterogeneity from Reduced Experimental Designs,” Marketing Science, vol. 15, pp. 173-91, 1996. [28] D. McFadden, “Conditional Logit Analysis of Qualitative Choice Behavior,” Frontiers in Econometrics, P. Zarembka, ed., pp. 105-142, Academic Press, 1974. [29] T.J. Mitchell, “An Algorithm for the Construction of D-Optimal Experimental Designs,” Technometrics, vol. 16, pp. 203-210, May 1974. [30] W.K. Newey and D. McFadden, “Large Sample Estimation and Hypothesis Testing,” Handbook of Econometrics, R.F. Engle and D.L. McFadden, eds., vol. 4, Elsevier Science, 1994. [31] J.W. Payne, J.R. Bettman, and E.J. Johnson, The Adaptive Decision Maker. Cambridge Univ. Press, 1993. [32] F. Pukelsheim, Optimal Design of Experiments. John Wiley & Sons, 1993. [33] P.E. Rossi and G.M. Allenby, “Bayesian Statistics and Marketing,” Marketing Science, vol. 22, no. 3, pp. 304-328, 2003. [34] M. Saar-Tsechansky and F. Provost, “Active Sampling for Class Probability Estimation and Ranking,” Machine Learning, vol. 54, no. 2, pp. 153-178, 2004. [35] Z. Sandor and M. Wedel, “Designing Conjoint Choice Experiments Using Managers’ Prior Beliefs,” J. Marketing Research, vol. 38, no. 4, pp. 430-444, 2001. [36] “ACA System: Adaptive Conjoint Analysis,” ACA Manual, Sawtooth Software, 1996. [37] “ACA 5.0 Technical Paper,” Sawtooth Software, 2002. [38] G. Sonnevend, “An ‘Analytic’ Center for Polyhedrons and New Classes of Global Algorithms for Linear (Smooth, Convex) Programming,” Control and Information Sciences, vol. 84, pp. 866876, 1985.
Authorized licensed use limited to: ECOLE DES MINES PARIS. Downloaded on October 30, 2009 at 13:01 from IEEE Xplore. Restrictions apply.
ABERNETHY ET AL.: ELICITING CONSUMER PREFERENCES USING ROBUST ADAPTIVE CHOICE QUESTIONNAIRES
[39] V. Srinivasan and A.D. Shocker, “Linear Programming Techniques for Multidimensional Analysis of Preferences,” Psychometrica, vol. 38, no. 3, pp. 337-369, 1973. [40] D.M. Steinberg and W.G. Hunter, “Experimental Design: Review and Comment,” Technometrics, vol. 26, pp. 71-97, 1984. [41] A.N. Tikhonov and V.Y. Arsenin, Solutions of Ill-Posed Problems, W.H. Winston, ed. Wiley, 1977. [42] S. Tong and D. Koller, “Support Vector Machine Active Learning with Applications to Text Classification,” Proc. 17th Int’l Conf. Machine Learning, 2000. [43] O. Toubia, D.I. Simester, J.R. Hauser, and E. Dahan, “Fast Polyhedral Adaptive Conjoint Estimation,” Marketing Science, vol. 22, no. 3, 2003. [44] O. Toubia, J.R. Hauser, and D.I. Simester, “Polyhedral Methods for Adaptive Choice-Based Conjoint Analysis,” J. Marketing Research, vol. 41, pp. 116-131, 2004. [45] V. Vapnik, Statistical Learning Theory. John Wiley & Sons, 1998. [46] M.K. Warmuth, G. Ra¨tsch, M. Mathieson, J. Liao, and C. Lemmen, “Active Learning in the Drug Discovery Process,” Advances in Neural Information Processings Systems, T.G. Dietterich, S. Becker, and Z. Ghahramani, eds., vol. 14, 2002. [47] D.R. Wittink and P. Cattin, “Commercial Use of Conjoint Analysis: An Update,” J. Marketing, vol. 53, no. 3, pp. 91-96, 1989. Jacob Abernethy received the undergraduate degree in mathematics from the Massachusetts Institute of Technology. He began doing research in machine learning at INSEAD and later went on to finish a master’s degree at the Toyota Technological Institute, Chicago. He is now working on the PhD degree in computer science at the University of California, Berkeley.
155
Olivier Toubia received the graduate degree from Ecole Centrale Paris (Paris) and the MS degree in operations research and the PhD degree in marketing from the Massachusetts Institute of Technology. He is an assistant professor of marketing at the Columbia Business School. His research interests include adaptive experimental design, conjoint analysis, preference measurement, idea generation, and idea screening.
Jean-Philippe Vert received the graduate degree from Ecole Polytechnique and Ecole des Mines de Paris, and the MS and the PhD degrees in mathematics from the Paris 6 University. He is a researcher and director of the Center for Computational Biology at Ecole des Mines de Paris. His research interests include development and analysis of statistical machine-learning algorithms and their applications to various fields.
. For more information on this or any other computing topic, please visit our Digital Library at www.computer.org/publications/dlib.
Theodoros Evgeniou received the BS degrees in mathematics and computer science, the MEng degree in computer science, and the PhD degree in computer science, all from the Massachusetts Institute of Technology. He is an assistant professor of technology management and decision sciences at INSEAD. His research interests include developing, using, and studying novel machine-learning methods for gaining insights in problems and applications relevant to organizations.
Authorized licensed use limited to: ECOLE DES MINES PARIS. Downloaded on October 30, 2009 at 13:01 from IEEE Xplore. Restrictions apply.